Transcriptome analysis reveals the difference between "healthy" and "common" aging and their connection with age-related diseases
- PMID: 32077223
- PMCID: PMC7059150
- DOI: 10.1111/acel.13121
Transcriptome analysis reveals the difference between "healthy" and "common" aging and their connection with age-related diseases
Abstract
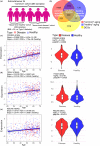
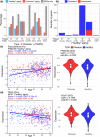
A key goal of aging research was to understand mechanisms underlying healthy aging and develop methods to promote the human healthspan. One approach is to identify gene regulations unique to healthy aging compared with aging in the general population (i.e., "common" aging). Here, we leveraged Genotype-Tissue Expression (GTEx) project data to investigate "healthy" and "common" aging gene expression regulations at a tissue level in humans and their interconnection with diseases. Using GTEx donors' disease annotations, we defined a "healthy" aging cohort for each tissue. We then compared the age-associated genes derived from this cohort with age-associated genes from the "common" aging cohort which included all GTEx donors; we also compared the "healthy" and "common" aging gene expressions with various disease-associated gene expressions to elucidate the relationships among "healthy," "common" aging and disease. Our analyses showed that 1. GTEx "healthy" and "common" aging shared a large number of gene regulations; 2. Despite the substantial commonality, "healthy" and "common" aging genes also showed distinct function enrichment, and "common" aging genes had a higher enrichment for disease genes; 3. Disease-associated gene regulations were overall different from aging gene regulations. However, for genes regulated by both, their regulation directions were largely consistent, implying some aging processes could increase the susceptibility to disease development; and 4. Possible protective mechanisms were associated with some "healthy" aging gene regulations. In summary, our work highlights several unique features of GTEx "healthy" aging program. This new knowledge could potentially be used to develop interventions to promote the human healthspan.
Keywords: GTEx; age-related diseases; common aging; gene expression; healthy aging; human aging signatures; unhealthy aging.
© 2020 The Authors. Aging Cell published by the Anatomical Society and John Wiley & Sons Ltd.
Conflict of interest statement
None declared.
Figures


References
-
- Amberger, J. S. , Bocchini, C. A. , Schiettecatte, F. , Scott, A. F. , & Hamosh, A. (2015). OMIM.org: Online Mendelian Inheritance in Man (OMIM(R)), an online catalog of human genes and genetic disorders. Nucleic Acids Research, 43(Database issue), D789–D798. 10.1093/nar/gku1205 - DOI - PMC - PubMed
-
- Benayoun, B. A. , Pollina, E. A. , Singh, P. P. , Mahmoudi, S. , Harel, I. , Casey, K. M. , … Brunet, A. (2019). Remodeling of epigenome and transcriptome landscapes with aging in mice reveals widespread induction of inflammatory responses. Genome Research, 29(4), 697–709. 10.1101/gr.240093.118 - DOI - PMC - PubMed
-
- Berchtold, N. C. , Cribbs, D. H. , Coleman, P. D. , Rogers, J. , Head, E. , Kim, R. , … Cotman, C. W. (2008). Gene expression changes in the course of normal brain aging are sexually dimorphic. Proceedings of the National Academy of Sciences of the United States of America, 105(40), 15605–15610. 10.1073/pnas.0806883105 - DOI - PMC - PubMed
Publication types
MeSH terms
Grants and funding
LinkOut - more resources
Full Text Sources
Other Literature Sources
Medical

