. 2020 Jun 27;29(10):1745-1756.
doi: 10.1093/hmg/ddaa030.

Genome-wide assessment of genetic risk for systemic lupus erythematosus and disease severity

Affiliations

Genome-wide assessment of genetic risk for systemic lupus erythematosus and disease severity

Lingyan Chen et al. Hum Mol Genet. .

Abstract

Using three European and two Chinese genome-wide association studies (GWAS), we investigated the performance of genetic risk scores (GRSs) for predicting the susceptibility and severity of systemic lupus erythematosus (SLE), using renal disease as a proxy for severity. We used four GWASs to test the performance of GRS both cross validating within the European population and between European and Chinese populations. The performance of GRS in SLE risk prediction was evaluated by receiver operating characteristic (ROC) curves. We then analyzed the polygenic nature of SLE statistically. We also partitioned patients according to their age-of-onset and evaluated the predictability of GRS in disease severity in each age group. We found consistently that the best GRS in the prediction of SLE used SNPs associated at the level of P < 1e-05 in all GWAS data sets and that SNPs with P-values above 0.2 were inflated for SLE true positive signals. The GRS results in an area under the ROC curve ranging between 0.64 and 0.72, within European and between the European and Chinese populations. We further showed a significant positive correlation between a GRS and renal disease in two independent European GWAS (Pcohort1 = 2.44e-08; Pcohort2 = 0.00205) and a significant negative correlation with age of SLE onset (Pcohort1 = 1.76e-12; Pcohort2 = 0.00384). We found that the GRS performed better in the prediction of renal disease in the 'later onset' compared with the 'earlier onset' group. The GRS predicts SLE in both European and Chinese populations and correlates with poorer prognostic factors: young age-of-onset and lupus nephritis.


Figures

Figure 1
Figure 1
Overview study design.
Figure 2
Figure 2
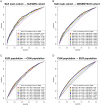
ROCs and AUCs of models in SLE prediction in European cohorts and between ancestries. GRSs for the prediction of SLE in the SLEGEN cohort (A) and Genentech cohort (B) were generated from SNPs of LD clumping, and threshold derived from the SLE main cohort. All GRSs for the training-and-validation in European cohorts were generated with two MHC tag SNPs derived from the European GWAS (See Materials and Methods). GRSs for the prediction of SLE across populations (C) and (D) were generated from SNPs of LD clumping and threshold without MHC tag SNPs. The ‘GRS at Pth’ represented the GRS in the SLE prediction model, which was derived from the LD clumping at the according GWAS P value threshold.
Figure 3
Figure 3
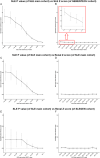
Polygenic test of SLE and renal disease. Polygenic test of SLE in genentech cohort (A and B) and polygenic test of renal disease in the SLE main cohort (C and D) and SLEGEN cohort (E and F). The SLE main cohort was used to generate a P value for each SNP, to stratify the SNPs into groups for the Z score calculation of SLE association or renal association.
Figure 4
Figure 4
GRS over levels of disease: controls/SLE renal (−)/SLE renal (+). The violin-and-box plots show the summary GRS for each level of the disease in the SLE main cohort (A) and the SLEGEN cohort (B). The violins show the distribution of the GRS across each group. The bottom line of the box inside the violin is the first quantile, the top line is the third quantile and the box is divided at the median. Sample size (N) of each group is showed within brackets below the group name. Note that GRSs for SLE main cohort and SLEGEN cohort are generated by 93 non-MHC SNPs and 2 MHC tag SNPs—a total of 95 SNPs (Supplementary Material, Table S9).
Figure 5
Figure 5
Relationship of quintiles of the GRS and risk of renal disease within SLE patients. Plots show the ORs of renal disease for the SLE main cohort (A) and the SLEGEN cohort (B), comparing each of the upper four GRS quintiles with the lowest quintile; dotted lines represent the 95% CI; horizontal black dotted lines represent OR = 1.
Figure 6
Figure 6
Age of SLE onset in patients of renal (−)/renal (+). The violin-and-box plots show the age of SLE onset for each level of the disease in the SLE main cohort (A) and the SLEGEN cohort (B). The violins show the distribution of the Age of SLE onset across each group. The bottom line of the box inside the violin is the first quantile, the top line is the third quantile and the box is divided at the median. Sample size (N) of each group is showed within brackets below the group name.
Figure 7
Figure 7
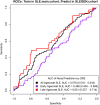
ROC curves for models predicting a diagnosis of renal disease in SLE patients using GRS, split by age-of-onset. The models were trained in the SLE main cohort and tested in the SLEGEN cohort. The plots showed the ROC curves in the prediction of renal disease in SLE patients with GRS as a predictor. The ROC curve in black was trained and tested with all SLE samples, the purple curve was trained and tested in the ‘Early age onset’ patients (≤ 30 years) and the red curve was trained and tested in the ‘Late age onset’ group. AUC, area under the ROC curve, is showed with 95% CI in brackets.

References

    1. Kaul A., Gordon C., Crow M.K., Touma Z., Urowitz M.B., Vollenhoven R., Ruiz-Irastorza G. and Hughes G. (2016) Systemic lupus erythematosus. Nat. Rev. Dis. Primers., 2, 16039. - PubMed
    1. Yen E.Y. and Singh R.R. (2018) Brief report: lupus-an unrecognized leading cause of death in young females: a population-based study using nationwide death certificates, 2000-2015. Arthritis Rheumatol., 70, 1251–1255. - PMC - PubMed
    1. Davidson A. (2016) What is damaging the kidney in lupus nephritis? Nat. Rev. Rheumatol., 12, 143–153. - PMC - PubMed
    1. Feldman C.H., Hiraki L.T., Liu J., Fischer M.A., Solomon D.H., Alarcon G.S., Winkelmayer W.C. and Costenbader K.H. (2013) Epidemiology and sociodemographics of systemic lupus erythematosus and lupus nephritis among US adults with medicaid coverage, 2000-2004. Arthritis Rheum., 65, 753–763. - PMC - PubMed
    1. Peschken C.A., Katz S.J., Silverman E., Pope J.E., Fortin P.R., Pineau C., Smith C.D., Arbillaga H.O., Gladman D.D., Urowitz M. et al. (2009) The 1000 Canadian faces of lupus: determinants of disease outcome in a large multiethnic cohort. J. Rheumatol., 36, 1200–1208. - PubMed

Publication types