. 2020 Jun 1;37(6):1790-1808.
doi: 10.1093/molbev/msaa038.

Predicting the Landscape of Recombination Using Deep Learning

Affiliations

Predicting the Landscape of Recombination Using Deep Learning

Jeffrey R Adrion et al. Mol Biol Evol. .

Abstract

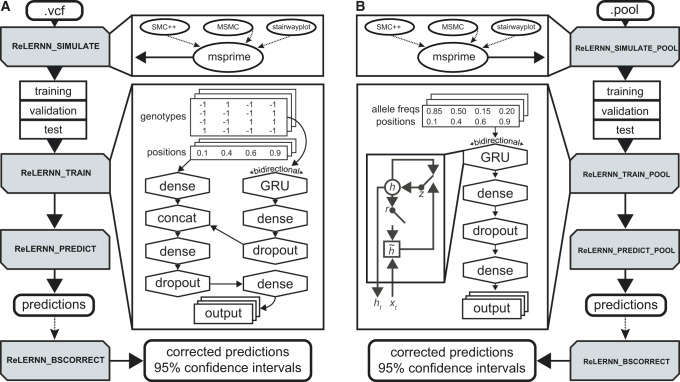
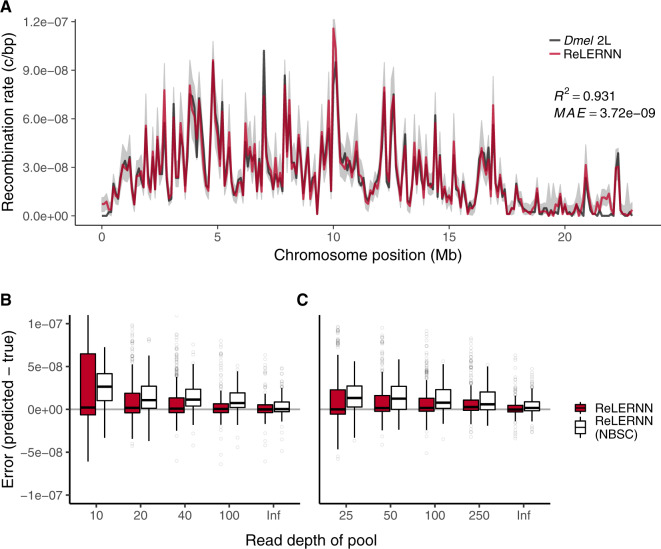
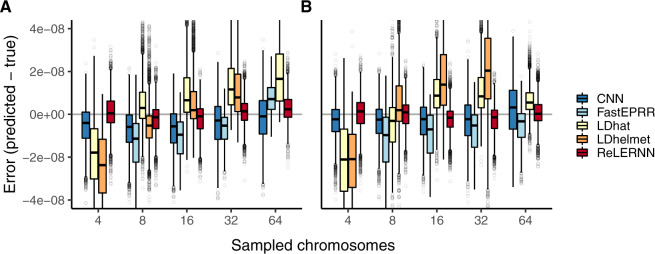
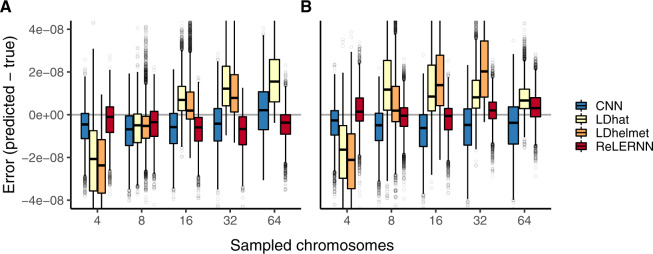
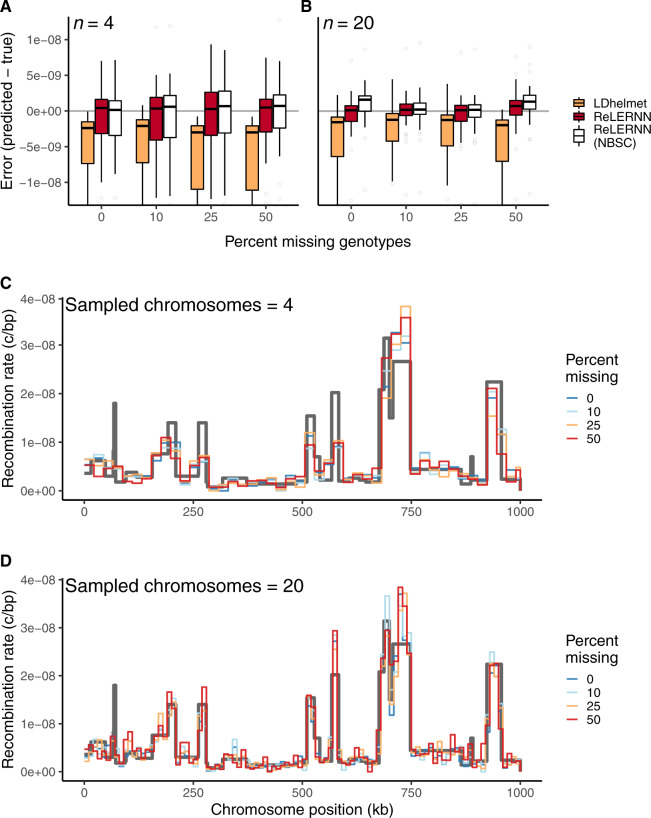
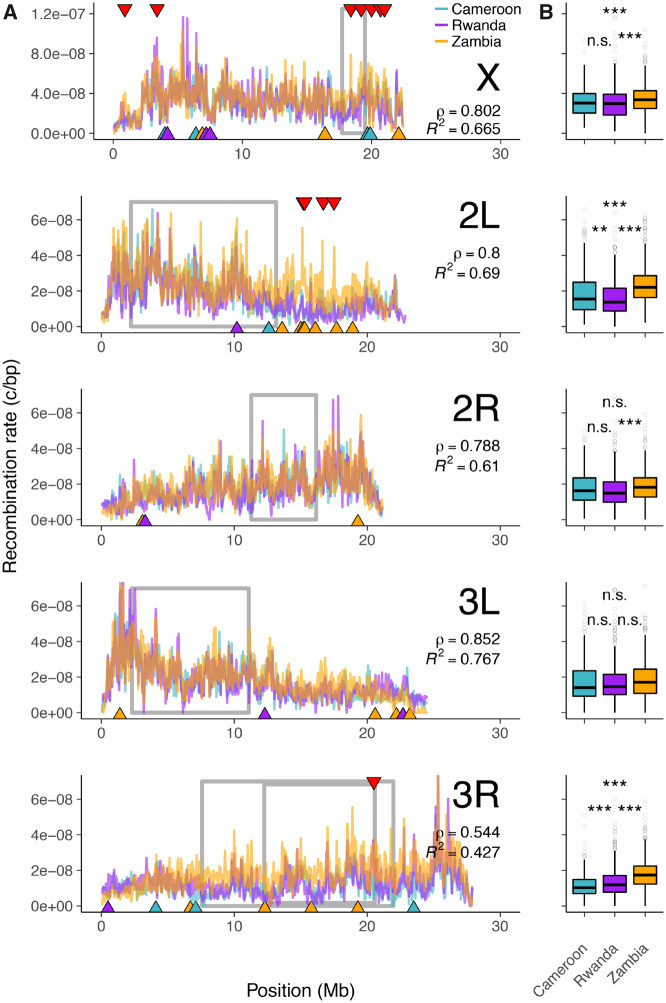
Accurately inferring the genome-wide landscape of recombination rates in natural populations is a central aim in genomics, as patterns of linkage influence everything from genetic mapping to understanding evolutionary history. Here, we describe recombination landscape estimation using recurrent neural networks (ReLERNN), a deep learning method for estimating a genome-wide recombination map that is accurate even with small numbers of pooled or individually sequenced genomes. Rather than use summaries of linkage disequilibrium as its input, ReLERNN takes columns from a genotype alignment, which are then modeled as a sequence across the genome using a recurrent neural network. We demonstrate that ReLERNN improves accuracy and reduces bias relative to existing methods and maintains high accuracy in the face of demographic model misspecification, missing genotype calls, and genome inaccessibility. We apply ReLERNN to natural populations of African Drosophila melanogaster and show that genome-wide recombination landscapes, although largely correlated among populations, exhibit important population-specific differences. Lastly, we connect the inferred patterns of recombination with the frequencies of major inversions segregating in natural Drosophila populations.

Keywords: deep learning; machine learning; population genomics; recombination.


Figures

<sc>Fig</sc>. 1.
Fig. 1.
A cartoon depicting a typical workflow using ReLERNN’s four modules (shaded boxes) for (A) individually sequenced genomes or (B) pooled sequences. ReLERNN can optionally (dotted lines) utilize output from stairwayplot, SMC++, and MSMC to simulate under a demographic history with msprime. Training inlays show the network architectures used, with the GRU inlay in (B) depicting the gated connections within each hidden unit. Here, r, z, ht, and ht˜ are the reset gate, update gate, activation, and candidate activation, respectively (Cho et al. 2014). The genotype matrix encodes alleles as reference (−1), alternative (1), or padded/missing data (0; not shown). Variant positions are encoded along the real number line (0–1).
<sc>Fig</sc>. 2.
Fig. 2.
(A) Recombination rate predictions for a simulated Drosophila chromosome (black line) using ReLERNN for individually sequenced genomes (red line). The recombination landscape was simulated for n = 20 chromosomes under constant population size using msprime (Kelleher et al. 2016), with per-base crossover rates taken from D. melanogaster chromosome 2L (Comeron et al. 2012). Gray ribbons represent 95% CI. R2 is reported for the general linear model of predicted rates on true rates and mean absolute error was calculated across all 100-kb windows. (B) Distribution of raw error (rpredictedrtrue) using ReLERNN for Pool-seq data. Pools simulated from the same recombination landscape as above, with n = 20 and (C) n = 50 chromosomes across a range of simulated read depths (0.5× to 5×; Inf represents infinite simulated sequencing depth). Both the bootstrap-corrected predictions (red) and the nonbootstrap-corrected (NBSC; white) predictions are shown.
<sc>Fig</sc>. 3.
Fig. 3.
(A) Distribution of raw error (rpredictedrtrue) for each method across 5,000 simulated chromosomes (1,000 for FastEPRR). Independent simulations were run under a model of population size expansion or (B) demographic equilibrium. Sampled chromosomes indicate the number of independent sequences that were sampled from each msprime (Kelleher et al. 2016) coalescent simulation. LDhelmet was not able be used with n = 64 chromosomes and FastEPRR was not able to be used with n = 4.
<sc>Fig</sc>. 4.
Fig. 4.
(A) Distribution of raw error (rpredictedrtrue) for each method across 5,000 simulated chromosomes after model misspecification. For the CNN and ReLERNN, predictions were made by training on equilibrium simulations while testing on sequences simulated under a model of population size expansion or (B) training on demographic simulations while testing on sequences simulated under equilibrium. For LDhat and LDhelmet, the lookup tables were generated using parameters values that were estimated from simulations where the model was misspecified in the same way as described for the CNN and ReLERNN above. Sampled chromosomes indicate the number of independent sequences that were sampled from each msprime (Kelleher et al. 2016) coalescent simulation. LDhelmet was not able be used with n = 64 chromosomes and the demographic model could not be intentionally misspecified using FastEPRR.
<sc>Fig</sc>. 5.
Fig. 5.
(A) Distribution of raw error (rpredictedrtrue) for LDhelmet and ReLERNN when presented with varying levels of missing genotypes for simulations with n = 4 and (B) n = 20 chromosomes. (C) Fine-scale rate predictions generated by ReLERNN for a 1-Mb recombination landscape (gray line) simulated with varying levels of missing genotypes, for n = 4 and (D) n = 20 chromosomes.
<sc>Fig</sc>. 6.
Fig. 6.
(A) Genome-wide recombination landscapes for Drosophila melanogaster populations from Cameroon (teal lines), Rwanda (purple lines), and Zambia (orange lines). Gray boxes denote the inversion boundaries predicted to be segregating in these samples (Corbett-Detig and Hartl 2012; Pool et al. 2012). Red triangles mark the top 1% of global outlier windows for recombination rate. Blue, purple, and orange triangles mark the top 1% of population-specific outlier windows for recombination rate, with triangle color indicating the outlier population (see Materials and Methods). (B) Per-chromosome recombination rates for each population. Spearman’s ρ and R2 are reported as the mean of pairwise estimates between populations for each chromosome. **P < 0.01 and ***P < 0.001 are based on Tukey’s HSD tests for all pairwise comparisons.

References

    1. 1000 Genomes Project Consortium, Auton A, Brooks LD, Durbin RM, Garrison EP, Kang HM, Korbel JO, Marchini JL, McCarthy S, McVean GA, et al. 2015. A global reference for human genetic variation. Nature 526(7571):68. - PMC - PubMed
    1. Abadi M, Agarwal A, Barham P, Brevdo E, Chen Z, Citro C, Corrado GS, Davis A, Dean J, Devin M, et al. 2015. TensorFlow: large-scale machine learning on heterogeneous systems. Available from: https://www.tensorflow.org/, software available from tensorflow.org.
    1. Aulard S, David JR, Lemeunier F.. 2002. Chromosomal inversion polymorphism in Afrotropical populations of Drosophila melanogaster. Genet Res. 79(1):49–63. - PubMed
    1. Ayala D, Guerrero RF, Kirkpatrick M.. 2013. Reproductive isolation and local adaptation quantified for a chromosome inversion in a malaria mosquito. Evolution 67(4):946–958. - PubMed
    1. Barton N. 1995. A general model for the evolution of recombination. Genet Res. 65(2):123–144. - PubMed

Publication types

LinkOut - more resources