. 2020 Apr;32(14):e1903759.
doi: 10.1002/adma.201903759. Epub 2020 Feb 20.

Sequential Targeting in Crosslinking Nanotheranostics for Tackling the Multibarriers of Brain Tumors

Affiliations

Sequential Targeting in Crosslinking Nanotheranostics for Tackling the Multibarriers of Brain Tumors

Hao Wu et al. Adv Mater. 2020 Apr.

Abstract

The efficacy of therapeutics for brain tumors is seriously hampered by multiple barriers to drug delivery, including severe destabilizing effects in the blood circulation, the blood-brain barrier/blood-brain tumor barrier (BBB/BBTB), and limited tumor uptake. Here, a sequential targeting in crosslinking (STICK) nanodelivery strategy is presented to circumvent these important physiological barriers to improve drug delivery to brain tumors. STICK nanoparticles (STICK-NPs) can sequentially target BBB/BBTB and brain tumor cells with surface maltobionic acid (MA) and 4-carboxyphenylboronic acid (CBA), respectively, and simultaneously enhance nanoparticle stability with pH-responsive crosslinkages formed by MA and CBA in situ. STICK-NPs exhibit prolonged circulation time (17-fold higher area under curve) than the free agent, allowing increased opportunities to transpass the BBB/BBTB via glucose-transporter-mediated transcytosis by MA. The tumor acidic environment then triggers the transformation of the STICK-NPs into smaller nanoparticles and reveals a secondary CBA targeting moiety for deep tumor penetration and enhanced uptake in tumor cells. STICK-NPs significantly inhibit tumor growth and prolong the survival time with limited toxicity in mice with aggressive and chemoresistant diffuse intrinsic pontine glioma. This formulation tackles multiple physiological barriers on-demand with a simple and smart STICK design. Therefore, these features allow STICK-NPs to unleash the potential of brain tumor therapeutics to improve their treatment efficacy.

Keywords: blood-brain barrier; diffuse intrinsic pontine glioma; pH response; sequential targeting.


Figures

Figure 1.
Figure 1.
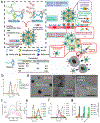
a) Design of transformable STICK-NPs and detailed multi-barrier tackling mechanisms to brain tumors. The pair of targeting moieties selected to form Sequential Targeting In CrosslinKing (STICK) were maltobionic acid (MA), a glucose derivative, and carboxyphenylboronic acid (CBA), one type of boronic acid, and were built into our well-characterized self-assembled micelle formulations (PEG-CA8). STICK-NPs were assembled by a pair of MA4-PEG-CA8 and CBA4-PEG-CA8 with the molar ratio of 9:1 while inter-micelle boronate crosslinkages, STICK, formed between MA and CBA resulting in larger nanoparticle size. Excess MA moieties were on the surface of the nanoparticles, while CBA moieties were firstly shielded inside the STICK to avoid non-specific bindings. Hydrophobic drugs were loaded in the hydrophobic cores of secondary small micelles, while hydrophilic agents were trapped in the hydrophilic space between small micelles. In the following studies we included several control micelle formulations including NM (no targeting), MA-NPs (single BBB targeting), and CBA-NPs (single sialic acid tumor targeting) nanoparticles (inserted table). In detail, STICK-NPs could overcome Barrier 1 (destabilizing condition in the blood) by intermicellar crosslinking strategy, Barrier 2 (BBB/BBTB) by active GLUT1 mediated transcytosis through brain endothelial cells, and Barrier 3 (penetration & tumor cell uptake) by transformation into secondary smaller micelles and reveal of secondary active targeting moiety (CBA) against sialic acid overexpressed on tumor cells in response of acidic extracellular pH in solid tumors. b) Intensity-weighted distribution of MA-NPs, CBA-NPs, NM, and STICK-NPs at pH 7.4 and 6.5. c) Boronate ester bond formation verified by a fluorescence assay based on the indicator of alizarin red S (ARS) (Ex: 468 nm, 0.1 mg/mL). ARS fluorescence decreased along with a dose-dependent increase of MA4-PEG-CA8 concentrations from 0 μM to 40 μM (fixed CBA4-PEG-CA8 with 2.5 μM). This demonstrated the formation of boronate ester bonds between MA4-PEG-CA8 and CBA4-PEG-CA8. d) Transmission electron micrograph (TEM) imaging for visualizing the transformation process of STICK-NPs (92 ± 21nm) into secondary small micelles (14 ± 3nm) when changing from pH 7.4 to pH 6.5 at 10 mins (intermediate status) and 24 hours. Of note, the low-contrast nanoparticle outline in the intermediate status represented the empty large nanoparticle with associated secondary small micelles outside. Scale bar, 200 nm or 100 nm (insert). pH-dependent (e) and time-dependent (f) intensity-weighted distribution changes of STICK-NPs under pH 6.5. pH 6.8 appears to be the cut-off value for triggering micelle transformation. g) The Z-average size of STICK-NPs that was formulated with different solvents (various polarities) and treated with sodium dodecyl sulfate (SDS) or not in PBS. ACN: acetonitrile; DCM: dichloromethane; EtOAc: ethyl acetate.
Figure 2.
Figure 2.
Cumulative release profile for both hydrophilic (Gd-DTPA) (a) and hydrophobic (Cy7.5) payloads (b) from STICK-NPs and NM in the presence of different pH. A mixture of NM and free Gd was used in (a), as Gd could not be loaded into NM. Drug release study was performed initially at pH 7.4 PBS (grey areas) and was then subjected to pH 6.5 after 4 h (pink areas). Samples were collected at different time points and were measured by inductively coupled plasma mass spectrometry (ICP-MS) for Gd-DTPA level and fluorescence spectrometer for the concentration of Cy7.5. (n = 3). c) In vitro T1-weighted MRI signal of Gd-DTPA, and STICK-NP@Cy@Gd under pH7.4 or pH6.5 at different concentrations acquired by a Bruker Biospec 7T MRI scanner. d) The Z-average size stability test of STICK-NP@Cy@Gd in the presence of PBS, 10 mg/mL SDS or 10% FBS. (n = 3) e) The intensity-weighted distribution changes of STICK-NPs in the presence of different concentrations of glucose (mmol/L). Of note, normal human serum glucose level ranges from 3.9 to 5.5 mmol/L. f) Pharmacokinetic profiles of free Cy7.5, STICK-NP@Cy, and NM@Cy (Cy7.5, 10 mg/kg) in jugular vein catheterized rats (n = 3). Serum was collected at different time points, and drug concentrations were measured based on fluorescence signals. The error bars were the standard deviation (SD).
Figure 3.
Figure 3.
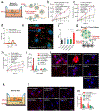
Multi-barrier tackling mechanism studies for STICK-NPs mediated brain tumor drug delivery process in vitro. a) Diagram for Transwell® (0.4 μm pore size) modeling for Barrier 2 (BBB/BBTB), and the STICK-NP@Cy mediated transcytosis through brain endothelial cells. Mouse brain endothelial cells (bEnd.3) were cultured in the upper chamber. b) Quantitative measurements for the intracellular fluorescence intensity of Cy7.5 in bEnd.3 cells. bEnd.3 cells were incubated with free Cy7.5, STICK-NP@Cy, MA-NP@Cy, CBA-NP@Cy and NM@Cy (Cy7.5: 0.1 mg/mL) and lysed at different time points. To inhibit GLUT1 activity, cells were pre-treated with 40 μM WZB-117 for 1 hour before cellular uptake study in the following (b-c). (n = 3, **p<0.01, two-way ANOVA). c) The efficiency of the transcytosis of different formulations with Cy7.5 in the Transwell system as (a). Mouse bEnd.3 cells were seeded in the upper chamber to form a tight junction that was confirmed with > 200 Ω.cm2 trans-endothelial electrical resistance (TEER). Free Cy7.5, MA-NP@Cy, CBA-NP@Cy, NM@Cy, and STICK-NP@Cy were loaded in the upper chamber and medium in the lower chambers were collected at different time points to measure the fluorescence intensity of Cy7.5. d) The intensity-weighted distribution of the STICK-NP@Cy presented in the upper chamber, and lower chamber with medium adjusted to pH 7.4 and 6.5, respectively. The size was measured by DLS. n = 3. e) Representative confocal image of the subcellular distribution of STICK-NP@DiD (red) in the bEnd.3 cells after 1 hour of incubation. Lysotracker (green): lysosome; Hochst 33342 (blue) : nuclear staining; Scale bar = 20 μm. f) VCR concentrations in normal brain tissue in Balb/c mice with intact BBB at 6 hours post-intravenous injection of STICK-NPs@VCR and other formulations (2 mg/kg). The whole brains were homogenized. VCR was extracted and the concentrations were measured by liquid chromatography-mass spectrometry (LC-MS). g) The diagram depicting barrier 3 - tumor uptake and pH-dependent transformation with newly revealed CBA for sialic acid-mediated tumor targeting. h) Quantitative fluorescence measurement of total intracellular Cy7.5 with the same treatment at different time points. The Cy7.5 fluorescence intensity was measured through the lysed cells. n = 3, **p<0.01, two-way ANOVA. Scale bar = 20 μm. Representative quantitive analysis (i) and fluorescence images (j) of U87-MG cellular uptake of free Cy7.5, MA-NP@Cy, CBA-NP@Cy, NM@Cy and STICK-NP@Cy (Cy7.5: 0.1 mg/mL) under different pH (7.4 and 6.5) at 1 hour time point. In one parallel group treated STICK-NPs, the sialic acid expression on the tumor cell surface was augmented with 40 μM azidothymidine (AZT). In another parallel group of treated STICK-NPs, 40 μM free CBA were added to compete with the surface CBA (secondary targeting moiety) on the secondary STICK-NPs. n = 3, **p<0.01, two-way ANOVA. k) The diagram of Transwell (0.4 μm pore size) co-culture system with the bEND3 cells in the upper chamber and U87-MG cells in the lower chamber to model Barriers 2+3. Representative fluorescence images (l) and quantitive analysis (m) of U87-MG cells at 1 hour after treatment with free Cy7.5, MA-NP@Cy, CBA-NP@Cy, NM@Cy and STICK-NP@Cy (Cy7.5: 0.1 mg/mL) in the upper chamber. After adding in the upper chamber for one hour, the lower chamber medium was adjusted to pH 7.4 or 6.5 for another hour and the U87-MG cells at lower chamber were incubated for another hour. In a parallel group treated STICK-NPs, GLUT1 activity was pre-inhibited by WZB-117. Scale bar = 20 μm. The error bars were the standard deviation (SD).
Figure 4.
Figure 4.
Transforming-dependent tumor penetration study for STICK-NPs. a) Quantitative analysis of the penetration in U87-MG-GFP neurosphere with STICK-NP@DiD (pH 7.4 and 6.5) and other formulations (pH 7.4). The Z-average size of STICK-NP@DiD (pH 7.4) was 138.6 ± 11.8 nm, while STICK-NP@DiD (pH6.5) and other nanoformulations were around 25 nm (Figures S4,5, Supporting information). n = 3. t-test, **P < 0.01. b) The representative images and quantitative analysis of the penetration of STICK-NP@DiD (red) into DIPG tumor spheroid at 24 hours under pH 7.4 and 6.5. (DiD: 0.05 mg/mL). n = 3. t-test, **P < 0.01. Scale bar, 100 μm. c) Tissue penetration of STICK-NP@DiD at the normal brain area and implanted DIPG area from the orthotopic mouse model at 16 hours post-injection of STICK-NP@DiD and NM@DiD (Red, 5mg/kg). DIPG-XIII-P cells were injected into the mouse brainstem to establish the orthotopic model. DIPG bearing mice were injected with STICK-NP@DiD and NM@DiD (Red, 5mg/kg) for 16 hours. Before sacrificing the mice, Dextran-FITC (green, moleclular weight = 70 K) were injected to highlight blood vessels. Penetration distance from the blood vessels was analyzed with Image J (right). DAPI (blue): nuclear staining. Scale bar = 100 μm. d) Tissue penetration analysis of STICK@DiD and NM@DiD (Red) beyond the blood vessels (FITC, green) at both normal brain and DIPG tumor sites corresponding to the cross-sections (yellow line) in (c).
Figure 5.
Figure 5.
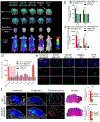
Dual-modality imaging (MRI & NIRF imaging)-guided delivery process of STICK-NPs in orthotopic PDX GBM and PDX DIPG brain tumor models a) In vivo T1-weighted MRI and NIRF images ( in vivo and ex vivo) on PDX GBM bearing mouse model as indicated time points after iv injections of Cy7.5+Gd, MA-NP@Cy+Gd, CBA-NP@Cy+Gd, NM@Cy+Gd or STICK-NP@Cy@Gd (Gd-DTPA: 25 mg/kg; Cy7.5: 10 mg/kg). Since hydrophilic Gd-DTPA could not be loaded in MA-NP, CBA-NP, NM, free Gd-DTPA was given in conjunction with Cy7.5 loaded nanoparticles as controls. Tumor location was double-verified with T2-weighted MR imaging. b) Quantitative analysis of MRI T1 signal intensity normalized to normal brain tissue. t-test, **p<0.01. c) The NIRF intensity analysis of orthotopic brain tumors based on the whole mouse in vivo imaging at 24 and 48 hours post-injection. n = 3, t-test, **p<0.01, *p<0.05. d) Biodistribution analysis based on the Cy7.5 fluorescence intensity (ex vivo NIRF imaging) in PDX GBM bearing mice at 24 hours pos-injections of Cy7.5+Gd, MA-NP@Cy+Gd, CBA-NP@Cy+Gd, NM@Cy+Gd, and STICK-NP@Cy@Gd. n = 3, t-test, **p<0.01. e) Representative confocal images from the cryosection of the mouse brain with implanted GBM tumors at 24 hours post-injection of Cy7.5+Gd, MA-NP@Cy+Gd, CBA-NP@Cy+Gd, NM@Cy+Gd, and STICK-NP@Cy@Gd. Blue: DAPI; Green: U87-MG-GFP; Red: Cy7.5. Scale bar = 500 μm. The error bars were the standard deviation (SD). f) T1-weighted MRI and confocal fluorescence imaging, with quantitative analysis, on orthotopic PDX DIPG brain tumor model at 24 hours post-administration of NM@Cy+Gd or STICK-NP@DiD@Gd (Gd-DTPA: 25 mg/kg; DiD: 5 mg/kg as indicated. Before sacrificing the mice, animals were injected with Dextran-FITC(green) to highlight blood vessels. Red: DiD; Scale bar = 2 mm.
Figure 6.
Figure 6.
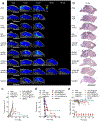
Anti-cancer efficacy studies of STICK-NPs@VCR in the orthotopic PDX DIPG mouse model a) Tumor progression (blue dotted outline) of orthotopic DIPG mouse model monitored with Gd-enhanced T1-weighted MRI of the same representative mouse from each group on day 0, 6, 12, 18 and 24 day after treatment with PBS, free VCR, NM@VCR, MA-NP@VCR, CBA-NP@VCR, STICK-NP@VCR, Marqibo® (VCR 1.5 mg/kg) free VCR2 and STICK-NM@VCR2 (VCR 2 mg/kg) every six days (intravenous injection). Scale bar =10 mm. b) Actual tumor burden was confirmed with histopathology (blue dotted outline) on day 12 post-injection from the same representative mouse with MRI results in (a). Scale bar = 5 mm. c) Quantitative analysis of the tumor growth curve based on MRI, Kaplan–Meier survival curve (d), and body weight changes (e) of the DIPG bearing mice after treatment of STICK-NP, Marqibo®, and other formulations. n = 6. t-test for tumor burden analysis; Log-rank (Mantel-Cox) test for survival time analysis. **p<0.01, *p < 0.05. Of note, all the mice in the treatment groups of PBS, free VCR, NM@VCR, MA-NP@VCR and CBA-NP@VCR died after day 12, while there were survivors in the STICK-NP@VCR groups. Therefore, the tumor growth curve and body weight changes were only plotted based on survived mice in STICK-NP@VCR groups beyond day 12.

References

    1. Mohammad F, Weissmann S, Leblanc B, Pandey DP, Hojfeldt JW, Comet I, Zheng CQ, Johansen JV, Rapin N, Porse BT, Tvardovskiy A, Jensen ON, Olaciregui NG, Lavarino C, Sunol M, de Torres C, Mora J, Carcaboso AM, Helin K, Nat. Med 2017, 23, 483. - PubMed
    1. Buczkowicz P, Hoeman C, Rakopoulos P, Pajovic S, Letourneau L, Dzamba M, Morrison A, Lewis P, Bouffet E, Bartels U, Zuccaro J, Agnihotri S, Rya S, Barszczyk M, Chornenkyy Y, Bourgey M, Bourque G, Montpetit A, Cordero F, Castelo-Branco P, Mangere J, Tabori U, Ching K, Huang A, Taylor KR, Mackay A, Bendell AE, Nazarian J, Fangusaro JR, Karajannis MA, Zagzag D, Foreman NK, Donson A, Hegert JV, Smith A, Chan J, Lafay-Cousin L, Dunn S, Hukin J, Dunham C, Scheinemann K, Michaud J, Zelcer S, Ramsay D, Cain J, Brennan C, Souweidane MM, Jones C, Allis CD, Brudno M, Becher O, Hawkins C, Nat. Genet 2014, 46, 451. - PMC - PubMed
    1. Hashizume R, Neurol. Med. Chir 2017, 57, 331; - PMC - PubMed
    2. La Madrid AM, Hashizume R, Kieran MW, Front. Oncol 2015, 5. - PMC - PubMed
    1. Zhu QW, Chen XJ, Xu X, Zhang Y, Zhang C, Mo R, Adv. Funct. Mater 2018, 28.
    1. Wu D, Qin M, Xu D, Wang L, Liu C, Ren J, Zhou G, Chen C, Yang F, Li Y, Adv. Mater 2019, 1807557; - PMC - PubMed
    2. He QG, Liu J, Liang J, Liu XP, Li W, Liu Z, Ding ZY, Tuo D, Cells 2018, 7; - PMC - PubMed
    3. Chen WS, Ouyang J, Yi XY, Xu Y, Niu CC, Zhang WY, Wang LQ, Sheng JP, Deng L, Liu YN, Guo SJ, Adv. Mater 2018, 30. - PubMed

MeSH terms