. 2020 Jun;62(6):793-804.
doi: 10.1165/rcmb.2019-0117OC.

Adoptive T-Cell Transfer to Treat Lymphangioleiomyomatosis

Affiliations

Adoptive T-Cell Transfer to Treat Lymphangioleiomyomatosis

Fei Han et al. Am J Respir Cell Mol Biol. 2020 Jun.

Abstract

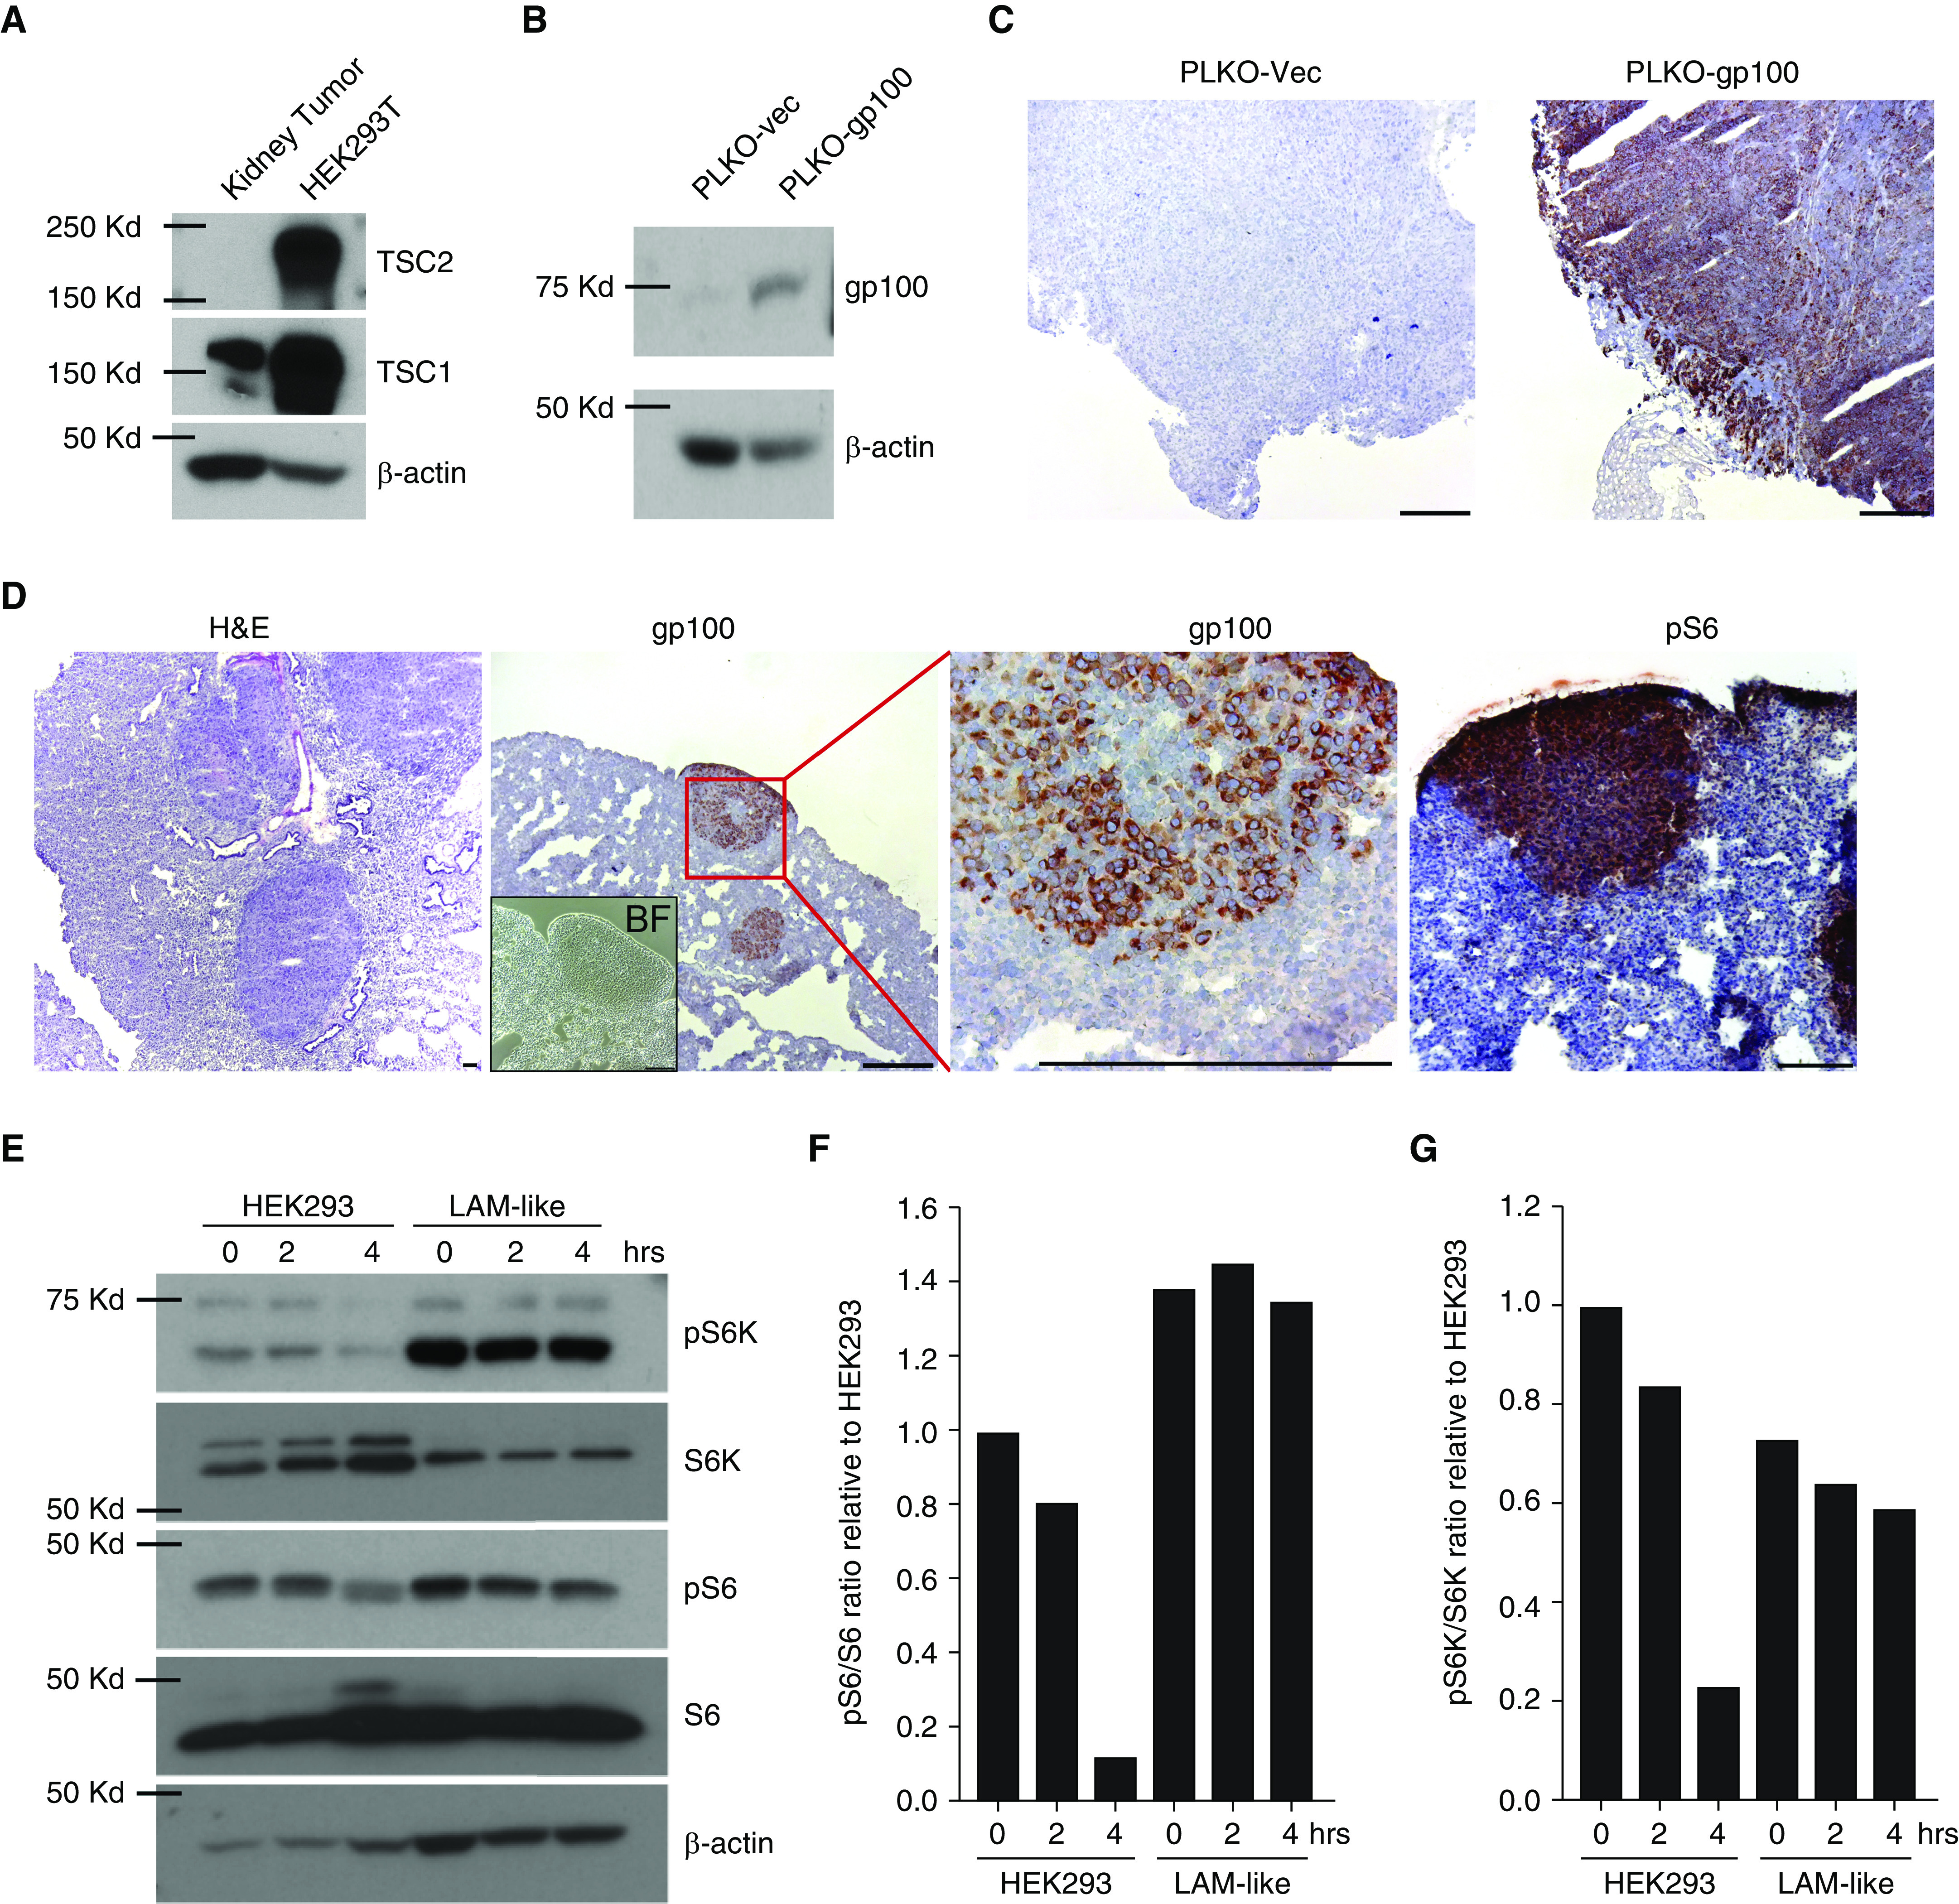
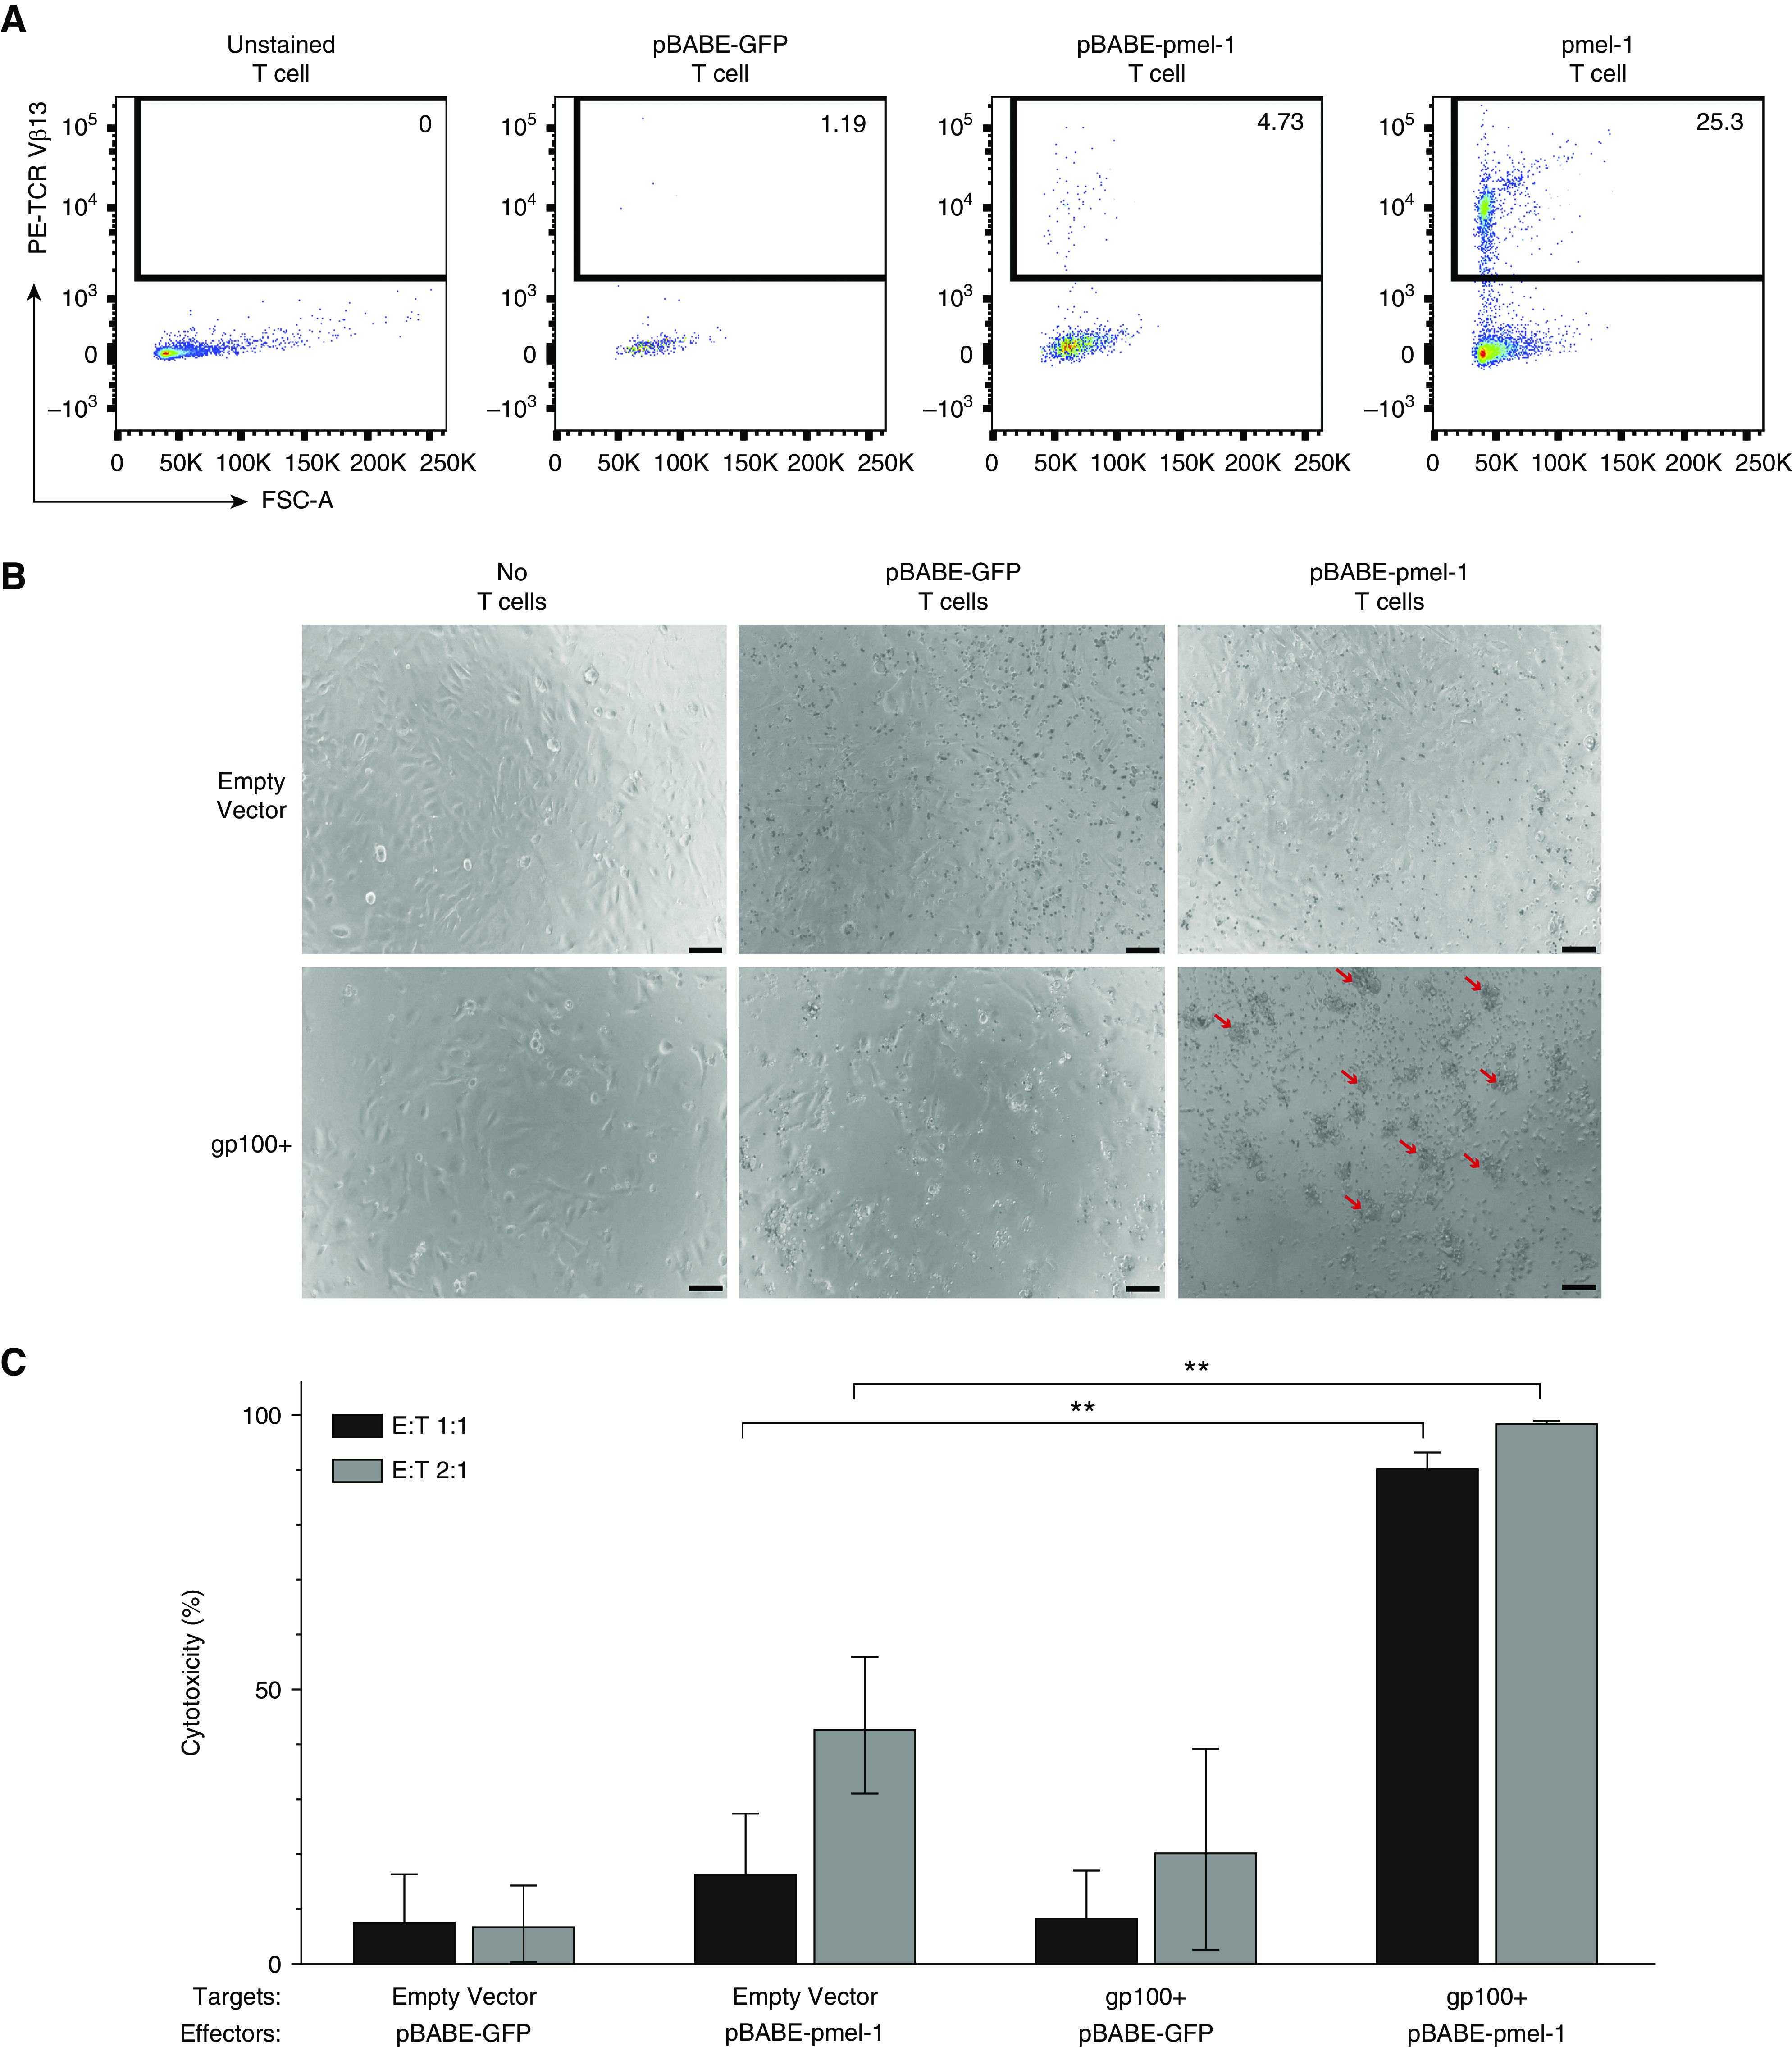
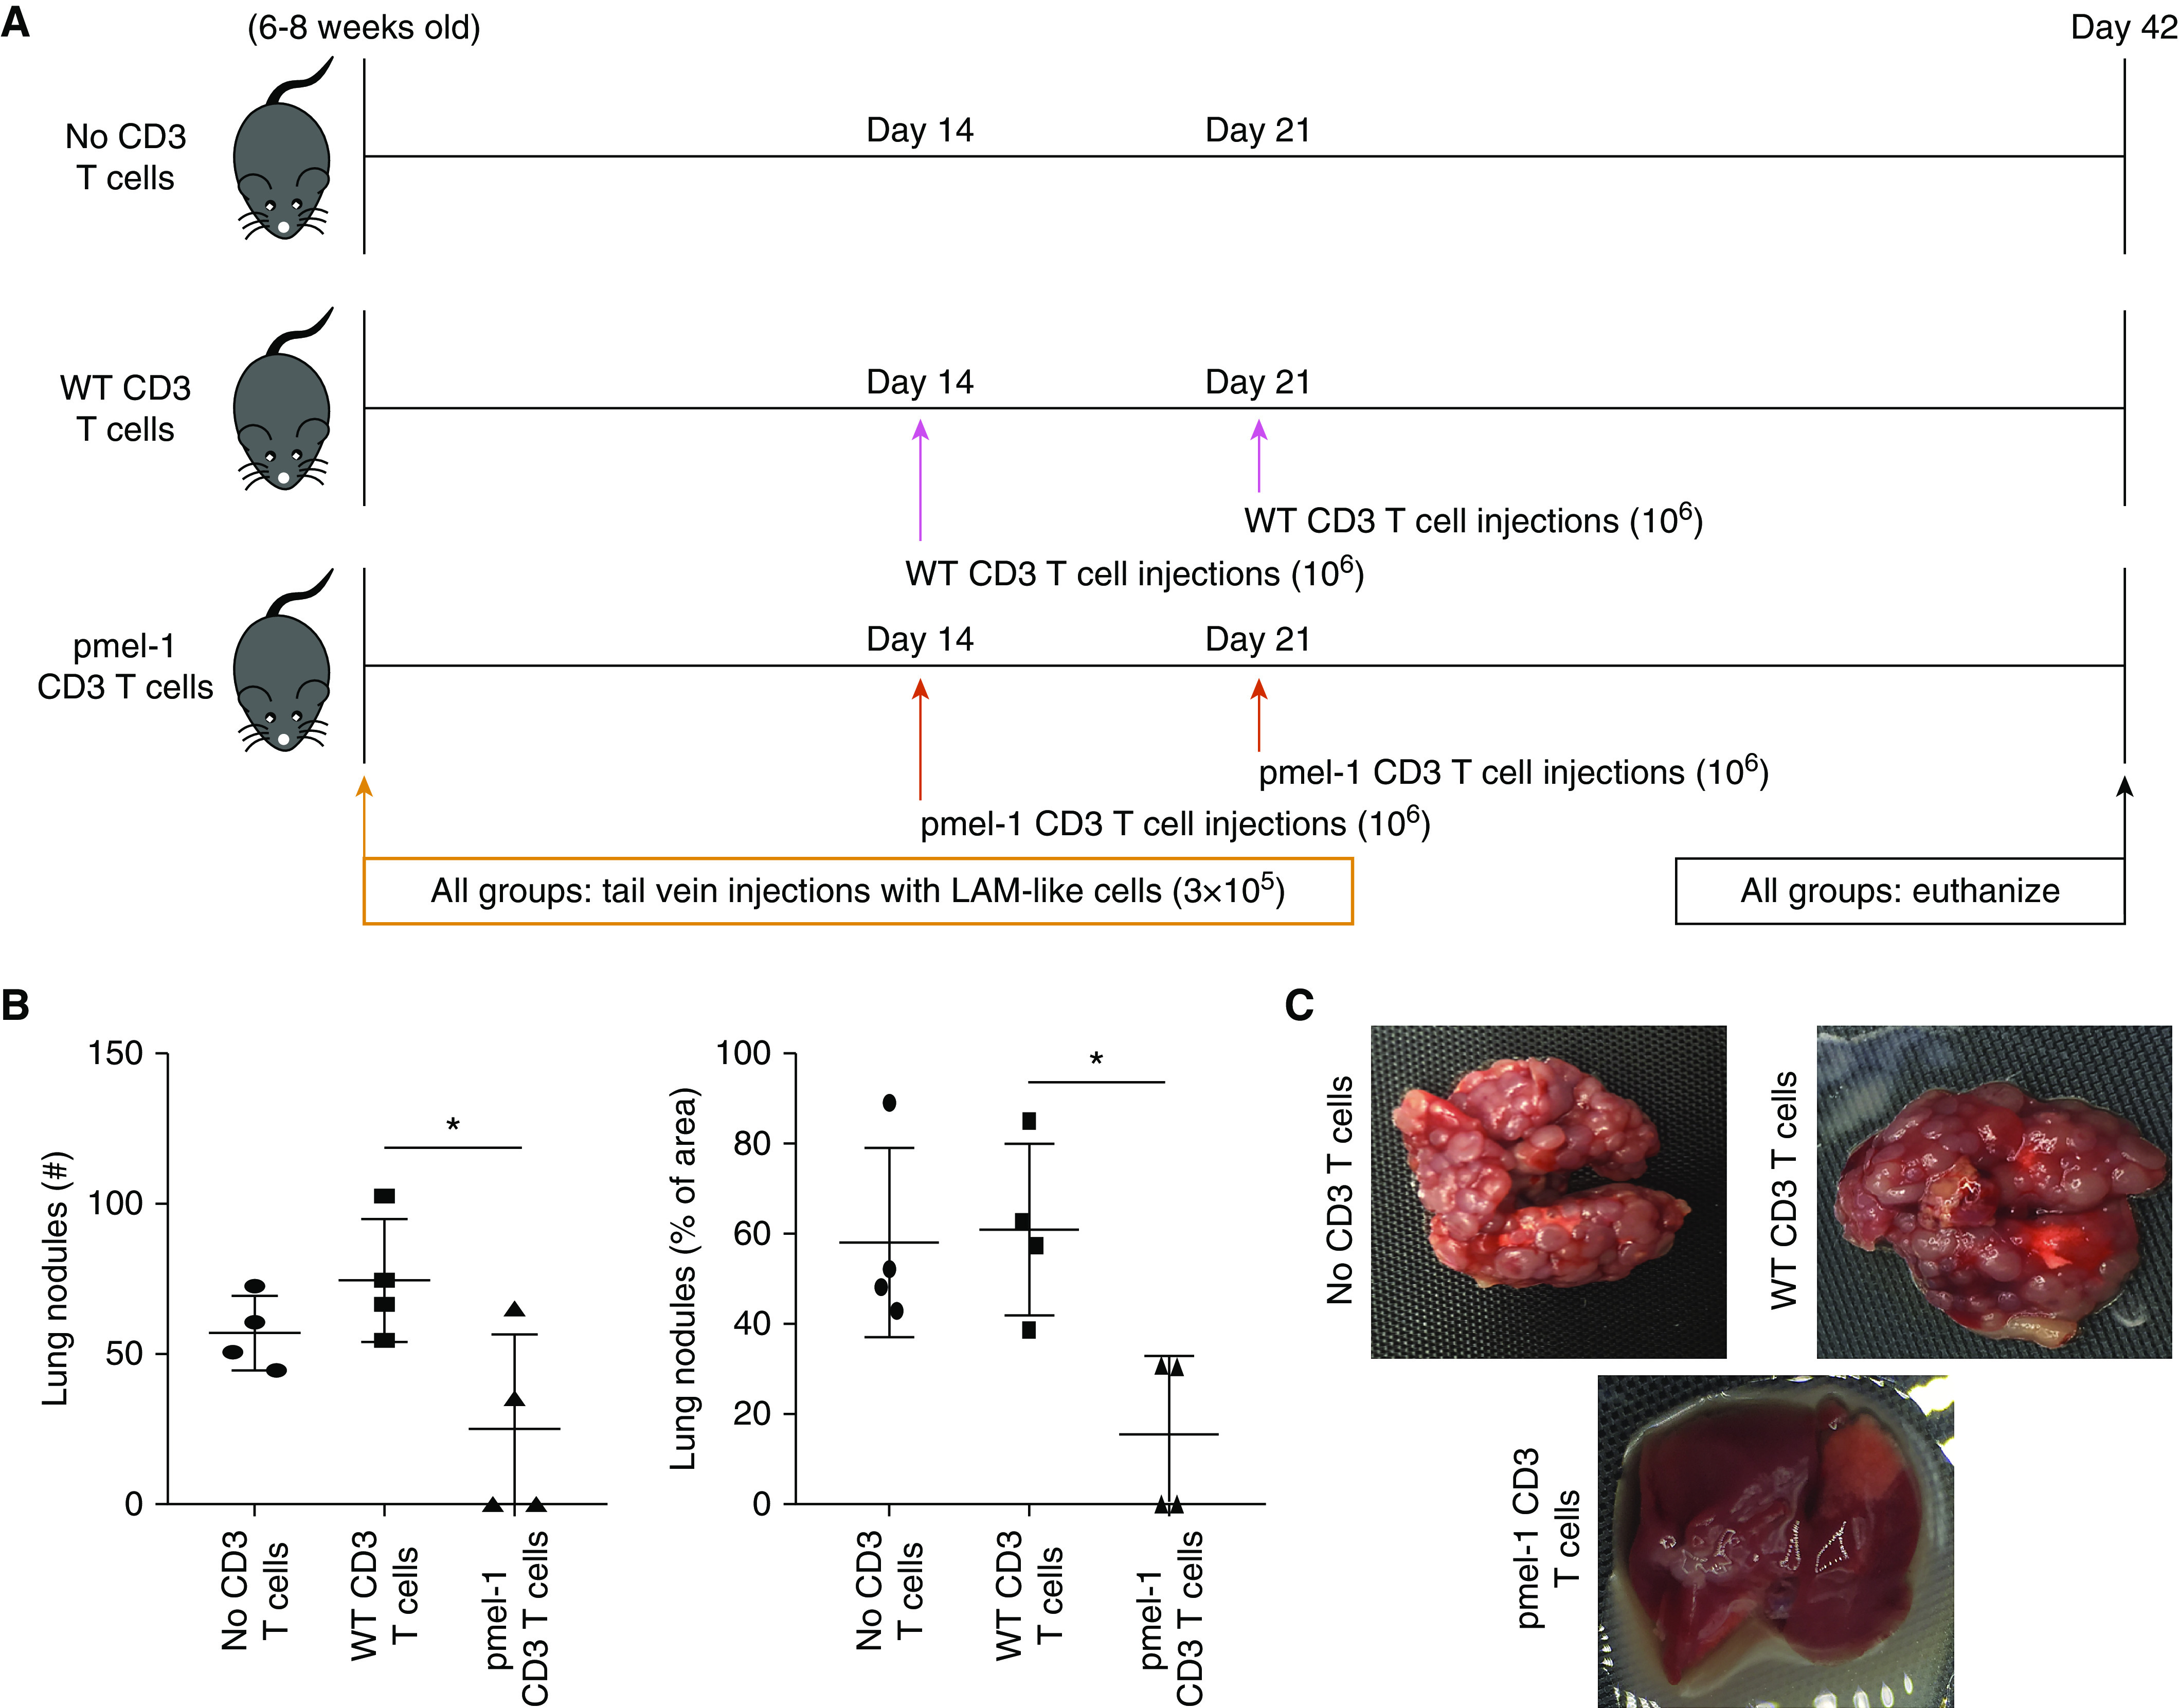
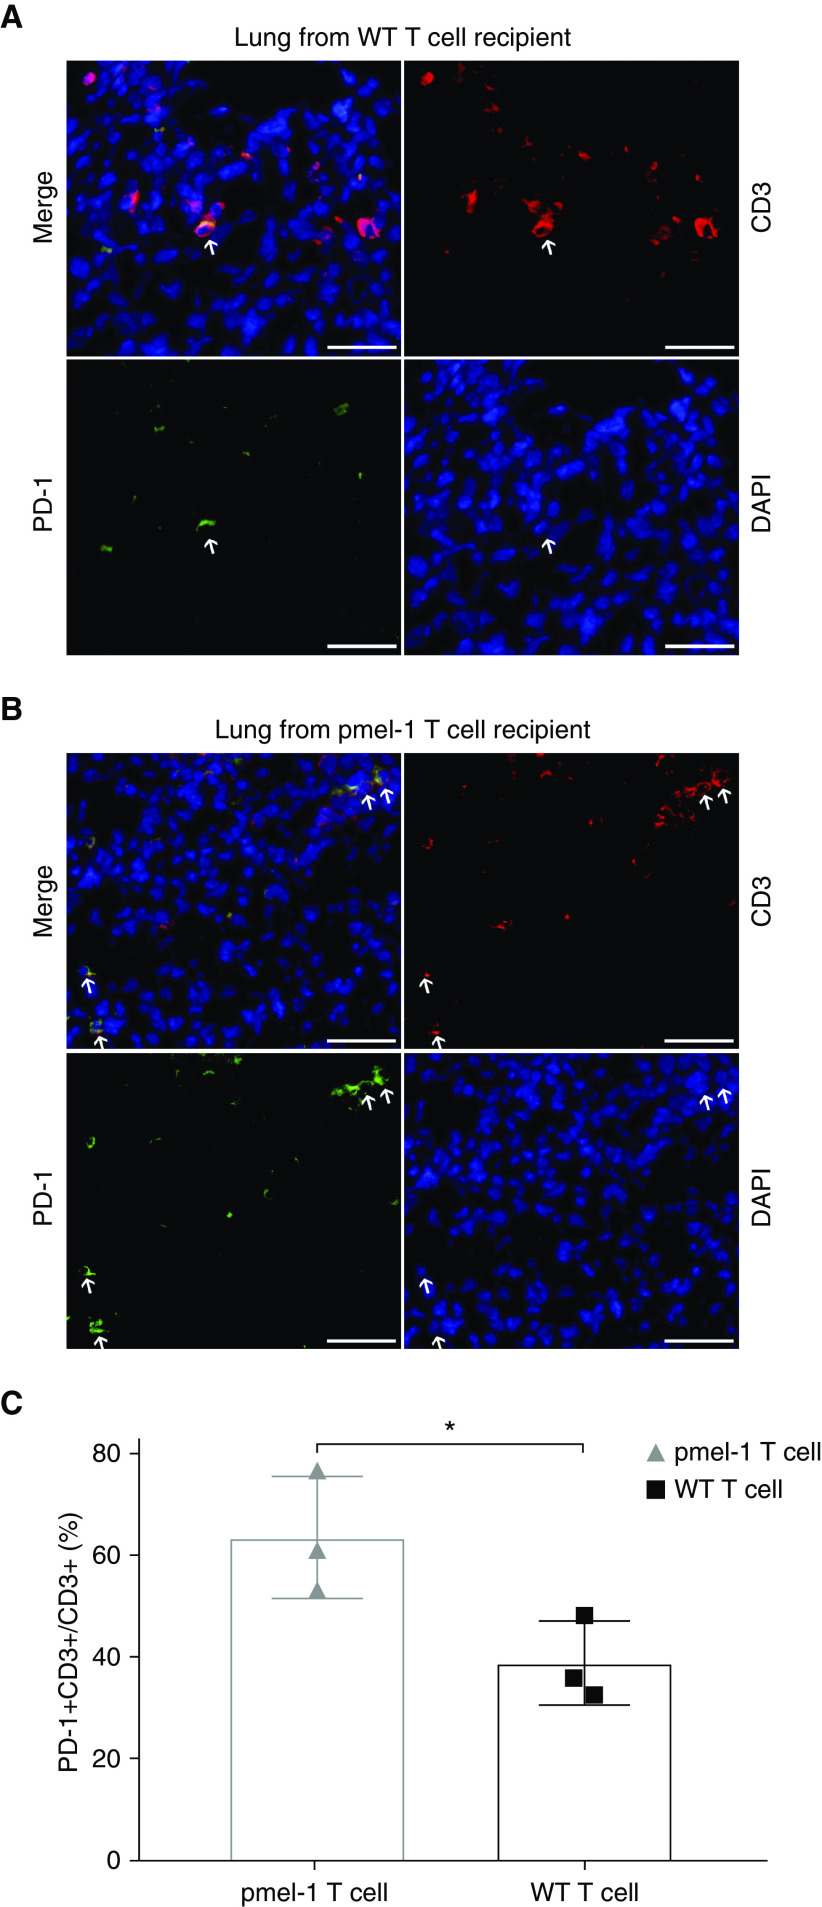
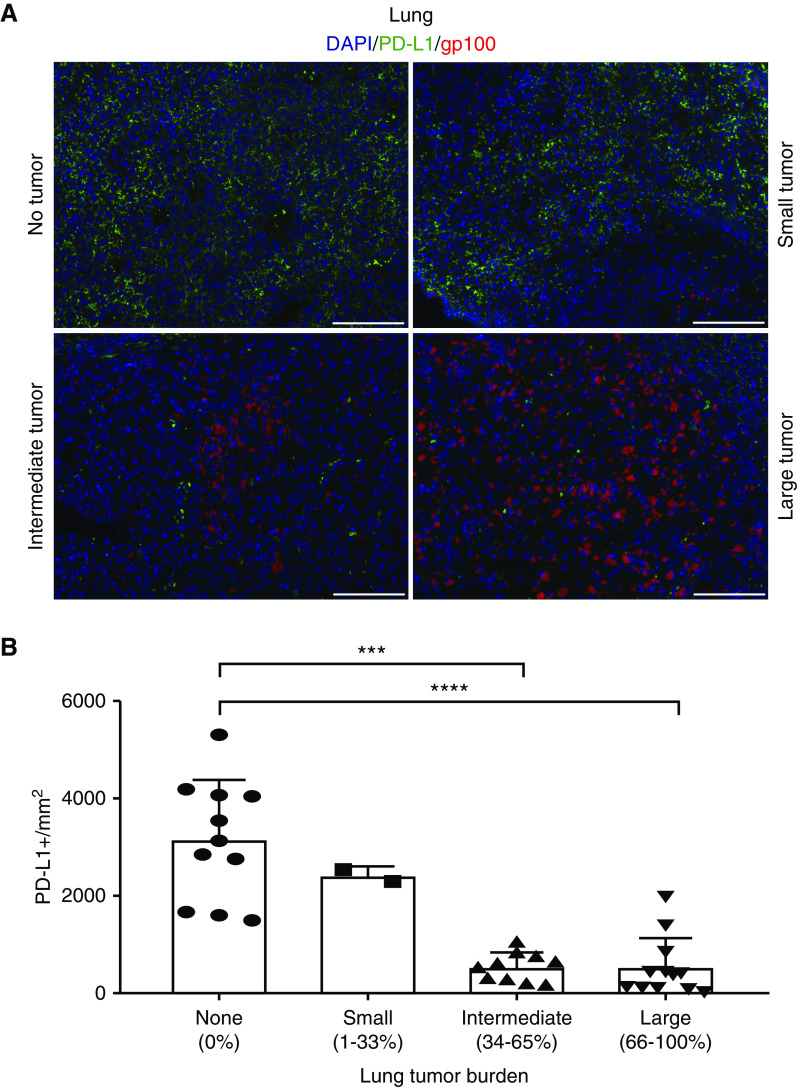
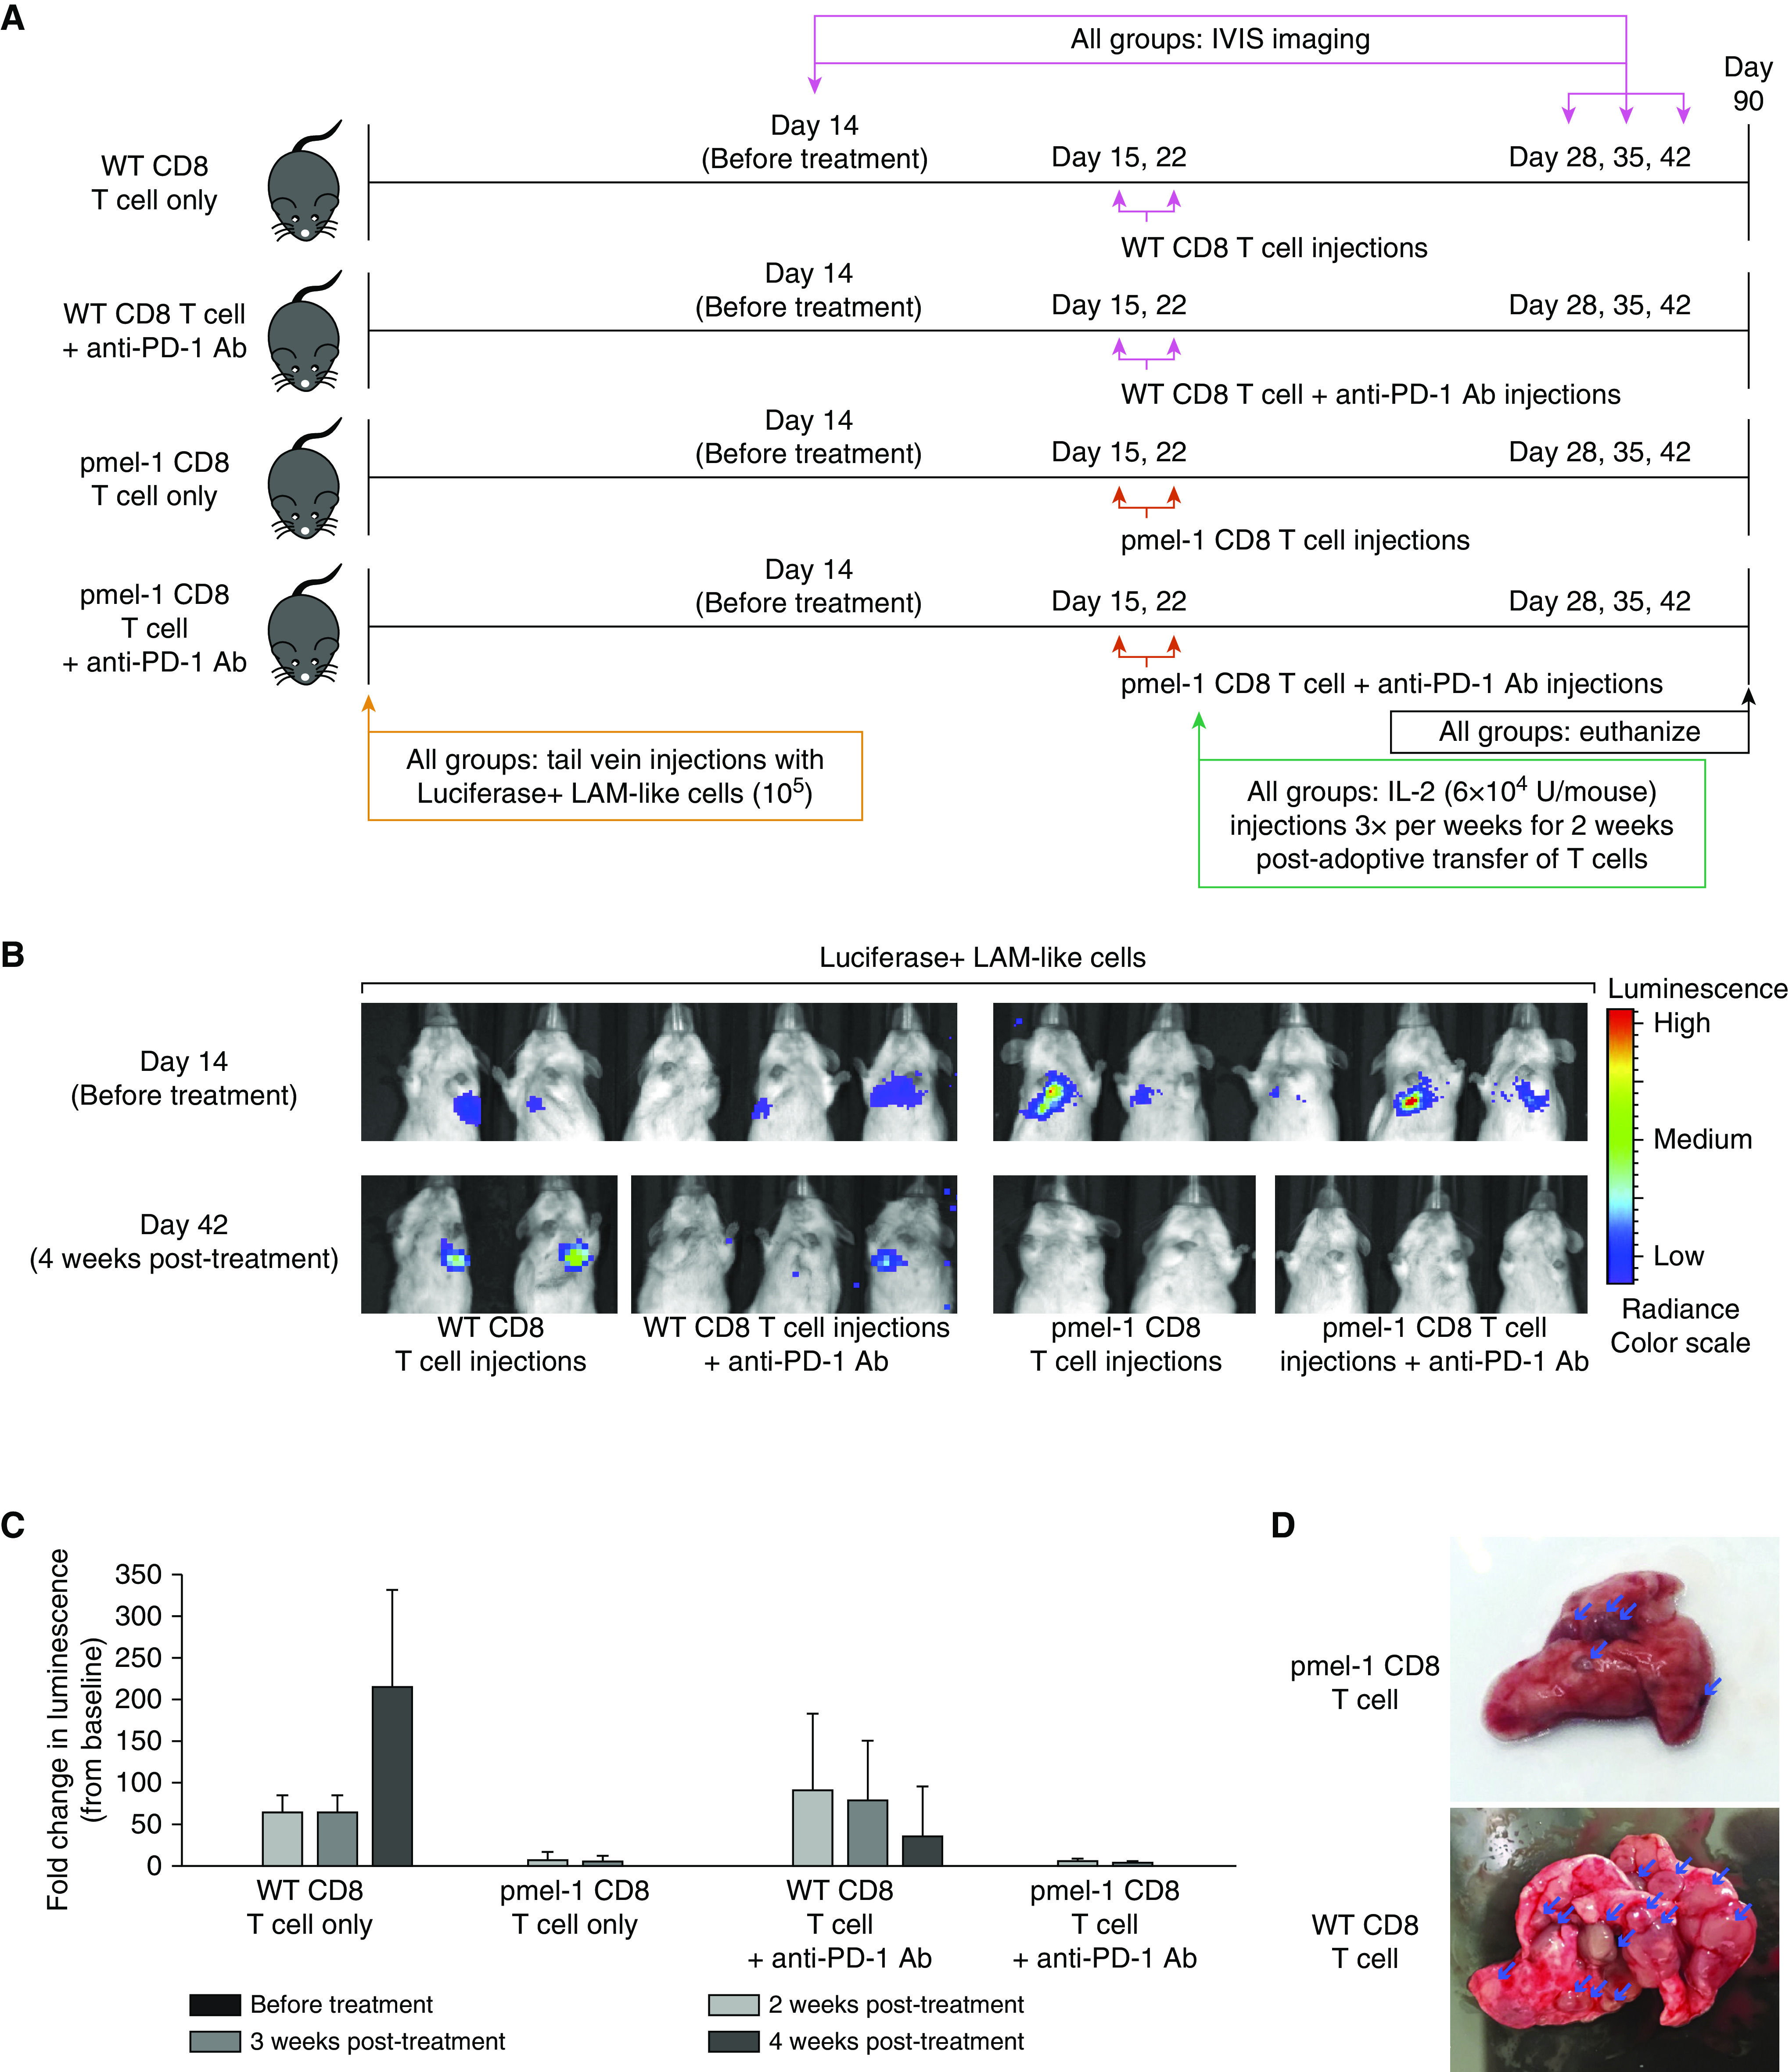
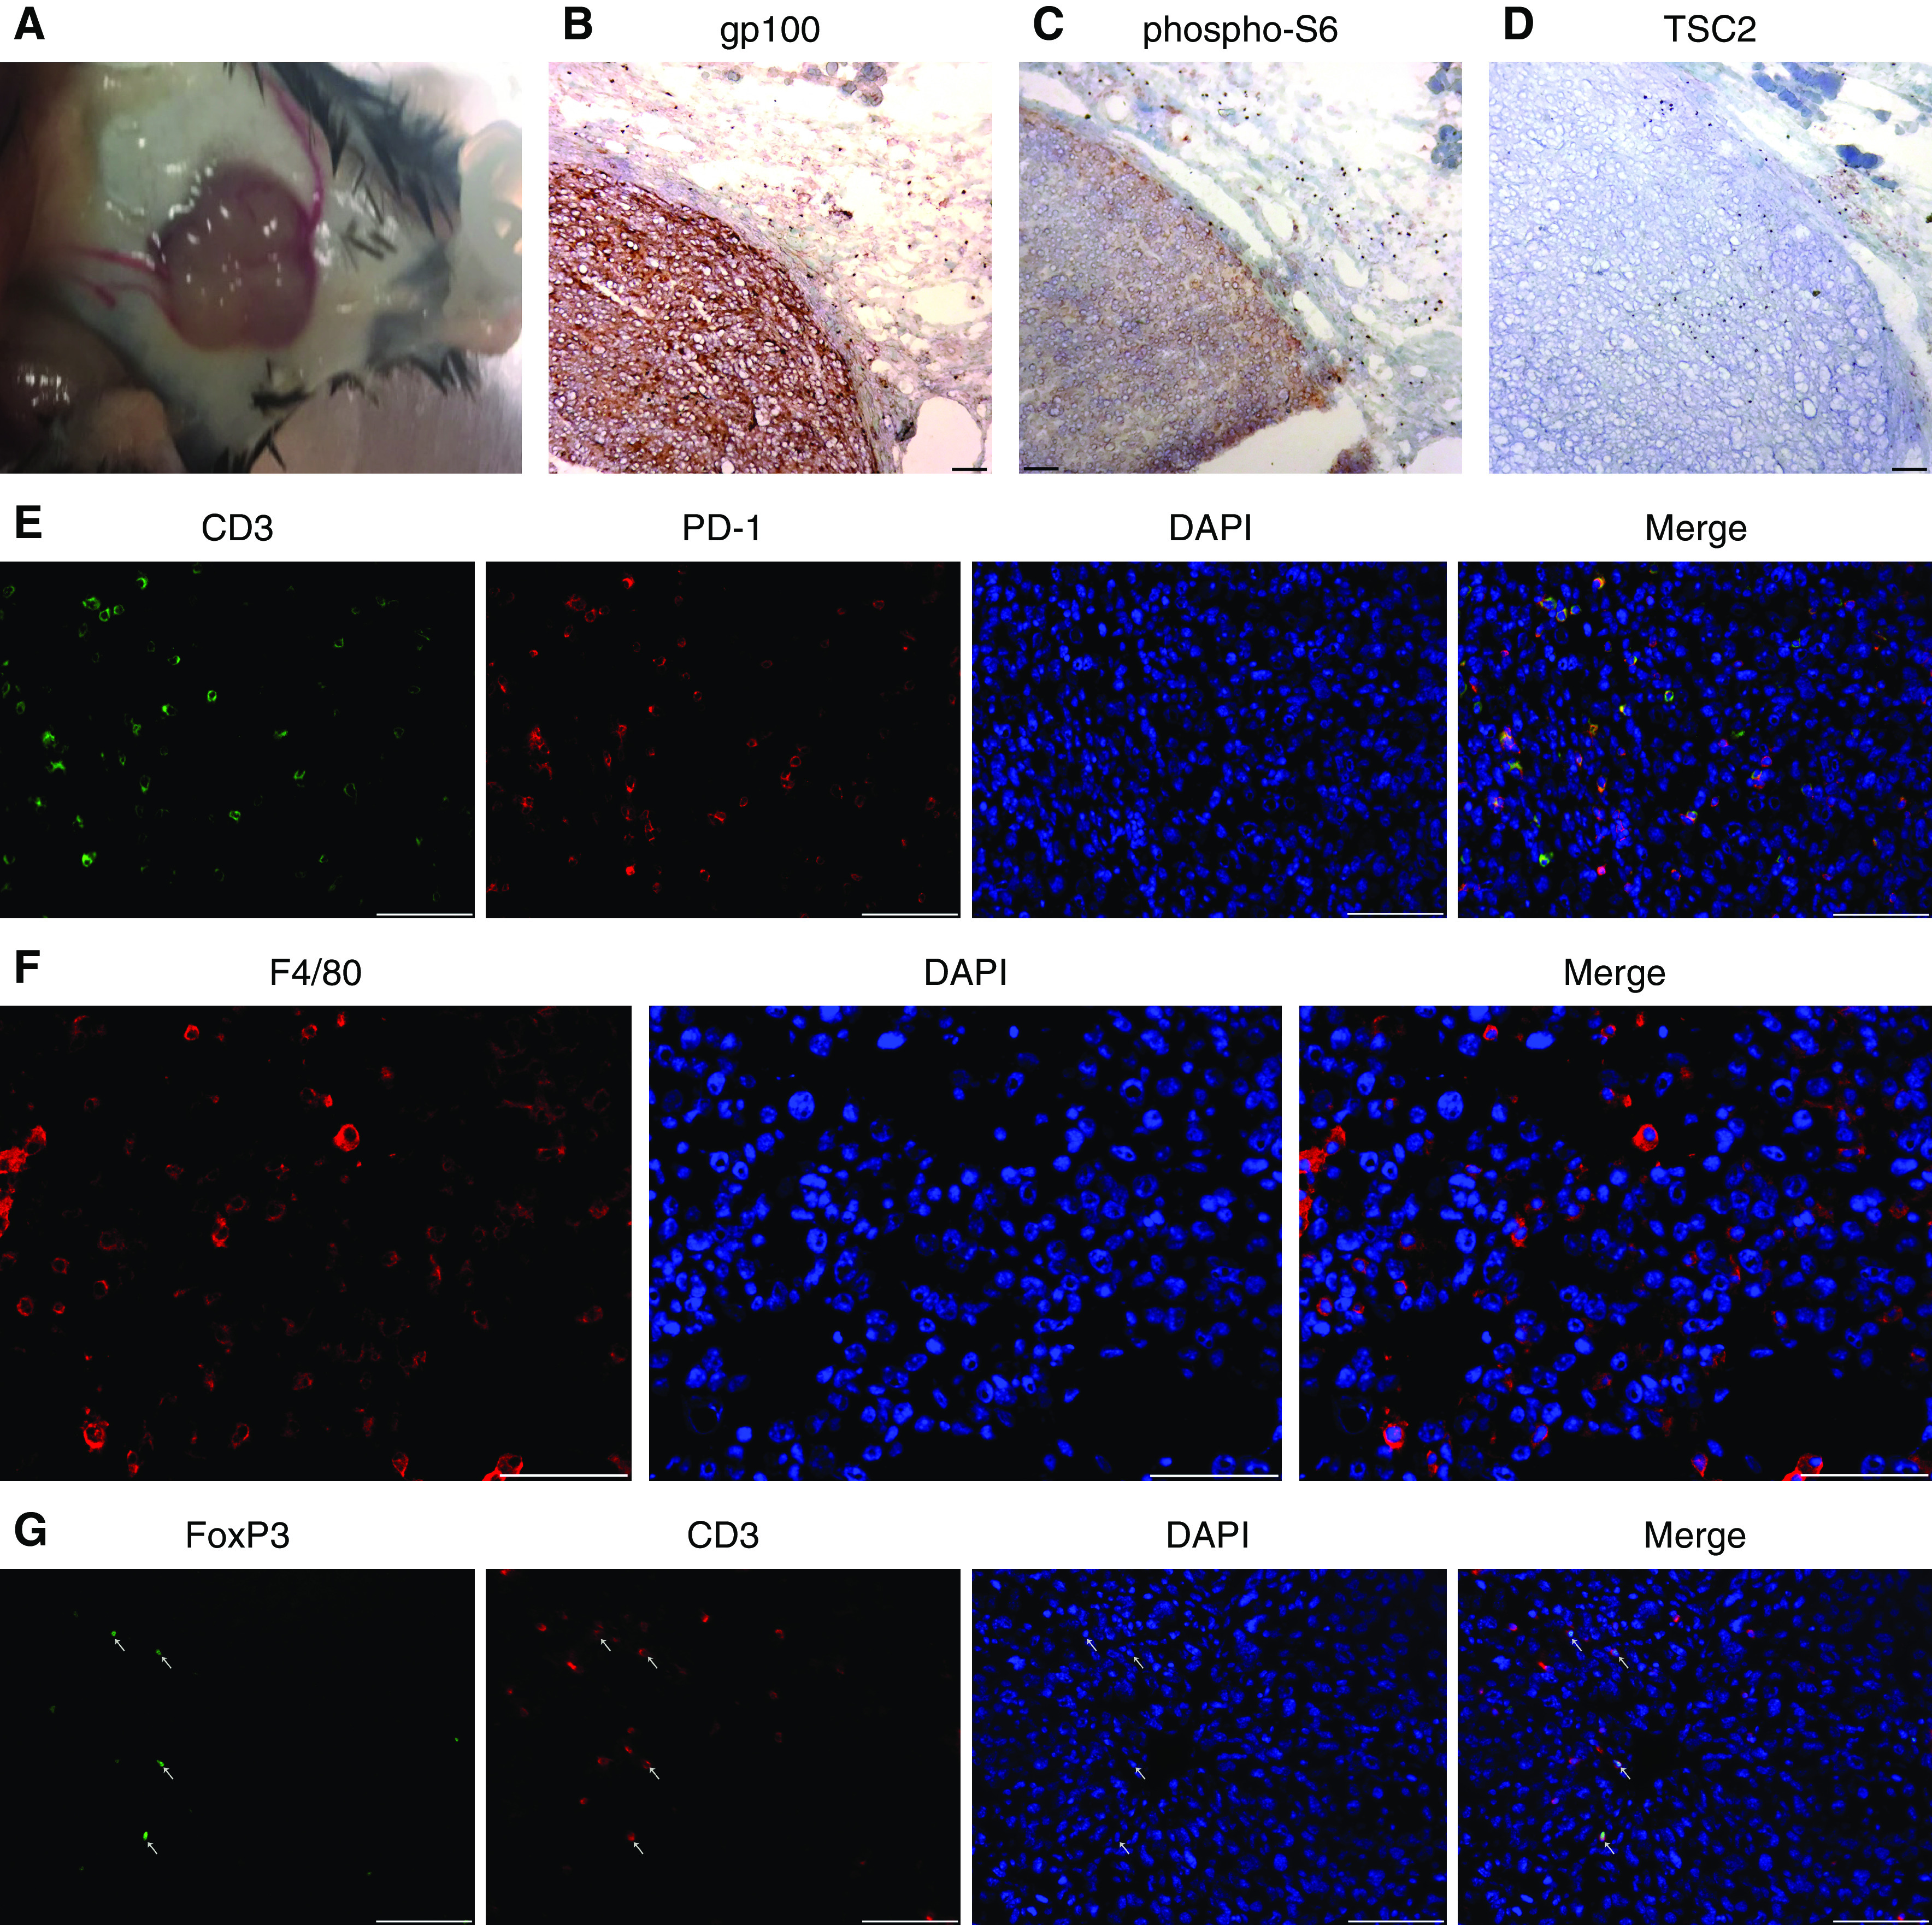
Patients with lymphangioleiomyomatosis (LAM) develop pulmonary cysts associated with neoplastic, smooth muscle-like cells that feature neuroendocrine cell markers. The disease preferentially affects premenopausal women. Existing therapeutics do not cure LAM. As gp100 is a diagnostic marker expressed by LAM lesions, we proposed to target this immunogenic glycoprotein using TCR transgenic T cells. To reproduce the genetic mutations underlying LAM, we cultured Tsc2-/- kidney tumor cells from aged Tsc2 heterozygous mice and generated a stable gp100-expressing cell line by lentiviral transduction. T cells were isolated from major histocompatibility complex-matched TCR transgenic pmel-1 mice to measure cytotoxicity in vitro, and 80% cytotoxicity was observed within 48 hours. Antigen-specific cytotoxicity was likewise observed using pmel-1 TCR-transduced mouse T cells, suggesting that transgenic T cells may likewise be useful to treat LAM in vivo. On intravenous injection, slow-growing gp100+ LAM-like cells formed lung nodules that were readily detectable in severe combined immunodeficient/beige mice. Adoptive transfer of gp100-reactive but not wild-type T cells into mice significantly shrunk established lung tumors, even in the absence of anti-PD-1 therapy. These results demonstrate the treatment potential of adoptively transferred T cells to eliminate pulmonary lesions in LAM.

Keywords: T cell receptor; adoptive T cell transfer; gp100; lymphangioleiomyomatosis.


Figures

Figure 1.
Figure 1.
Generation and validation of lymphangioleiomyomatosis (LAM)-like cells. This figure displays the LAM-like features of target cells used for experiments throughout the article. (A) TSC1 and TSC2 expression is shown as found in kidney tumor cells isolated from 21-month-old Tsc2+/− mice. Human embryonic kidney (HEK) 293T cells served as a positive control. (B) Lack of gp100 expression by (PLKO-vec) control-transfected, and apparent gp100 expression by mouse gp100-transfected, Tsc2 kidney tumor cells. (C) Absence of gp100 expression in subcutaneous tumors from SCID-bg mice injected with Tsc2 kidney tumor cells, versus expression by gp100-transfected cells in vivo. (D) LAM-like cells from gp100+Tsc2 subcutaneous tumors and reinjected into SCID-bg mice via tail vein formed pulmonary tumors in 1 month; sections were stained with hematoxylin and eosin (H&E, left panel) and imaged in bright field (inset), and stained for gp100 (middle panels) or pS6 expression (right panel). (E) To identify constitutive mTOR activation measured as phosphorylation under nutrient deprivation in LAM-like cells, HEK293 and LAM-like cells were treated with normal- and amino acid–deprived FBS for 2 and 4 hours. Lysates were analyzed by Western blot using antibodies against indicated proteins. pS6 and pS6K bands from E were quantified and normalized to S6 and S6K, respectively, using ImageJ software. Relative ratios of quantified band intensity of (F) pS6 to S6 and (G) pS6K to S6K are shown in bar graphs. Scale bar: 100 μm. BF = bright-field; bg = beige; gp100 = glycoprotein 100; pS6 = phospho-S6; pS6K = phospho-S6 kinase; SCID = severe combined immunodeficiency; vec = vector.
Figure 2.
Figure 2.
pmel-1–transduced T cells showed reactivity toward LAM-like cells in vitro. The expression and activity of a gp100-reactive TCR was analyzed in vitro. (A) Flow analysis of TCRVβ13 expression for the pmel-1 TCR in unstained (−control), pBABE-GFP vector-transduced, and pBABE-pmel-1–transduced mouse T cells, and T cells from pmel-1 transgenic mice (+control), showing TCR expression only in the two latter groups. (B) Vector control Tsc2 kidney tumor cells and gp100+ Tsc2 LAM-like cells pulsed with additional gp100 peptide were co-cultured with pBABE-GFP vector and pBABE-pmel-1–transduced T cells at 1:1 ratio. Bright-field images taken 48 hours after co-culture. Red arrows: clusters are visible only in combinations of gp100-reactive T cells and gp100+ target cells, indicative of ongoing cytotoxicity. (C) Cytotoxicity quantified: target cells remaining after 48 hours were quantified relative to target cell monocultures. With some background cytotoxicity observed, pmel-1–transduced T cells showed significant cytotoxicity toward gp100+ targets at 1:1 and 2:1 effector:target (E:T) ratios (represented as mean ± SD). N = 3. **P ≤ 0.01 (two-way ANOVA with Tukey’s multiple comparisons test). Scale bars: 50 μm. FSC-A = forward scatter area.
Figure 3.
Figure 3.
gp100-reactive T cells reduce LAM-like lung tumors in mice. The number and size of tumor nodules developing in the presence or absence of gp100-reactive T cells were measured in vivo. (A) The experimental design for a LAM-like tumor challenge and adoptive transfer of transgenic CD3 T cells is shown. Mice were killed after 42 days. (B) Surface lung nodules were counted and additionally quantified as percentage of lung area (represented as mean ± SD), and (C) representative lung images are shown for each treatment group. N = 4. *P < 0.05 (Kruskall-Wallis test with Dunn’s multiple comparisons test). WT = wild type.
Figure 4.
Figure 4.
PD-1 expression is more frequently found on gp100-reactive T cells. To evaluate differential T-cell engagement as it relates to expression of a gp100-reactive TCR, PD-1 expression by (CD3+) T cells was measured in lung tissues from mice that received T cells from (A) WT or (B) pmel-1 mice, revealing (C) greater PD-1 expression among the latter and suggesting that expression represents T-cell activation rather than exhaustion (represented as mean ± SD). Arrows show examples of double-stained cells. Scale bars: 50 μm. *P < 0.05 (two-tailed, unpaired t test with Welch’s correction). N = 3.
Figure 5.
Figure 5.
Pulmonary PD-L1 expression is inversely related to tumor size. The contribution of tumor or tissue cells to PD-1 engagement on T cells was evaluated by lung immunohistology. PD-L1 and gp100 co-expression was quantified in tissues with differing tumor burden after LAM-like tumor challenge and adoptive transfer of CD3+ T cells. (A) Example staining showing abundant expression of PD-L1 in sites without a tumor, whereas PD-L1 expression is absent from tumor cells. (B) When quantified relative to tumor burden, PD-L1 expression was inversely related (represented as mean ± SD). Thus, PD-1 expression by T cells may not represent PD-L1–induced T-cell exhaustion. Quantifications were calculated in a given field of view where N = 12, 10, 2, and 11 for large, intermediate, small, and no tumor areas, respectively. Scale bars: 100 μm. ***P ≤ 0.001 and ****P ≤ 0.0001 (Kruskell-Wallis test with Dunn’s multiple comparisons test).
Figure 6.
Figure 6.
Transgenic T cells provide potent tumor control independent of immune checkpoint inhibition. A supportive role for checkpoint inhibition by anti–PD-1 to adoptively transferred, LAM-reactive T cells was tested in vivo. (A) The experimental outline is shown, comparing adoptive transfer of WT or pmel-1 transgenic CD8 T cells with or without anti–PD-1 antibody in SCID-bg mice. (B) IVIS imaging of luciferase+ tumors before and after treatment shows complete responses to T-cell transfer independent of checkpoint inhibition. (C) Relative luminescence intensities measured as ROI readings (represented as mean ± SD) suggest some treatment benefit to anti–PD-1 in the absence of gp100-reactive T cells. (D) Representative lungs are shown after treatment with pmel-1 or WT CD8 T cells. Group sizes were N = 2 for mice that received WT CD8 T cells or pmel-1 CD8 T cells and N = 3 for mice that received WT CD8 T cells with anti–PD-1 antibody or pmel-1 CD8 T cells with anti–PD-1 antibody. Arrows show examples of double-stained cells. IVIS = in vivo imaging system; ROI = region of interest.
Figure 7.
Figure 7.
LAM-like tumor growth in immunocompetent mice. We tested the characteristics of LAM-like cells hosted by immunocompetent mice by subcutaneous and i.v. challenge of C57BL/6 mice with LAM-like cells. (A) Subcutaneous tumor growth was observed 2 months after subcutaneous challenge. Representative staining is shown for (B) gp100, (C) pS6, and (D) Tsc2, revealing the LAM-like identity of tumor cells. Immune infiltration was observed by detecting (E) CD3 and PD-1 co-localization, (F) the presence of F4/80+ macrophages, and (G) FoxP3 and CD3 co-localization indicative of regulatory T cells in an LAM-like subcutaneous tumor. Scale bars: 100 μm.

Comment in

References

    1. Johnson SR, Taveira-DaSilva AM, Moss J. Lymphangioleiomyomatosis. Clin Chest Med. 2016;37:389–403. - PubMed
    1. Taveira-DaSilva AM, Moss J. Epidemiology, pathogenesis and diagnosis of lymphangioleiomyomatosis. Expert Opin Orphan Drugs. 2016;4:369–378. - PMC - PubMed
    1. Carsillo T, Astrinidis A, Henske EP. Mutations in the tuberous sclerosis complex gene TSC2 are a cause of sporadic pulmonary lymphangioleiomyomatosis. Proc Natl Acad Sci USA. 2000;97:6085–6090. - PMC - PubMed
    1. Julian LM, Delaney SP, Wang Y, Goldberg AA, Doré C, Yockell-Lelièvre J, et al. Human pluripotent stem cell-derived TSC2-haploinsufficient smooth muscle cells recapitulate features of lymphangioleiomyomatosis. Cancer Res. 2017;77:5491–5502. - PMC - PubMed
    1. Gao N, Zhang T, Ji J, Xu KF, Tian X. The efficacy and adverse events of mTOR inhibitors in lymphangioleiomyomatosis: systematic review and meta-analysis. Orphanet J Rare Dis. 2018;13:134. - PMC - PubMed

Publication types

MeSH terms