. 2020 Apr 14;141(15):1249-1265.
doi: 10.1161/CIRCULATIONAHA.119.043067. Epub 2020 Feb 11.

Pkm2 Regulates Cardiomyocyte Cell Cycle and Promotes Cardiac Regeneration

Affiliations

Pkm2 Regulates Cardiomyocyte Cell Cycle and Promotes Cardiac Regeneration

Ajit Magadum et al. Circulation. .

Abstract

Background: The adult mammalian heart has limited regenerative capacity, mostly attributable to postnatal cardiomyocyte cell cycle arrest. In the last 2 decades, numerous studies have explored cardiomyocyte cell cycle regulatory mechanisms to enhance myocardial regeneration after myocardial infarction. Pkm2 (Pyruvate kinase muscle isoenzyme 2) is an isoenzyme of the glycolytic enzyme pyruvate kinase. The role of Pkm2 in cardiomyocyte proliferation, heart development, and cardiac regeneration is unknown.

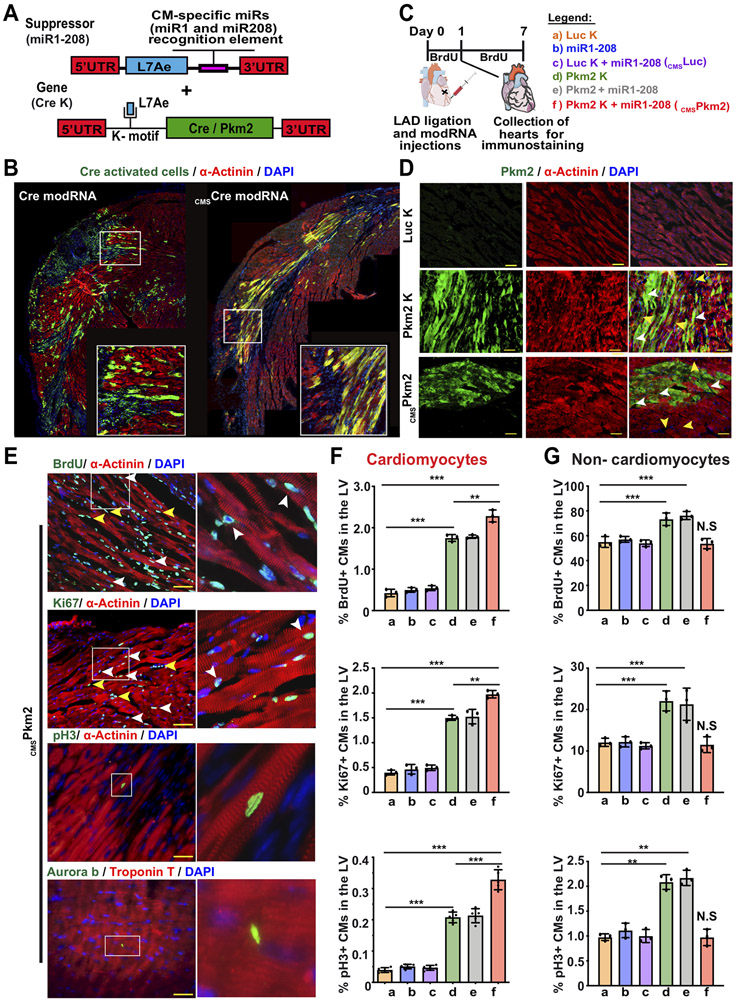
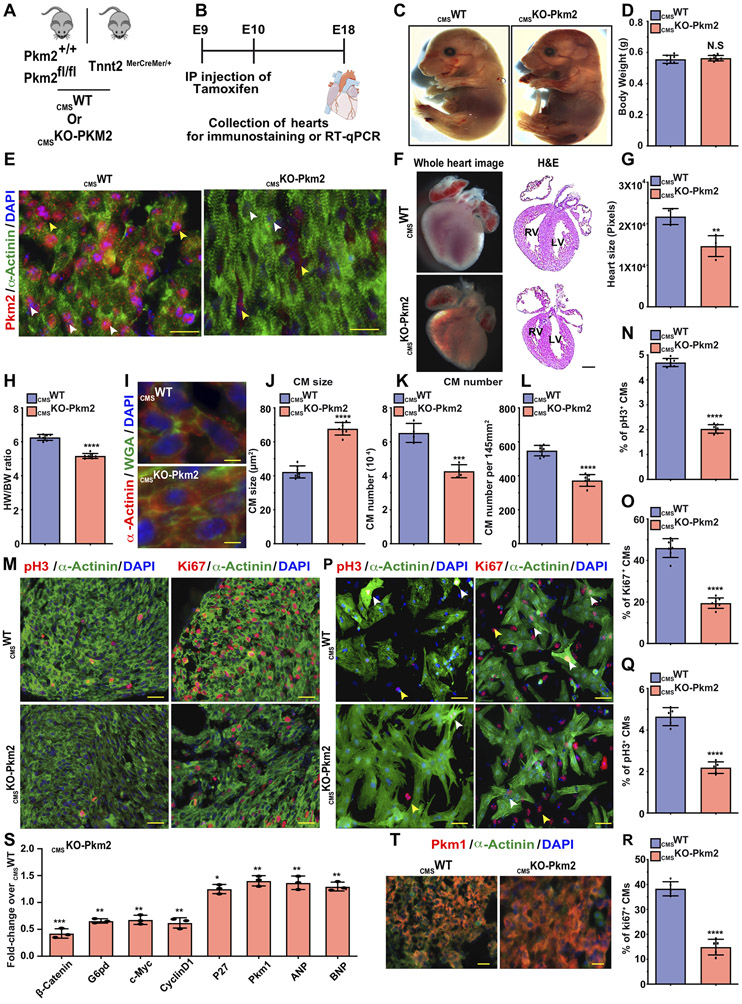
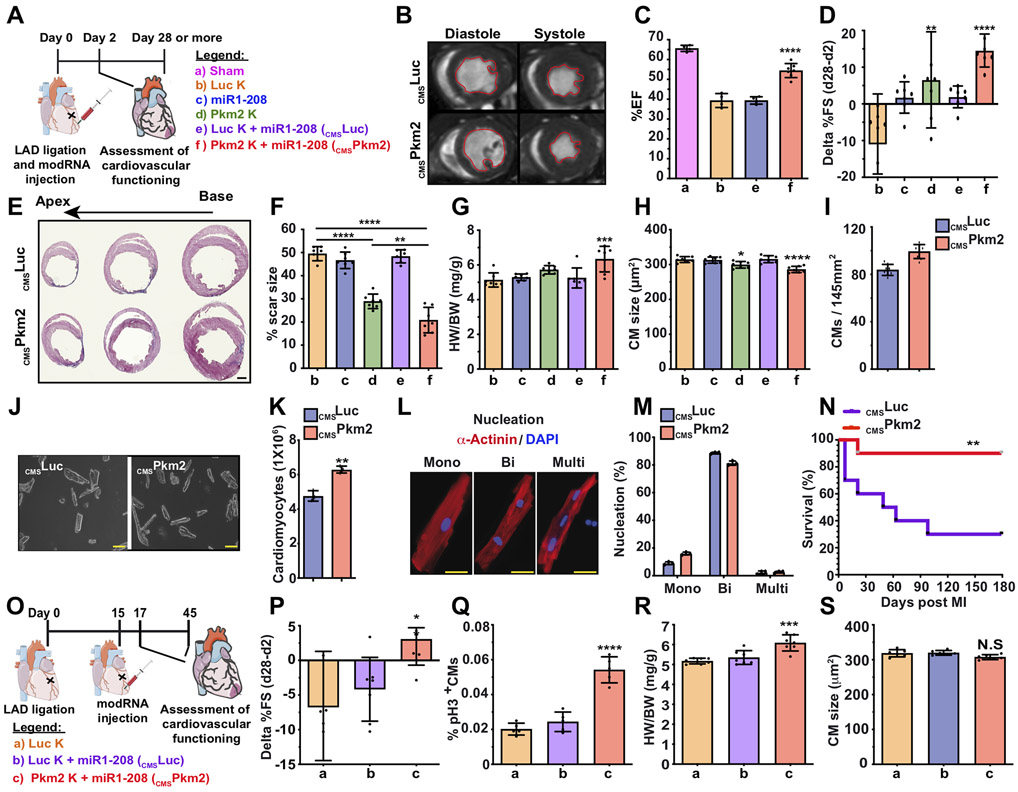
Methods: We investigated the effect of Pkm2 in cardiomyocytes through models of loss (cardiomyocyte-specific Pkm2 deletion during cardiac development) or gain using cardiomyocyte-specific Pkm2 modified mRNA to evaluate Pkm2 function and regenerative affects after acute or chronic myocardial infarction in mice.

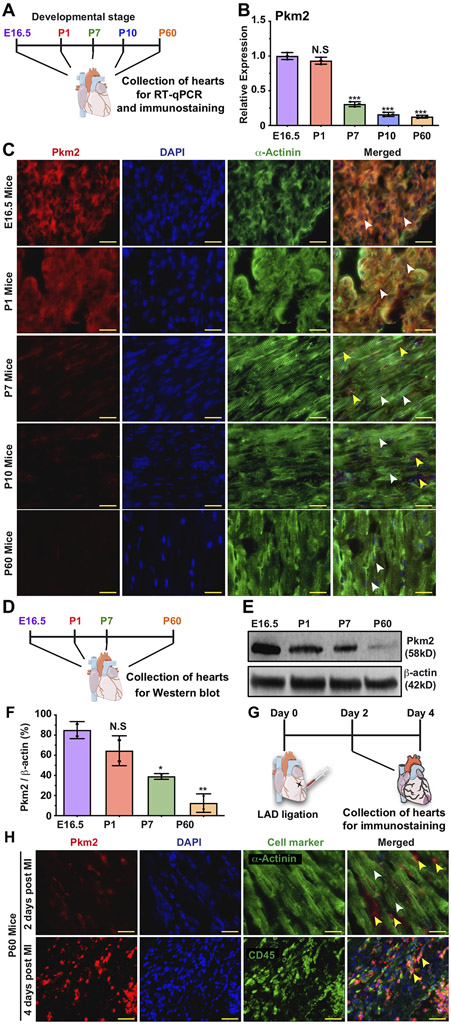
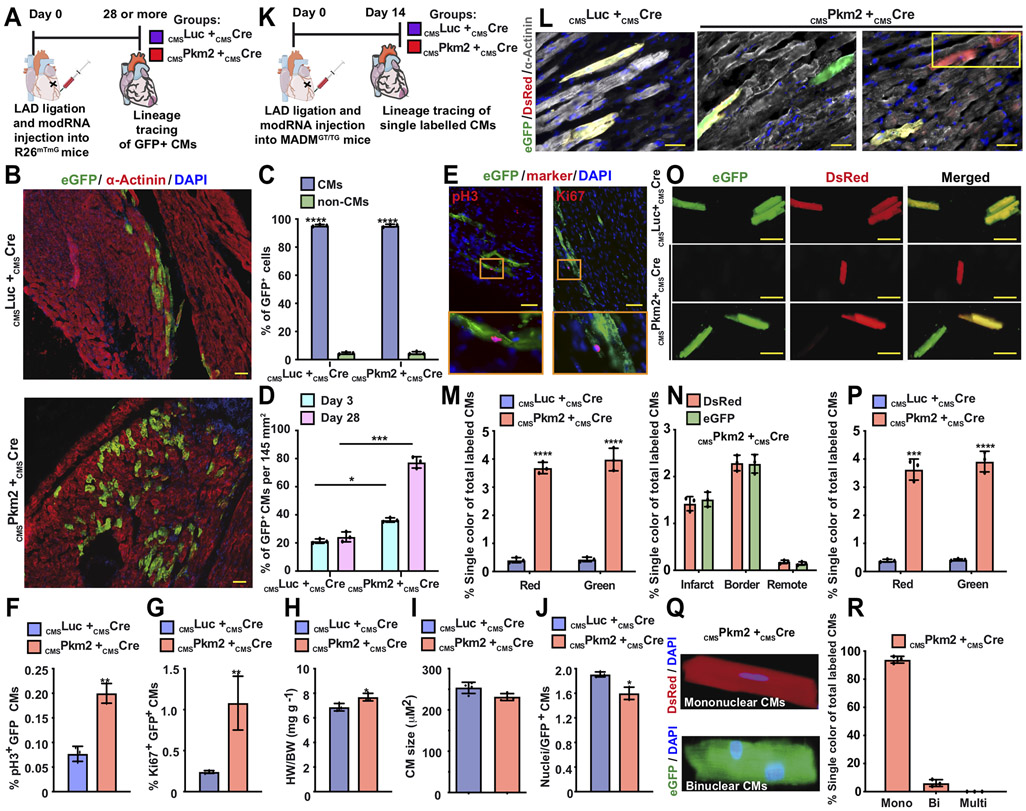
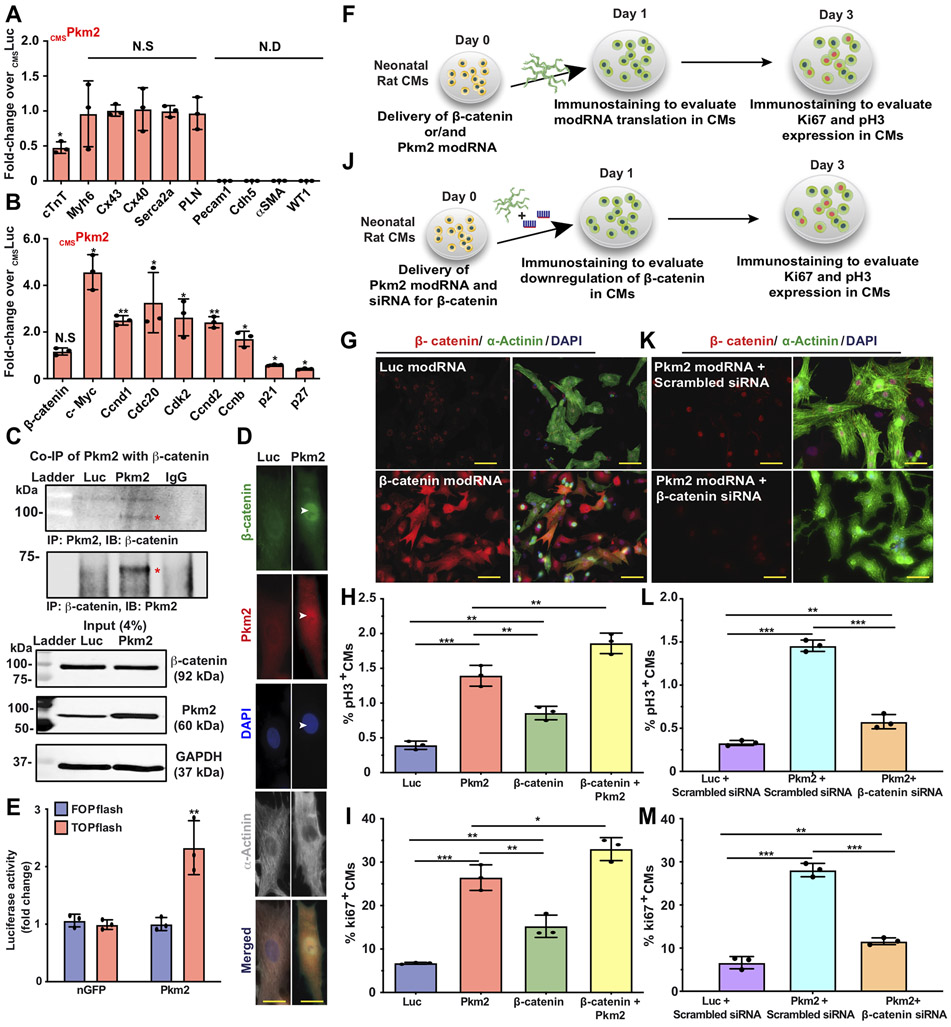
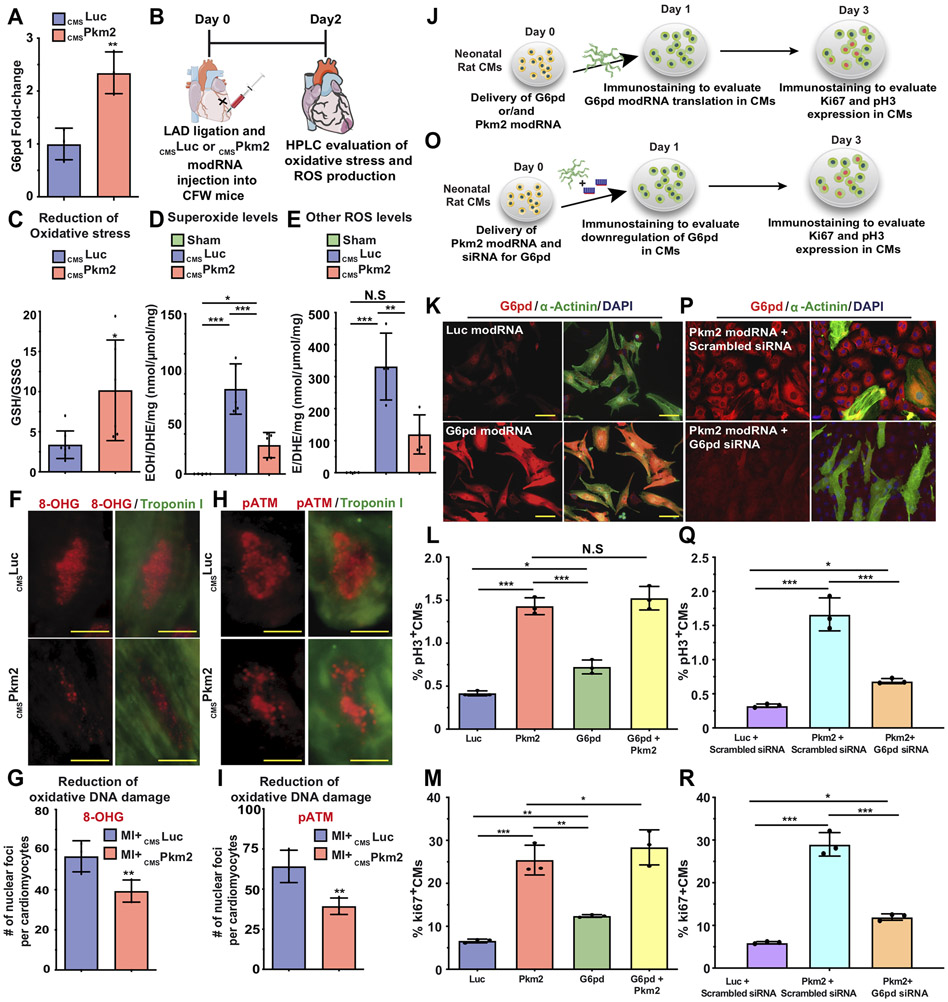
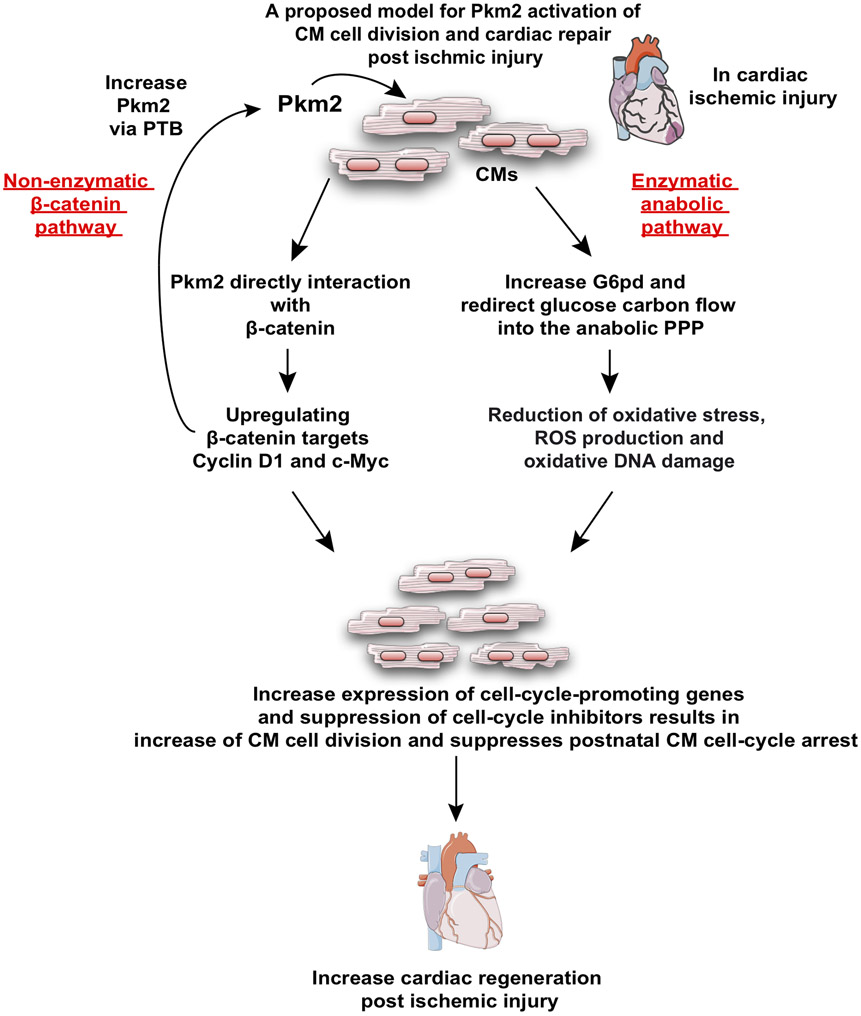
Results: Here, we identify Pkm2 as an important regulator of the cardiomyocyte cell cycle. We show that Pkm2 is expressed in cardiomyocytes during development and immediately after birth but not during adulthood. Loss of function studies show that cardiomyocyte-specific Pkm2 deletion during cardiac development resulted in significantly reduced cardiomyocyte cell cycle, cardiomyocyte numbers, and myocardial size. In addition, using cardiomyocyte-specific Pkm2 modified RNA, our novel cardiomyocyte-targeted strategy, after acute or chronic myocardial infarction, resulted in increased cardiomyocyte cell division, enhanced cardiac function, and improved long-term survival. We mechanistically show that Pkm2 regulates the cardiomyocyte cell cycle and reduces oxidative stress damage through anabolic pathways and β-catenin.

Conclusions: We demonstrate that Pkm2 is an important intrinsic regulator of the cardiomyocyte cell cycle and oxidative stress, and highlight its therapeutic potential using cardiomyocyte-specific Pkm2 modified RNA as a gene delivery platform.

Keywords: anabolism; cardiomyocytes; cell proliferation; regeneration.


Figures

Figure 1.
Figure 1.. Pkm2 expression in CMs during different stages of heart development and post MI.
A. Experimental timeline for Pkm2 qRT-PCR and immunostaining with Pkm2 and α-Actinin (CM marker) at different stages of mouse heart development. B. Relative expression of Pkm2 measured by qRT-PCR in mice hearts (E16.5, P1, P7, P10 or P60, n=3). C. Representative images of Pkm2 expression at different stages of mouse heart development. D. Experimental plan for Pkm2 western blot analysis at different stages of mouse heart development. E. Western blot Pkm2. F. Quantitative analysis of e (n=2). G. Experimental plan for immunostaining Pkm2 and α-Actinin or CD45 (leukocyte marker) at different time points post MI. H. Representative images of Pkm2 expression at different time points post MI. White arrowheads point to CMs. Yellow arrowheads point to non-CMs. One-way ANOVA, Tukey's Multiple Comparison Test for B&F. ***, P<0.001, **, P<0.01, *, P<0.05, N.S, Not Significant. Scale bar = 25μm.
Figure 2.
Figure 2.. Transient and exclusive Pkm2 expression in CMs, delivered using CMSPkm2 modRNA, increases cell cycle markers in postnatal CMs.
A. Experimental design to evaluate the CMSmodRNA expression tool using Rosa26mTmG mice, which were transfected with either Cre modRNA alone or CMSCre modRNA immediately post MI. Seven days later, hearts were collected and stained for GFP, α-Actinin and DAPI. B. Representative images of Rosa26mTmG adult mouse heart 7 days post MI and delivery of either Cre modRNA alone or CMSCre modRNA. C. Experimental timeline for evaluating cmsPkm2 modRNA expression (day 1) and effect (day 7) on cell cycle markers (Brdu, Ki67 and pH3) in CMs and non-CMs. D. Representative images of Pkm2 expression in CMs and non-CMs 1 day post MI and delivery of Luc K, Pkm2 K or CMSPkm2 modRNA. E. Representative images of cycle markers (BrdU, Ki67, pH3 and Aurora B) expression in CMs 7 days post MI and delivery of CMSPkm2 modRNA. F&G. Quantification of cell cycle markers in CMs (F) or non-CMs (G) 7 days post MI (n=3). One-way ANOVA, Tukey's Multiple Comparison Test for F&G. ***, P<0.001, **, P<0.01, N.S, Not Significant. Scale bar = 50μm (D) and 25μm (E).
Figure 3.
Figure 3.. Lineage tracing models show that transient Pkm2 expression increase CM cell division and suppress postnatal CM cell-cycle arrest.
A. Experimental timeline used for cardiac lineage tracing in R26mTmG mice B. Representative images of transfected CMs and their progeny (GFP+, α-Actinin+) 28 days post MI. C. Quantification of GFP+ CMs 3 or 28 days post MI (n=3). D. Transfection efficiency (%GFP+) of CMs or non-CMs 28 days post MI (n=3). E. Representative images of GFP+ CMs, pH3+ or Ki67+ 28 days post MI. F&G. Quantification of GFP+ pH3+ (F. n=3) or GFP+ Ki67+ CMs (G. n=3) 28 days post transfection with CMSLuc or CMSPkm2 with CMSCre modRNA in MI model. H-J. Ratio of heart to body weight (H. n=3), relative cross-sectional area of GFP+ CMs (I. n=3) and number of nuclei in GFP+ CMs (J. n=3) in hearts 28 days post MI and delivery of CMSPkm2 in cardiac lineage tracing model using R26mTmG mice. K. Experimental timeline to trace proliferating CMs using MADM mice L. Representative images of single-color- (Green (eGFP+/DsRed), Red (eGFP/DsRed+)) or double-color- (Yellow (eGFP+/DsRed+) labeled CMs 14 days post MI and injection of CMSLuc or cmsPkm2 with CMSCre modRNA in a MADM MI mouse model. M. Quantification of single-color CMs (Red or Green) amongst total labeled CMs 14 days post MI (n=5). N. Distribution of single-color CMs in the heart 14 days post MI (n=3, infarct, border or remote area). O. Representative images of isolated CMs from MADM mice 14 days post MI and modRNA injection. P. Quantification of isolated single-color CMs 14 days post MI (n=3). Q&R. Representative image (Q) and quantification (R, n=3, mono, bi or multi) of single-color CM nucleation 14 days post MI. Unpaired two-tailed t-test or Two-way ANOVA to analyze the data in C&D. ****, P<0.0001, ***, P<0.001, **, P<0.01, *, P<0.05, N.S, Not Significant. Scale bar = 50μm (B&L) or 5μm to E&O.
Figure 4.
Figure 4.. Pkm2 directly interacts with β-catenin, upregulates its downstream targets (Cyclin D1 and C-Myc) and increases expression of cell-cycle-promoting genes and cell cycle markers in postnatal CMs.
A&B. 2 days post MI and administration of cmsLuc or cmsPkm2 modRNAs with cmsihCD25, adult CMs were isolated using magnetic beads (please see method in Suppl. Fig. 13). A. qRT-PCR analysis to validate purity of isolated CMs, CM-specific markers and functional cardiac genes (n=3). B. Gene expression comparisons of β-catenin downstream target genes and expression of cell-cycle-promoting genes or cell-cycle inhibitors post cmsLuc or cmsPkm2 modRNA delivery into adult CMs (n=3). C. Co-Immunoprecipitation (Co-IP) and input control to evaluate Pkm2’s direct interaction with β-catenin in P3 rat neonatal CMs post Luc or Pkm2 modRNA transfection (n=2). D. Immunostaining of rat neonatal CM after Luc or Pkm2 modRNA delivery shows co-localized β-catenin and Pkm2 in the CM nucleus. E. Stabilizing β-catenin induced its interaction with TCF/LEF transcription factors in the nucleus, which in turn induced the expression of target genes (e.g cyclin D1. c-Myc) that can be measured by TOPflash (Luciferase reporter with TCF binding DNA sequence). Fopflash has mutant TCF binding DNA sequence (Fopflash), used as control. Quantitative TOPflash or Fopflash following delivery of nGFP (control) or Pkm2 modRNA (n=3). F. Experimental plan for evaluating overexpression of β-catenin alone or with Pkm2 modRNA and studying its effect on the expression of cell cycle genes in P3 neonatal rat CMs. G. Representative images of β-catenin expression 1 day post Luc or β-catenin modRNA transfection in vitro (co-stained α-Actinin and DAPI). H&I. Quantification of cell cycle markers (Ki67, pH3) in neonatal rat CMs 3 days after transfection of Luc, Pkm2 or β-catenin modRNA alone or combined Pkm2 and β-catenin modRNAs (n=3). J. Experimental timeline used to evaluate the role of β-catenin in CMs post Pkm2 modRNA delivery. K. Representative images of β-catenin inhibition by siRNA in CMs after Pkm2 modRNA delivery. L&M. Quantification of cell cycle markers (Ki67, pH3) in neonatal rat CMs 3 days after transfection with Luc or Pkm2 modRNA with scrambled siRNA or Pkm2 modRNA with siRNA for β -catenin (n=3). One-way ANOVA, Tukey's Multiple Comparison Test for A&B, H&I, L&M. Unpaired two-tailed t-test for E. ***, P<0.001, **, P<0.01, *, P<0.05, N.S, Not Significant. Scale bar = 10μm (D) and 25μm (G&K).
Figure 5.
Figure 5.. Pkm2 upregulates the anabolic enzyme G6pd, which reduces oxidative stress, ROS production and oxidative damage and leads to increased expression of cell cycle markers in postnatal CMs.
A. qPCR comparisons of G6pd expression 2 days post MI and administration of cmsLuc or cmsPkm2 modRNAs with cmsihCD25, when adult CMs were isolated using magnetic beads (please see method in Suppl. Fig. 13). B. Experimental timeline used to evaluate reduced oxidative stress or ROS production post MI and delivery of cmsLuc or cmsPkm2 modRNA. C. HPLC quantification of GSH/GSSG ratio (n=6). D&E. HPLC quantification of superoxide probe dihydroethidium (DHE) in 2-hydroxyethidium (D. n=5, EOH) or ethidium (E. n=4, E) 2 days post MI and cmsLuc or cmsPkm2 modRNA injection or sham operation. F. Representative images of 8-OHG foci frequency in CMs 2 days post MI and transfection with either CMSLuc or CMSPkm2 modRNA (co-stained α-Actinin and DAPI). G. Quantitative analysis of F (n=3). H. Representative images of pATM foci frequency in CMs 2 days post MI and transfection with CMSLuc or CMSPkm2 modRNA. I. Quantitative analysis of H (n=3). J. Experimental plan for evaluating overexpression of G6pd alone or with Pkm2 modRNA and studying its effect on the expression of cell cycle genes in P3 neonatal rat CMs. K. Representative images of G6pd expression 1 day post Luc or G6pd modRNAs transfection in vitro (co-stained α-Actinin and DAPI). L&M. Quantification of cell cycle markers (Ki67, pH3) in neonatal rat CMs 3 days after transfection of Luc, Pkm2 or G6pd modRNA alone or combined Pkm2 and G6pd modRNAs (n=3). O. Experimental timeline used to evaluate the role of G6pd in CMs post Pkm2 modRNA delivery. P. Representative images of G6pd inhibition by siRNA in CMs post Pkm2 modRNA delivery. Q&R. Quantification of cell cycle markers (Ki67, pH3) in neonatal rat CMs 3 days after transfection with Luc or Pkm2 modRNA with scrambled siRNA or Pkm2 modRNA with siRNA for G6pd (n=3). One-way ANOVA, Tukey's Multiple Comparison Test for L&M, Q&R. Unpaired two-tailed t-test for A, C-E, G and I. ***, P<0.001, **, P<0.01, *, P<0.05, N.S, Not Significant. Scale bar = 5μm (D) and 25μm (G&K).
Figure 6.
Figure 6.. Loss of function study of Pkm2 expression in CMs during heart development reduces heart size, increases CM size, lowers total CM number and limits CM cell division capacity.
A. Experimental plan for generating inducible CMSWT (Pkm2+/+, (B6129SF2/J) littermates expressing Cre exclusively in CMs) or CMSKO-Pkm2 mice. B. Experimental timeline for evaluating the effect of CMSKO-Pkm2 on CM cell division and heart development. C. Representative images of E18 CMSWT or CMSKO-Pkm2 mice and evaluation of body weight (D. n=7). E. Representative images of Pkm2 and α-Actinin immunostaining as well as whole heart H&E staining F. Evaluation of heart size (G. n=4) and heart weight to body weight ratio (H. n=7) of E18 CMSWT or CMSKO-Pkm2. Representative images of WGA (I.) and quantification thereof (J. n=7). Quantification of CM numbers isolated from heart (K. n=4) or counted per section (L. n=7) in E18 CMSWT or CMSKO-Pkm2 mice. M. Representative images of pH3+ or Ki67+ CMs in E18 CMSWT or CMSKO-Pkm2 hearts. Quantification of pH3+ (N. n=7) or ki67+ (O. n=7) CMs in E18 CMSWT or CMSKO-Pkm2 hearts. P. Representative images of pH3- or Ki67-positive CMs in isolated CMs from E18 CMSWT or CMSKO-Pkm2 hearts. Quantification of pH3+ (Q. n=5) or ki67+ (R. n=5) CMs isolated from E18 CMSWT or CMSKO-Pkm2 hearts. S. Relative gene expression measured by qRT-PCR comparing E18 CMSWT or CMSKO-Pkm2 hearts (n=3). T. Representative images of Pkm1 expression in E18 CMSWT or CMSKO-Pkm2 hearts. White arrowheads point to CMs. Yellow arrowheads point to non-CMs. Unpaired two-tailed t-test for (D, G, H, J-L, N, O, Q, R and S). ****, P<0.0001, ***, P<0.001, **, P<0.01, *, P<0.05, N.S, Not Significant. Scale bar = 25μm (E and T), 5μm (I), 50μm (M&P).
Figure 7.
Figure 7.. Gain of function study of Pkm2 expression in CMs improves cardiac function and outcome after acute or chronic MI.
A. Experimental timeline to evaluate cardiac function and outcome in an acute MI mouse model. B. MRI assessments of left ventricular systolic function 1 month post MI. Images depict left ventricular chamber (outlined in red) in diastole and systole. C. Percentage of ejection fraction for the experiments in B. (a, n=3; b, n=4; e, n=4; f, n=7). D. Echo evaluation of delta in percentage of fractioning shorting differences between day 2 (baseline) and day 28 post MI (n=7). E. Representative masson trichrome staining to evaluate scar size 28 days post MI. F-I. Quantification of scar size (F. n=7), heart weight to body weight ratio (G. n=7), CM size (H. n=7) and CM numbers per section (I. n=8) measured 28 days post MI. Representative images of CM numbers isolated from heart after treatments with CMSLuc or CMSPkm2 28 days post MI. (J.) and quantification of the experiment in J. (K. n=3). L. Representative images of nuclei of isolated CMs (mono, bi or multi). M. Quantification of the experiment in L. (n=3). N. Long-term post-MI survival curve for mice injected with cmsLuc or cmsPkm2 modRNAs (n=10). O. Experimental timeline to evaluate cardiac function and outcome in a chronic MI mouse model. P. Echo evaluation of delta in percentage of fractioning shorting differences between day 17 (baseline) and day 45 post MI (n=7). Q-S. Quantification of pH3+ CMs in the heart (Q. n=5), heart weight to body weight ratio (R. n=7) or CM size (S. n=7) in the heart with different treatments 45 days post MI. White arrowheads point to CMs. Yellow arrowheads point to non-CMs. One-way ANOVA, Bonferroni post-hoc test for (C&D, F-I and P-S), Unpaired two-tailed t-test for (J, K and M), Mantel-Cox log-rank test (N). ****, P<0.0001, ***, P<0.001, **, P<0.01, *, P<0.05, N.S, Not Significant. Scale bar = 1mm (E), 50μm (K), 10μm (L).
Figure 8.
Figure 8.. A proposed model for Pkm2 enzymatic (via G6pd) and non-enzymatic (via β-catenin) mechanisms of action that promote CM cell division, suppress postnatal CM cell-cycle arrest and increase cardiac regeneration post ischemic injury.

References

    1. Porrello ER, Mahmoud AI, Simpson E, Hill JA, Richardson JA, Olson EN and Sadek HA. Transient regenerative potential of the neonatal mouse heart. Science. 2011;331:1078–1080. - PMC - PubMed
    1. Heallen T, Zhang M, Wang J, Bonilla-Claudio M, Klysik E, Johnson RL and Martin JF. Hippo pathway inhibits Wnt signaling to restrain cardiomyocyte proliferation and heart size. Science. 2011;332:458–461. - PMC - PubMed
    1. Lin Z, von Gise A, Zhou P, Gu F, Ma Q, Jiang J, Yau AL, Buck JN, Gouin KA, van Gorp PR, Zhou B, Chen J, Seidman JG, Wang DZ and Pu WT. Cardiac-specific YAP activation improves cardiac function and survival in an experimental murine MI model. Circ Res. 2014;115:354–363. - PMC - PubMed
    1. Morikawa Y, Heallen T, Leach J, Xiao Y and Martin JF. Dystrophin-glycoprotein complex sequesters Yap to inhibit cardiomyocyte proliferation. Nature. 2017;547:227–231. - PMC - PubMed
    1. Xin M, Kim Y, Sutherland LB, Murakami M, Qi X, McAnally J, Porrello ER, Mahmoud AI, Tan W, Shelton JM, Richardson JA, Sadek HA, Bassel-Duby R and Olson EN. Hippo pathway effector Yap promotes cardiac regeneration. Proc Natl Acad Sci U S A. 2013;110:13839–13844. - PMC - PubMed

Publication types