. 2020 May 4;217(5):e20191390.
doi: 10.1084/jem.20191390.

Pro-inflammatory activation following demyelination is required for myelin clearance and oligodendrogenesis

Affiliations

Pro-inflammatory activation following demyelination is required for myelin clearance and oligodendrogenesis

Maria Inês Cunha et al. J Exp Med. .

Abstract

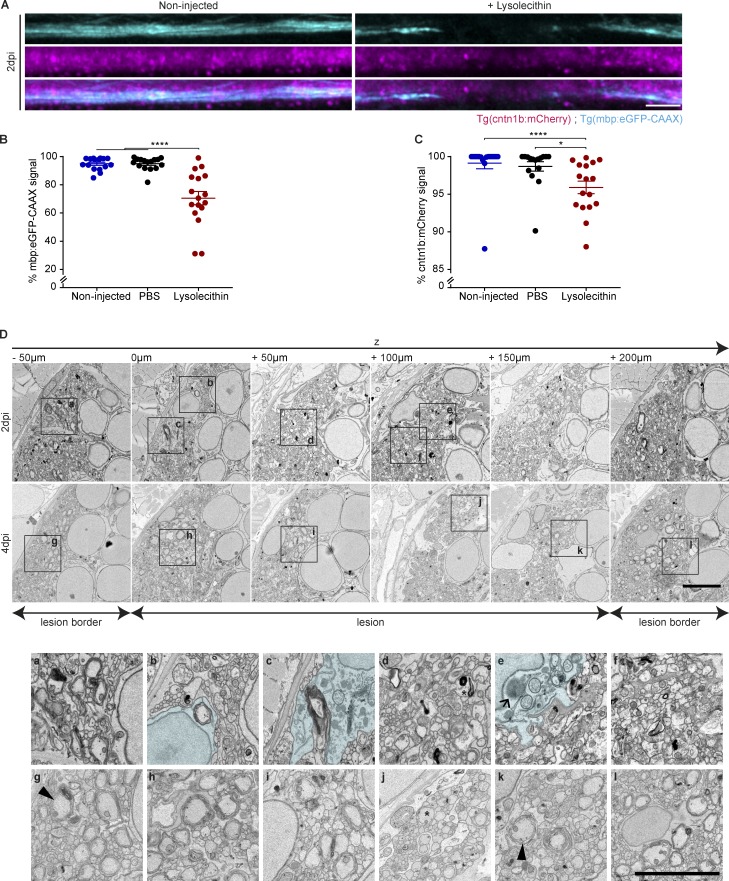
Remyelination requires innate immune system function, but how exactly microglia and macrophages clear myelin debris after injury and tailor a specific regenerative response is unclear. Here, we asked whether pro-inflammatory microglial/macrophage activation is required for this process. We established a novel toxin-based spinal cord model of de- and remyelination in zebrafish and showed that pro-inflammatory NF-κB-dependent activation in phagocytes occurs rapidly after myelin injury. We found that the pro-inflammatory response depends on myeloid differentiation primary response 88 (MyD88). MyD88-deficient mice and zebrafish were not only impaired in the degradation of myelin debris, but also in initiating the generation of new oligodendrocytes for myelin repair. We identified reduced generation of TNF-α in lesions of MyD88-deficient animals, a pro-inflammatory molecule that was able to induce the generation of new premyelinating oligodendrocytes. Our study shows that pro-inflammatory phagocytic signaling is required for myelin debris degradation, for inflammation resolution, and for initiating the generation of new oligodendrocytes.


Conflict of interest statement

Disclosures: The authors declare no competing interests exist.

Figures

Figure 1.
Figure 1.
The zebrafish larvae LPC model of de- and remyelination. (A–C) Confocal maximum intensity z-projections of a spinal cord lesion show the myelinated spinal cord (magenta) and phagocytes (cyan) over time. Phagocyte infiltration was determined by the total amount of mpeg1:eGFP signal in the lesion. Myelination was determined by the total amount of mbp:mCherry-CAAX signal in the dorsal spinal cord. n = 9–12, 15–16, 13–20, and 4–8 animals at 6 hpi, 2 dpi, 4 dpi, and 7 dpi, respectively. (D and E) Confocal maximum intensity z-projections of a spinal cord lesion show the myelinated spinal cord (magenta) and the nuclei of mature oligodendrocytes (cyan) over time in noninjected larvae and larvae injected with LPC. The number of mature oligodendrocytes was determined by counting the mbp:nls-eGFP positive nuclei. n = 20–21, 16–21, 20–22, and 12–15 animals at 6 hpi, 2 dpi, 4 dpi, and 7 dpi, respectively. (F and G) Confocal maximum intensity z-projections of the spinal cord lesion show the myelinated spinal cord (cyan) and the nuclei of oligodendrocyte precursor cells (magenta) over time in noninjected larvae and larvae injected with LPC. The number of OPCs was determined by counting the olig1:nls-mApple–positive nuclei. n = 8–10, 12–16, 16, 17, and 16 or 17 animals at 6 hpi, 1 dpi, 2 dpi, 3 dpi, and 4 dpi, respectively. (H and I) Confocal maximum intensity z-projections of the spinal cord lesion at 4 dpi show the myelinated spinal cord (cyan). Myelination was determined by the total amount of mbp:eGFP-CAAX signal in the dorsal spinal cord. n = 8–14 animals. Lateral views of the lesion site are shown; anterior is left and dorsal is down. All data are mean ± SEM (error bars). *, P < 0.05; **, P < 0.01; ***, P < 0.001; ****, P < 0.0001 by two-way ANOVA test in B, C, E, and G or one-way ANOVA in I, with Tukey’s multiple comparisons test. Scale bars: 50 µm in A and H; 20 µm in D and F.
Figure 2.
Figure 2.
Characterization of myelin and axonal damage in the zebrafish larvae LPC model. (A–C) Confocal maximum intensity z-projections of the spinal cord show the myelinated spinal cord (cyan) and the axons (magenta) at 2 dpi in noninjected larvae and larvae injected with LPC. n = 16 or 17 animals. (D) Electron micrographs of serial cross sections of the spinal cord lesion at 2 and 4 dpi in WT larvae injected with LPC. (D, a, b, and d–f) Close-up images showing myelin fragments in a demyelinating lesion at 2 dpi. (D, b and c) Close-up images showing a phagocyte (blue) engulfing myelinated axons at 2 dpi. (D, c and e) Close-up images showing lysosomes inside phagocytes (arrow in e) at 2 dpi. (D, b, d, f, and j) Close-up images showing demyelinated axons (asterisks in d and j, at 2 and 4 dpi, respectively). (D, g, h, j, and k) Close-up images showing the presence of partially myelinated axons at 4 dpi (arrowheads in g and k). All data are mean ± SEM (error bars). *, P < 0.05; ****, P < 0.0001 by one-way ANOVA, with Tukey’s multiple comparisons test in Bor Kruskal-Wallis test with Dunn’s multiple comparisons test in C. Scale bars: 50 µm in A; 5 µm in D.
Figure 3.
Figure 3.
Delayed clearance of ingested myelin debris by myd88−/− phagocytes in zebrafish larvae. (A and B) Confocal z-sections of a spinal cord lesion show NF-κB activation (cyan) in recruited phagocytes (magenta) over time. NF-κB activation was determined by the colocalized signal of NF-κb:eGFP with mpeg1:mCherry. n = 9 or 10, 7, and 10 or 11 animals at 6 hpi, 2 dpi, and 4 dpi, respectively. (C) Confocal maximum intensity z-projections from a 2 h time-lapse video (Video 1) of the spinal cord lesion at 2 dpi showing the myelinated spinal cord and myelin debris (magenta) and phagocyte (cyan) movement in WT larvae. (D and E) Confocal maximum intensity z-projections of the spinal cord lesion at 2 dpi and 4 dpi show the myelinated spinal cord and myelin debris (magenta) in phagocytes (cyan). The amount of internalized myelin was determined by the colocalized signal of mbp:mCherry-CAAX within mpeg1:eGFP. n = 11–15 and 15–17 animals at 2 and 4 dpi, respectively. (F and G) Confocal maximum intensity z-projections of the spinal cord lesion at 4 dpi, showing lysosomes (magenta) in phagocytes (cyan). The amount of lysosomes was determined by the colocalized signal of LysoTracker with mpeg1:eGFP. n = 8–10 and 14–25 animals at 2 and 4 dpi, respectively. (H and I) Confocal maximum intensity z-projections from 2 h time-lapse videos (Videos 2 and 3) of the spinal cord lesion at 3 dpi show the myelinated spinal cord and myelin debris (magenta) and phagocyte (cyan) movement. Arrowheads show actively moving phagocytes, and short arrows show amoeboid stationary phagocytes. n = 6 or 7 animals. Lateral views of the lesion site are shown; anterior is left and dorsal is down. All data are mean ± SEM (error bars). *, P < 0.05; **, P < 0.01; ****, P < 0.0001; n.s. indicates no significance, by two-way ANOVA test with Tukey’s multiple comparisons test in B, D, and E or Sidak’s multiple comparisons test in G and unpaired t test with Welch's correction in J. Scale bars: 20 µm.
Figure S1.
Figure S1.
Characterization of WT and Myd88−/− zebrafish and mice in noninjected and injected conditions. (A) Confocal maximum intensity z-projections of the spinal cord at 2 and 4 dpi showing lysosomes (magenta) in the phagocytes (cyan) in noninjected WT larvae. (B) Quantification of the amount of lysosomes in phagocytes determined by the colocalized signal of LysoTracker with mpeg1:eGFP relative to the total amount of mpeg1:eGFP signal. n = 6 or 10 animals. (C and D) Luxol Fast Blue staining of mouse spinal cord lesions at 4 dpi. Lesion area was determined by the lack of staining. n = 6 or 7 lesions. (E and F) IBA1+ microglia/macrophages were recruited to LPC-induced demyelinated lesions of both WT and Myd88−/− mice at 4 dpi. n = 6 or 7 lesions. (G and H) At 7 dpi, the proportion of the volume (V) occupied by IBA1+ cells in the lesions was similar in Myd88−/− and WT mice. n = 9 lesions. All data are mean ± SEM (error bars). Scale bars: 20 µm in A; 50 µm in C; 100 µm in E and G.
Figure 4.
Figure 4.
Phagocyte retention in LPC-induced lesions of Myd88−/− mice and impaired phagosome maturation. (A and B) Proportion of the volume occupied by IBA1+ cells in the lesions (devoid of FluoroMyelin) of WT and Myd88−/− mice at 14 dpi. n = 4 or 5 lesions. (C and D) Total accumulation of myelin lipids in IBA1+ cells in mouse spinal cord lesions at 14 dpi, analyzed by the proportion of the volume (V) occupied by both FluoroMyelin (green) and IBA1 (magenta; colocalization, white), shown in A, in the lesions (C) and analyzed per total amount of IBA1 signal (D). n = 4 or 5 lesions. (E and F) Degradation of myelin lipids in cultured microglia. The area of FluoroMyelin in each cell was normalized to the average area of FluoroMyelin per cell at the initial time point (0 h after myelin treatment). n = 3 independent experiments. 6 h after myelin treatment Myd88−/− versus WT: P < 2.2 × 10⁻¹⁶; effect size (Cohen’s d) = 0.542; 1,188 Myd88−/− cells and 1,016 WT cells. 24 h after myelin treatment: Myd88−/− versus WT: P < 2.2 × 10⁻¹⁶; effect size (Cohen’s d) = 0.657; 988 Myd88−/− cells and 947 WT cells. (G–I) Phagosome maturation in myelin-loaded microglia. (G) Myelin+ phagosomes (myelin labeled with PKH67, green) and endolysosomes (LysoTracker Red+, magenta) were detected by live-cell imaging. (H and I) Fusion of phagosomes containing myelin debris with endolysosomes, as analyzed by the area of the overlap between myelin debris and LysoTracker in each cell, 1 h after treatment with myelin debris. n = 3 independent experiments. Myd88−/− versus WT: P = 1.911 × 10⁻⁹; effect size (Cohen’s d) = −0.430; 573 Myd88−/− cells and 352 WT cells. (J–L) Oxidative activity in cultured microglia after phagocytosing myelin debris. Representative overview and inset. The organelles labeled with OxyBURST BSA (magenta) identified ROS. Internalized myelin debris was identified by PLP (green). n = 3 independent experiments. Myd88−/− versus WT: P = 4.388 × 10⁻⁶; effect size (Cohen’s d) = −0.345; 750 Myd88−/− cells and 378 WT cells. Data are mean ± SEM (error bars) in B, C, and D and 95% CI in F, H, and K. *, P < 0.05; **, P < 0.01; ****, P < 0.0001 by unpaired t test with Welch's correction in B, C, F, H, and K. Scale bars: 100 µm in A; 50 µm in E; and 10 µm in G and J.
Figure 5.
Figure 5.
Delayed phagocyte efflux in myd88−/− zebrafish larvae with impaired remyelination. (A–C) Confocal maximum intensity z-projections of the spinal cord lesion over time show the myelinated spinal cord (magenta) and phagocytes (cyan) in WT and myd88−/− larvae injected with LPC. Phagocyte infiltration was determined by the total amount of mpeg1:eGFP signal in the lesion. Myelination was determined by the total amount of mbp:mCherry-CAAX signal in the dorsal spinal cord. n = 15–19, 11–17, and 13–17 animals at 6 hpi, 2 dpi, and 4 dpi, respectively. (D and E) Confocal maximum intensity z-projections of the spinal cord lesion at 4 dpi show the myelinated spinal cord (magenta) and the nuclei of mature oligodendrocytes (cyan). The number of mature oligodendrocytes was determined by counting the number of mbp:nls-eGFP–positive nuclei. n = 7 or 10 animals. (F and G) Confocal maximum intensity z-projections of the spinal cord lesion at 4 dpi show the myelinated spinal cord (cyan) and the nuclei of OPCs (magenta). The number of OPCs was determined by counting the number of olig1:nls-mApple–positive nuclei. n = 7 or 8 animals. Lateral views of the lesion site are shown; anterior is left and dorsal is down. All data are mean ± SEM (error bars). *, P < 0.05; ****, P < 0.0001 by two-way ANOVA test, with Tukey’s multiple comparisons test in B and C and unpaired t test with Welch's correction in E and G. Control noninjected larvae WT and myd88−/− animals are included in the statistical analysis in B and C and are represented in Fig. S3, A–C. Scale bars: 50 µm in A; 20 µm in D and F.
Figure S2.
Figure S2.
Myelination and phagocyte infiltration are not affected in myd88−/− noninjected larvae. (A) Confocal maximum intensity z-projections of the spinal cord of noninjected larvae over time, showing the myelinated spinal cord (magenta) and phagocytes (cyan) in WT and myd88−/−larvae. (B) Quantification of myelination determined by the total amount of mbp:mCherry-CAAX signal in the dorsal spinal cord. n = 15–19, 11–17, and 13–17at 6 hpi, 2 dpi, and 4 dpi, respectively. (C) Quantification of phagocyte infiltration in the spinal cord determined by the total amount of mpeg1:eGFP signal. n = 15–19, 11–17, and 13–17at 6 hpi, 2 dpi, and 4 dpi, respectively. (D) Confocal maximum intensity z-projections of the spinal cord of noninjected larvae at 4 dpi, showing the myelinated spinal cord (magenta) and the nuclei of mature oligodendrocytes (cyan) in WT and myd88−/− larvae. (E) Quantification of the number of mature oligodendrocytes present in the spinal cord determined by the number of mbp:nls-eGFP–positive nuclei. n = 10 or 8 animals. (F) Confocal maximum intensity z-projections of the spinal cord of noninjected larvae at 4 dpi, showing the myelinated spinal cord (cyan) and the nuclei of oligodendrocyte precursor cells (magenta) in WT and myd88−/− larvae. (G) Quantification of the number of OPCs present in the spinal cord determined by the number of olig1:nls-mApple–positive nuclei. n = 5 or 7 animals. (H and I) Electron micrographs of 6 dpf noninjected dorsal spinal cord cross sections in WT and myd88−/− larvae. Total number of myelinated axons was determined in a representative cross section per animal. n = 3 animals. All data are mean ± SEM (error bars). Scale bars: 50 µm in A; 20 µm in D and F; 1 µm in H.
Figure 6.
Figure 6.
Defective remyelination in the spinal cord of Myd88−/− mice. (A and B) OPCs in demyelinated lesions in mouse spinal cords at 7 dpi. The nuclei of OPCs were identified by the expression of both NKX-2.2 (magenta) and OLIG2 (green; colocalization, white). n = 3–9 lesions. (C and D) Premyelinating oligodendrocytes expressing BCAS1 (green) in mouse spinal cord lesions at 7 dpi. n = 4–10 lesions. (E and F) Mature oligodendrocytes expressing both APC (CC1; magenta, cytoplasm) and OLIG2 (green, nucleus) in mouse spinal cord lesions at 21 dpi. n = 3–7 lesions. (G and H) Remyelination in mouse spinal cord lesions at 21 dpi, quantified by the density of remyelinated axons in semi-thin sections. n = 4–6 lesions. Data are mean ± 95% CI (error bars) in B, D, and F or SEM in H. *, P < 0.05; ****, P < 0.0001 by two-way ANOVA test, with Sidak’s multiple comparisons test in B, D, and F and unpaired t test with Welch's correction in H. Scale bars: 100 µm in A, C, and E; 10 µm in G.
Figure S3.
Figure S3.
Oligodendrogenesis is not affected in MyD88-deficient mice. (A) The numbers of oligodendrocytes and OPCs in the corpus callosum (CC) of P7 Myd88−/− and WT mice were similar. The nuclei of OPCs were identified by the expression of both transcription factors NKX-2.2 and OLIG2. (B) The cell density of OPCs in the CC was similar. (C) The cell density of oligodendrocyte-lineage cells in the CC was similar. (D) The proportion of OPCs among oligodendrocyte-lineage cells was similar, suggesting normal OPC proliferation in the developing brain of MyD88-deficient mice. n = 4 or 6 animals. (E–G) Electron micrographs of mouse spinal cord cross sections of 7–8-wk-old WT and Myd88−/− mice. The number of myelinated axons was determined in two or three 1,600-µm2 areas per animal. Myelin thickness was determined by g-ratio analysis in 225 µm2 per animal. n = 4 animals. Data are mean ± 95% CI (error bars) in B, C, and D or SEM in F and G. Scale bar: 100 µm in A; 2 µm in E.
Figure 7.
Figure 7.
Proteome analysis of cultured microglia identified TNF-α as a candidate regulator of the response to myelin debris. (A) Volcano plot of regulated proteins in vehicle-treated Myd88−/− versus vehicle-treated WT. (B) Volcano plot of regulated proteins in myelin-treated Myd88−/− versus myelin-treated WT. The negative log10 transformed P value is plotted against the log2 transformed LFQ intensity ratios for each protein. Proteins with a P value <0.05 are indicated as red circles, whereas proteins with a P value >0.05 are indicated as blue circles. The hyperbolic curves indicate the threshold of a permutation-based FDR correction for multiple hypotheses (FDR: P = 0.05, s0 = 0.1). (C) Heat map of the top 35 regulated proteins, which were consistently quantified in all comparisons. The log2 fold changes of the proteins are indicated in a color scale from blue to red. (D) Heat map of significant upstream regulators predicted by Ingenuity Pathway Analysis. The negative log10 P value was multiplied with the sign of the related z-score. Blue color indicates a decreased activation, whereas red color indicates an increased activation with the corresponding upstream regulator.
Figure S4.
Figure S4.
Proteome analysis of cultured microglia. (A and B) Volcano plots of regulated proteins in myelin-treated versus vehicle-treated WT microglia and myelin-treated versus vehicle-treated Myd88−/− microglia, respectively. The negative log10 transformed P value is plotted against the log2 transformed LFQ intensity ratios for each protein. Proteins with a P value <0.05 are indicated as red circles, whereas proteins with a P value >0.05 are indicated as blue circles. The hyperbolic curves indicate the threshold of a permutation-based FDR correction for multiple hypotheses (FDR: P = 0.05, s0 = 0.1).
Figure 8.
Figure 8.
TNF-α expression is induced after a demyelinating injury and increases the number of premyelinating oligodendrocytes. (A and B) Confocal maximum intensity z-projections of RNAscope in situ hybridization targeting TNF-α in mouse spinal cord lesions at 4 dpi. TNF-α was determined by the total amount of signal in the lesion. n = 4 or 5 lesions. (C) TNF-α mRNA in spinal cord lesions of zebrafish larvae was determined by quantitative RT-PCR of lesions at 6 hpi. n = 3 independent experiments. (D–G) After 5 or 6 DIV, OCSCs were treated with 50 or 100 ng/ml recombinant mouse TNF-α and EdU for 48 h. (D and E) Newly formed myelinating oligodendrocytes were labeled by EdU (green) and expressed BCAS1 (magenta; examples of colocalization, white arrowheads) in the cell body. n = 5–11 slices in two experiments. (F and G) Newly generated oligodendrocytes that expressed OLIG2 (magenta) and incorporated EdU (green; examples of colocalization, white arrowheads). n = 6–13 slices in two experiments. (H) Schematic representation of cortical injection of TNF-α or vehicle in WT mice. (I) IHC of BCAS1 on day 5 after stereotactic injection of vehicle or TNF-α in WT mice. (J) Quantification of BCAS1+ cells with a premyelinating morphology in the subpial cortex day 5 after stereotactic injection of vehicle or TNF-α. (K and L) 2 h after myelin debris treatment, TNF-α (50 ng/ml) was added to cultured microglia for 6 h. The amount of PLP per cell at 6 h was normalized to the initial amount of PLP per cell (0 h). Myelin treatment control versus TNF-α: P = 3.125 × 10⁻⁶; effect size (Cohen’s d) = 0.224; 703 cells in the control group and 1,252 cells in the TNF-α treatment group were sampled randomly. n = 3 independent experiments. (M and N) After 7 DIV, OCSCs were treated with 0.5 mg/ml LPC for 16 h and subsequently with TNF-α (100 ng/ml) for 48 h, and BCAS1 immunoreactivity was determined in the slices. n = 9–17 slices in four to six independent experiments. All data are mean ± SEM (error bars). *, P < 0.05; **, P < 0.01; ***, P < 0.001; ****, P < 0.0001 by unpaired t test with Welch's correction in B, J, and L; one-way ANOVA test with Tukey’s multiple comparisons test in C, E, and G; and two-way ANOVA test with Tukey’s and Sidak’s multiple comparisons tests in N. Scale bars: 20 µm in A; 100 µm in D, F, and I; 60 µm in K; and 500 µm in M.
Figure S5.
Figure S5.
Quantification of TNF-α in IBA1+ cells. (A and B) Confocal maximum intensity z-projections of combined RNAscope in situ hybridization and IHC to visualize TNF-α transcript and IBA1 protein, respectively, in WT mouse spinal cord lesions at 4 dpi. The amount of TNF-α in IBA1+ cells was determined by the colocalized signal of TNF-α with IBA1 per total amount of TNF-α signal. n = 4 lesions. All data are mean ± SEM (error bars). Scale bar: 20 µm.

Comment in

References

    1. Adachi O., Kawai T., Takeda K., Matsumoto M., Tsutsui H., Sakagami M., Nakanishi K., and Akira S.. 1998. Targeted disruption of the MyD88 gene results in loss of IL-1- and IL-18-mediated function. Immunity. 9:143–150. 10.1016/S1074-7613(00)80596-8 - DOI - PubMed
    1. Akassoglou K., Bauer J., Kassiotis G., Pasparakis M., Lassmann H., Kollias G., and Probert L.. 1998. Oligodendrocyte apoptosis and primary demyelination induced by local TNF/p55TNF receptor signaling in the central nervous system of transgenic mice: models for multiple sclerosis with primary oligodendrogliopathy. Am. J. Pathol. 153:801–813. 10.1016/S0002-9440(10)65622-2 - DOI - PMC - PubMed
    1. Almeida R.G., Czopka T., Ffrench-Constant C., and Lyons D.A.. 2011. Individual axons regulate the myelinating potential of single oligodendrocytes in vivo. Development. 138:4443–4450. 10.1242/dev.071001 - DOI - PMC - PubMed
    1. Arnett H.A., Mason J., Marino M., Suzuki K., Matsushima G.K., and Ting J.P.. 2001. TNF alpha promotes proliferation of oligodendrocyte progenitors and remyelination. Nat. Neurosci. 4:1116–1122. 10.1038/nn738 - DOI - PubMed
    1. Auer F., Vagionitis S., and Czopka T.. 2018. Evidence for Myelin Sheath Remodeling in the CNS Revealed by In Vivo Imaging. Curr. Biol. 28:549–559.e3. 10.1016/j.cub.2018.01.017 - DOI - PubMed

Publication types

MeSH terms