. 2020 Feb 16;21(4):1324.
doi: 10.3390/ijms21041324.

Blood Metabolite Signatures of Metabolic Syndrome in Two Cross-Cultural Older Adult Cohorts

Affiliations

Blood Metabolite Signatures of Metabolic Syndrome in Two Cross-Cultural Older Adult Cohorts

Uma V Mahajan et al. Int J Mol Sci. .

Abstract

Metabolic syndrome (MetS) affects an increasing number of older adults worldwide. Cross-cultural comparisons can provide insight into how factors, including genetic, environmental, and lifestyle, may influence MetS prevalence. Metabolomics, which measures the biochemical products of cell processes, can be used to enhance a mechanistic understanding of how biological factors influence metabolic outcomes. In this study we examined associations between serum metabolite concentrations, representing a range of biochemical pathways and metabolic syndrome in two older adult cohorts: The Tsuruoka Metabolomics Cohort Study (TMCS) from Japan (n = 104) and the Baltimore Longitudinal Study of Aging (BLSA) from the United States (n = 146). We used logistic regression to model associations between MetS and metabolite concentrations. We found that metabolites from the phosphatidylcholines-acyl-alkyl, sphingomyelin, and hexose classes were significantly associated with MetS and risk factor outcomes in both cohorts. In BLSA, metabolites across all classes were uniquely associated with all outcomes. In TMCS, metabolites from the amino acid, biogenic amines, and free fatty acid classes were uniquely associated with MetS, and metabolites from the sphingomyelin class were uniquely associated with elevated triglycerides. The metabolites and metabolite classes we identified may be relevant for future studies exploring disease mechanisms and identifying novel precision therapy targets for individualized medicine.

Keywords: acylcarnitines; amino acids; ceramides; diabetes; hypertension; metabolic syndrome; metabolomics; obesity; phosphatidylcholines; sphingomyelins; triglycerides.


Conflict of interest statement

The authors declare no conflict of interest.

Figures
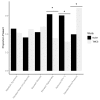
Figure 1
Figure 1
Distribution of metabolic syndrome (MetS) and individual MetS risk factors in each cohort. * indicates a significant difference at p < 0.05 between risk factor prevalence in BLSA compared to TMCS according to chi-square tests. BLSA: Baltimore Longitudinal Study of Aging; TMCS: Tsuruoka Metabolomics Cohort Study.
Figure 2
Figure 2
(a) Circos plot of overlapping significant associations in BLSA and TMCS; (b) Circos plot of significant associations unique to BLSA; (c) Circos plot of significant associations unique to TMCS. Outcomes, including MetS and individual risk factors, and metabolite classes are presented in bold and separated by black bold lines. Each color represents a different risk factor or metabolite class. BLSA: Baltimore Longitudinal Study of Aging; TMCS: Tsuruoka Metabolomics Cohort Study; AA: amino acids; BAm: biogenic amines; AC: acylcarnitines; H: hexoses; LC: lysophosphatidylcholines; PC-DA: phosphatidylcholines-diacyl; PC-AA: phosphatidylcholines-acyl-alkyl; SM: sphingomyelins; BAc: bile acids; FFA: free fatty acids; Cer: ceramides; BP: blood pressure; FG: fasting glucose; HDL-C: high-density lipoprotein cholesterol; Trig: triglycerides; WC: waist circumference; MetS: metabolic syndrome. Orange lines represent odds ratio < 1 at 0.05 FDR-adjusted significance level indicating that higher concentration of the metabolite is associated with a lower odds of the outcome. Turquoise lines represent odds ratio > 1 at 0.05 FDR-adjusted significance level indicating that higher concentration of the metabolite is associated with higher odds of the outcome.

Similar articles

Cited by

References

    1. Aguilar M., Bhuket T., Torres S., Liu B., Wong R.J. Prevalence of the metabolic syndrome in the United States, 2003–2012. JAMA. 2015;313:1973–1974. doi: 10.1001/jama.2015.4260. - DOI - PubMed
    1. Birnbaum H.G., Mattson M.E., Kashima S., Williamson T.E. Prevalence rates and costs of metabolic syndrome and associated risk factors using employees’ integrated laboratory data and health care claims. J. Occup. Environ. Med. 2011;53:27–33. doi: 10.1097/JOM.0b013e3181ff0594. - DOI - PubMed
    1. Moore J.X., Chaudhary N., Akinyemiju T. Metabolic Syndrome Prevalence by Race/Ethnicity and Sex in the United States, National Health and Nutrition Examination Survey, 1988–2012. Prev. Chronic Dis. 2017;14:E24. doi: 10.5888/pcd14.160287. - DOI - PMC - PubMed
    1. Clish C.B. Metabolomics: An emerging but powerful tool for precision medicine. Cold Spring Harb. Mol. Case Stud. 2015;1:a000588. doi: 10.1101/mcs.a000588. - DOI - PMC - PubMed
    1. Pignolo R.J. Exceptional Human Longevity. Mayo Clin. Proc. 2019;94:110–124. doi: 10.1016/j.mayocp.2018.10.005. - DOI - PubMed