

Radiogenomic-Based Survival Risk Stratification of Tumor Habitat on Gd-T1w MRI Is Associated with Biological Processes in Glioblastoma
- PMID: 32079590
- PMCID: PMC7165059
- DOI: 10.1158/1078-0432.CCR-19-2556
Radiogenomic-Based Survival Risk Stratification of Tumor Habitat on Gd-T1w MRI Is Associated with Biological Processes in Glioblastoma
Abstract
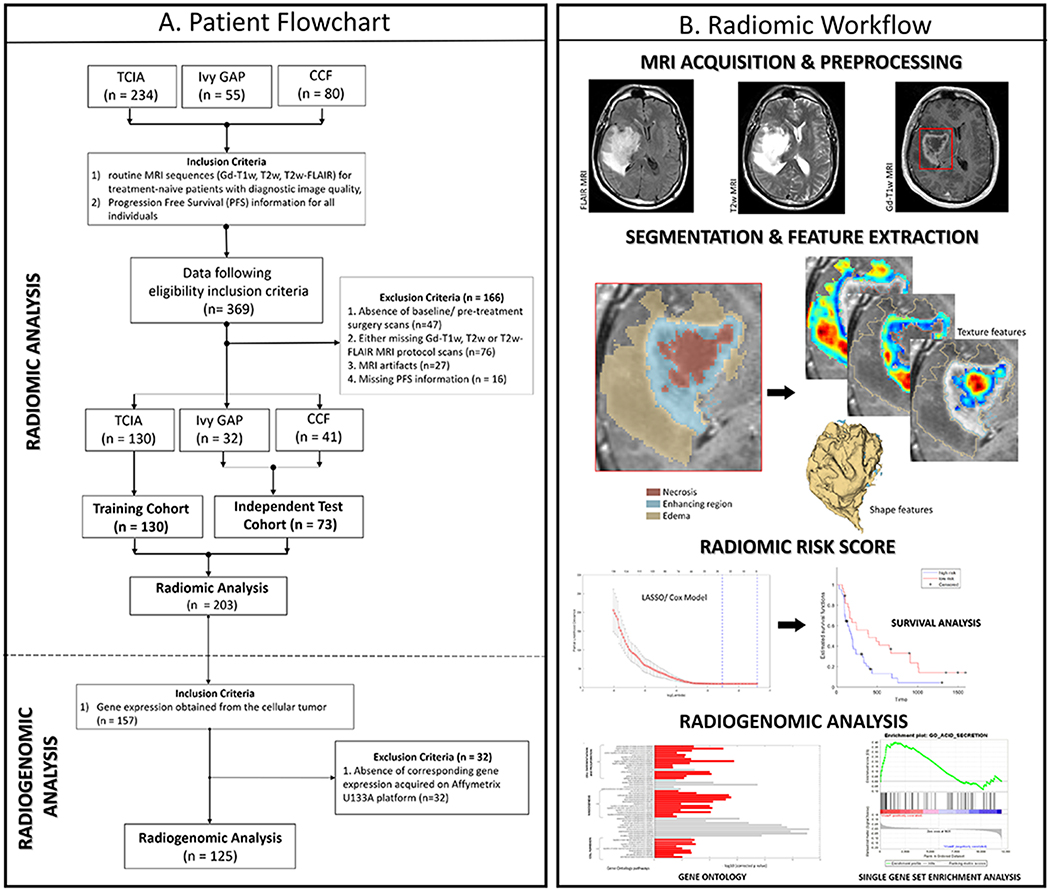
Purpose: To (i) create a survival risk score using radiomic features from the tumor habitat on routine MRI to predict progression-free survival (PFS) in glioblastoma and (ii) obtain a biological basis for these prognostic radiomic features, by studying their radiogenomic associations with molecular signaling pathways.
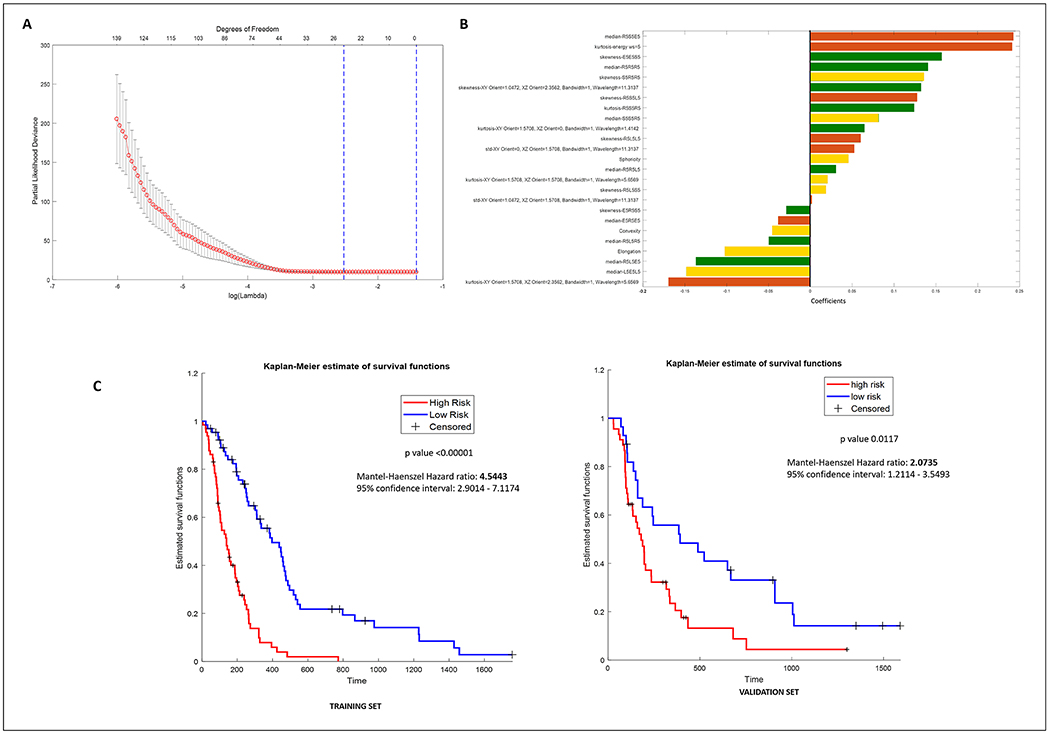
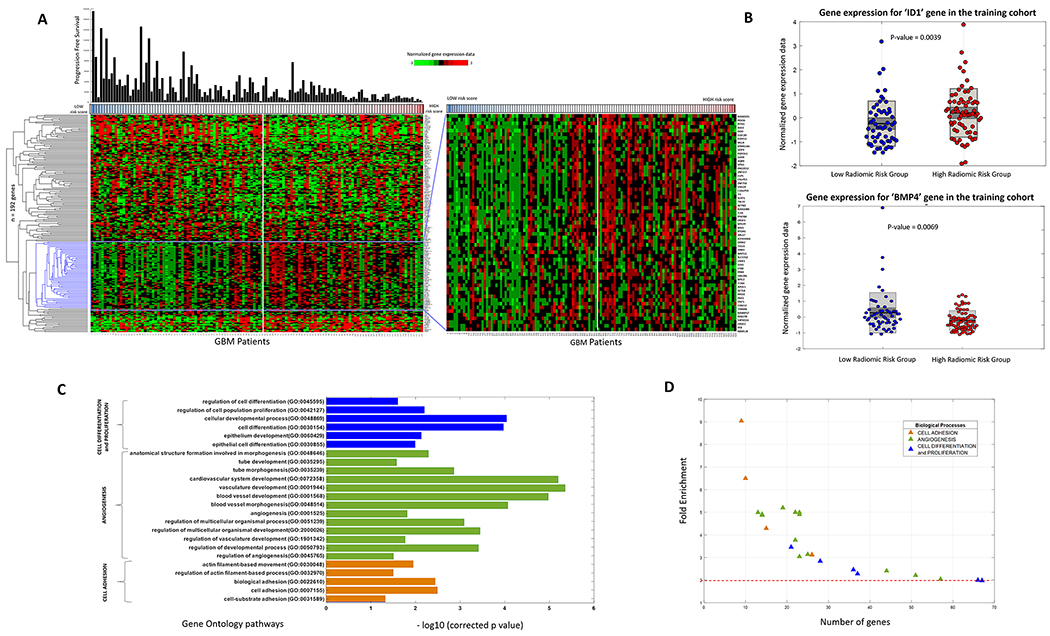
Experimental design: Two hundred three patients with pretreatment Gd-T1w, T2w, T2w-FLAIR MRI were obtained from 3 cohorts: The Cancer Imaging Archive (TCIA; n = 130), Ivy GAP (n = 32), and Cleveland Clinic (n = 41). Gene-expression profiles of corresponding patients were obtained for TCIA cohort. For every study, following expert segmentation of tumor subcompartments (necrotic core, enhancing tumor, peritumoral edema), 936 3D radiomic features were extracted from each subcompartment across all MRI protocols. Using Cox regression model, radiomic risk score (RRS) was developed for every protocol to predict PFS on the training cohort (n = 130) and evaluated on the holdout cohort (n = 73). Further, Gene Ontology and single-sample gene set enrichment analysis were used to identify specific molecular signaling pathway networks associated with RRS features.
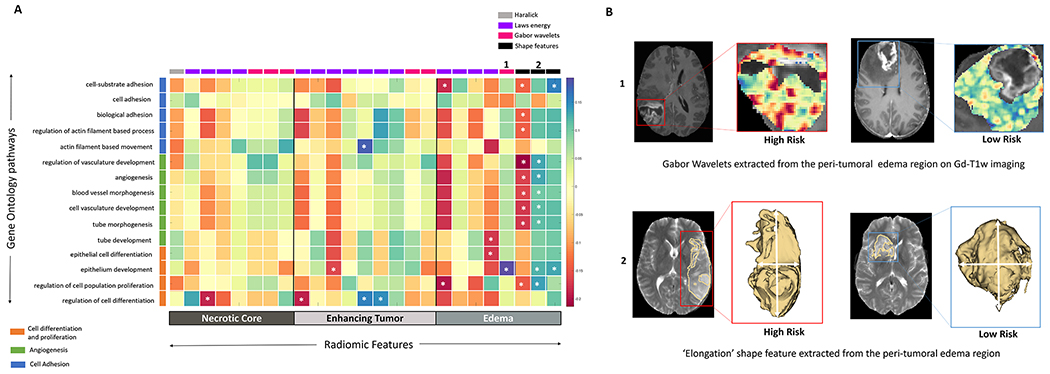
Results: Twenty-five radiomic features from the tumor habitat yielded the RRS. A combination of RRS with clinical (age and gender) and molecular features (MGMT and IDH status) resulted in a concordance index of 0.81 (P < 0.0001) on training and 0.84 (P = 0.03) on the test set. Radiogenomic analysis revealed associations of RRS features with signaling pathways for cell differentiation, cell adhesion, and angiogenesis, which contribute to chemoresistance in GBM.
Conclusions: Our findings suggest that prognostic radiomic features from routine Gd-T1w MRI may also be significantly associated with key biological processes that affect response to chemotherapy in GBM.
©2020 American Association for Cancer Research.
Figures
References
-
- Stupp R, Mason WP, van den Bent MJ, Weller M, Fisher B, Taphoorn MJB, Belanger K, Brandes AA, Marosi C, Bogdahn U, Curschmann J, Janzer RC, Ludwin SK, Gorlia T, Allgeier A, Lacombe D, Cairncross JG, Eisenhauer E, Mirimanoff RO. Radiotherapy plus Concomitant and Adjuvant Temozolomide for Glioblastoma. N Engl J Med. 2005. March 10;352(10):987–996. doi: 10.1056/NEJMoa043330 - DOI - PubMed
-
- Hu LS, Ning S, Eschbacher JM, Baxter LC, Gaw N, Ranjbar S, Plasencia J, Dueck AC, Peng S, Smith KA, Nakaji P, Karis JP, Quarles CC, Wu T, Loftus JC, Jenkins RB, Sicotte H, Kollmeyer TM, O’Neill BP, Elmquist W, Hoxworth JM, Frakes D, Sarkaria J, Swanson KR, Tran NL, Li J, Mitchell JR. Radiogenomics to characterize regional genetic heterogeneity in glioblastoma. Neuro Oncol. 2017. January;19(1):128–137. doi: 10.1093/neuonc/now135 - DOI - PMC - PubMed
Publication types
MeSH terms
Substances
Grants and funding
- R01 CA216579/CA/NCI NIH HHS/United States
- T32 CA094186/CA/NCI NIH HHS/United States
- R01 CA136535/CA/NCI NIH HHS/United States
- U24 CA199374/CA/NCI NIH HHS/United States
- I01 BX004121/BX/BLRD VA/United States
- P20 CA233216/CA/NCI NIH HHS/United States
- K25 DK115904/DK/NIDDK NIH HHS/United States
- U01 CA239055/CA/NCI NIH HHS/United States
- R01 CA220581/CA/NCI NIH HHS/United States
- R01 CA202752/CA/NCI NIH HHS/United States
- R01 CA208236/CA/NCI NIH HHS/United States
- R43 EB015199/EB/NIBIB NIH HHS/United States
- C06 RR012463/RR/NCRR NIH HHS/United States
LinkOut - more resources
Full Text Sources
Medical
Research Materials
Miscellaneous
