. 2021 Mar 1;106(3):718-729.
doi: 10.3324/haematol.2019.243626.

Immune cell constitution in the tumor microenvironment predicts the outcome in diffuse large B-cell lymphoma

Affiliations

Immune cell constitution in the tumor microenvironment predicts the outcome in diffuse large B-cell lymphoma

Matias Autio et al. Haematologica. .

Abstract

The tumor microenvironment (TME) and limited immune surveillance play important roles in lymphoma pathogenesis. Here we aimed to characterize immunological profiles of diffuse large B-cell lymphoma (DLBCL) and predict the outcome in response to immunochemotherapy. We profiled the expression of 730 immune-related genes in tumor tissues of 81 patients with DLBCL utilizing the Nanostring platform, and used multiplex immunohistochemistry to characterize T-cell phenotypes, including cytotoxic T cells (CD8, Granzyme B, OX40, Ki67), T-cell immune checkpoint (CD3, CD4, CD8, PD1, TIM3, LAG3), as well as regulatory T-cells and Th1 effector cells (CD3, CD4, FOXP3, TBET) in 188 patients. We observed a high degree of heterogeneity at the transcriptome level. Correlation matrix analysis identified gene expression signatures with highly correlating genes, the main cluster containing genes for cytolytic factors, immune checkpoint molecules, T cells and macrophages, together named a TME immune cell signature. Immunophenotyping of the distinct cell subsets revealed that a high proportion of immune checkpoint positive T cells translated to unfavorable survival. Together, our results demonstrate that the immunological profile of DLBCL TME is heterogeneous and clinically meaningful. This highlights the potential impact of T-cell immune checkpoint in regulating survival and resistance to immunochemotherapy. (Registered at clinicaltrials.gov identifiers: NCT01502982 and NCT01325194.)


Figures

Figure 1.
Figure 1.
Digital multiplexed gene expression profiling analysis reveals distinct gene expression signatures in diffuse large B-cell lymphoma (DLBCL). The expression of PanCancer Immune Profiling panel genes was assayed by Nanostring nCounter from 81 DLBCL samples. Correlation matrix analysis was performed for the most variable genes (standard deviation >1.0; n=335). Signatures with highly correlating genes are depicted in the heatmap. Selected genes are highlighted in the right-hand panel. ECM: extracellular matrix; TME: tumor microenvironment;
Figure 2.
Figure 2.
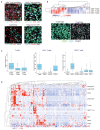
Multiplex immunohistochemistry (mIHC) reveals significant heterogeneity in the diffuse large B-cell lymphoma (DLBCL) tumor microenvironment (TME). (A) Representative images from the 4-plex mIHC analyses performed on tissue microarrays (TMA) from the Helsinki diffuse large B-cell lymphoma study (HEL-DLBCL) group cohort. CD8+ T-cell immune checkpoints: CD8=cyan, TIM3=red, LAG3=blue, PD1=green, DAPI=gray. CD4+ T-cell immune checkpoints: CD3=green, CD4=cyan, TIM3=red, LAG3=blue, DAPI=gray. Cytotoxicity panel: CD8=cyan, Granzyme B=green, Ki67=red, OX40=blue, DAPI=gray. Regulatory T cells (Tregs) and Th1 panel: CD3=green, CD4=cyan, FOXP3=red, TBET=blue, DAPI=gray. Scale bar 10 μm. (B) Unsupervised hierarchical clustering based on the expression of CD3+, CD4+ and CD8+ T cells. (C) Proportions of distinct immune cells from all cells, from CD4+ T cells and from CD8+ cells. (D) Heatmap visualizing all quantified immune cells and their immunophenotypes organized by unsupervised hierarchical clustering. Full annotation with all phenotypes is provided in the Online Supplementary Figure S3.
Figure 3.
Figure 3.
Diffuse large B-cell lymphoma (DLBCL) can be dived into T-cell high and low phenotypes. In silico immunophenotyping with CIBERSORTx was used to deconvolute T-cell proportions based on gene expression in four publicly available datasets.6-8,28 Gene expression datasets were uploaded to the CIBERSORTx web portal and the algorithm run using the 547-gene Leukocyte gene signature matrix (LM22) at 100 permutations. T-cell data were z-score transformed and visualized by unsupervised hierarchical clustering.
Figure 4.
Figure 4.
Membranous expression of HLA-ABC and β2 microglobulin (B2M) correlates with increased T-cell infiltration. (A) Representative images from B2M, HLAABC, and HLA-DR immunohistochemical (IHC) stainings. Scale bar 10 mm. (B) Results of the B2M, HLA-ABC, and HLA-DR IHC scoring. (C and D) Box plots visualizing the association of CD3+ T cells with HLA-ABC (C) and B2M (D) scores. P-values were determined by Kruskall-Wallis H (C) and Mann-Whitney U tests (D).
Figure 5.
Figure 5.
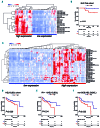
A high proportion of T cells expressing immune checkpoint molecules in the tumor microenvironment (TME) correlates with worse outcome in patients with diffuse large B-cell lymphoma (DLBCL). (A) The multiplex immunohistochemistry (mIHC) data from the Nordic Lymphoma Group (NLG) Trial cohort was clustered according to the proportions of TIM3+ T cells and LAG3 expressing CD8+ T cells. (B) Kaplan-Meier (log-rank test) survival plots depict overall survival (OS) in months (mo) in the groups with high and low amounts of these immune checkpoint molecule-expressing T cells in the NLG Trial cohort. (C) Unsupervised hierarchical clustering of T cells expressing immune checkpoint molecules in the Helsinki diffuse large B-cell lymphoma (HEL-DLBCL) cohort. (D) Kaplan-Meier (log-rank test) survival plots depict OS in the groups with high and low amounts of T cells expressing TIM3, LAG3 and PD1 in the HEL-DLBCL cohort. (E and F) Kaplan-Meier (log-rank test) survival plots depict OS in the groups with a high and low expression of immune checkpoint molecules in patients with an International Prognostic Index (IPI) score over 1 (E) and in patients with non-GCB type DLBCL (F) in the HEL-DLBCL cohort. N=46 for (A and B) and N=119 for (C-F). (Samples having tissue microarrays spots with poor quality for any of the phenotypes were removed from the clustering and survival analyses).
Figure 6.
Figure 6.
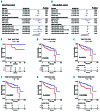
The impact of immune checkpoint molecules and distinct T-cell subtypes on survival. (A and B) Forest plots visualizing the impact of T cells and their immunophenotypes on overall survival (OS) in months (mo) in the Nordic Lymphoma Group (NLG) Trial (A) and Helsinki diffuse large B-cell lymphoma study (HELDLBCL) (B) cohorts, as evaluated using Cox univariate tests with continuous variables. (C-H) Kaplan-Meier plots (log-rank test) visualizing survival associations of distinct TIM3+ cell subpopulations. Cut-off was set at the highest expressing one-third versus the lowest expressing two-thirds.

References

    1. Coiffier B, Lepage E, Briere J, et al. . CHOP chemotherapy plus rituximab compared with CHOP alone in elderly patients with diffuse large-B-cell lymphoma. N Engl J Med. 2002;346(4):235-242. - PubMed
    1. Pfreundschuh M, Trumper L, Osterborg A, et al. . CHOP-like chemotherapy plus rituximab versus CHOP-like chemotherapy alone in young patients with good-prognosis diffuse large-B-cell lymphoma: a randomised controlled trial by the MabThera International Trial (MInT) Group. Lancet Oncol. 2006;7(5):379-391. - PubMed
    1. Alizadeh AA, Eisen MB, Davis RE, et al. . Distinct types of diffuse large B-cell lymphoma identified by gene expression profiling. Nature. 2000;403(6769):503-511. - PubMed
    1. Rosenwald A, Wright G, Chan WC, et al. . The use of molecular profiling to predict survival after chemotherapy for diffuse large-Bcell lymphoma. N Engl J Med. 2002;346(25):1937-1947. - PubMed
    1. Lenz G, Wright G, Dave SS, et al. . Stromal gene signatures in large-B-cell lymphomas. N Engl J Med. 2008;359(22):2313-2323. - PMC - PubMed

Publication types

MeSH terms

Associated data