. 2021 Mar 1;106(3):782-794.
doi: 10.3324/haematol.2019.245092.

Iron deficiency-induced thrombocytosis increases thrombotic tendency in rats

Affiliations

Iron deficiency-induced thrombocytosis increases thrombotic tendency in rats

Kristine Jimenez et al. Haematologica. .

Abstract

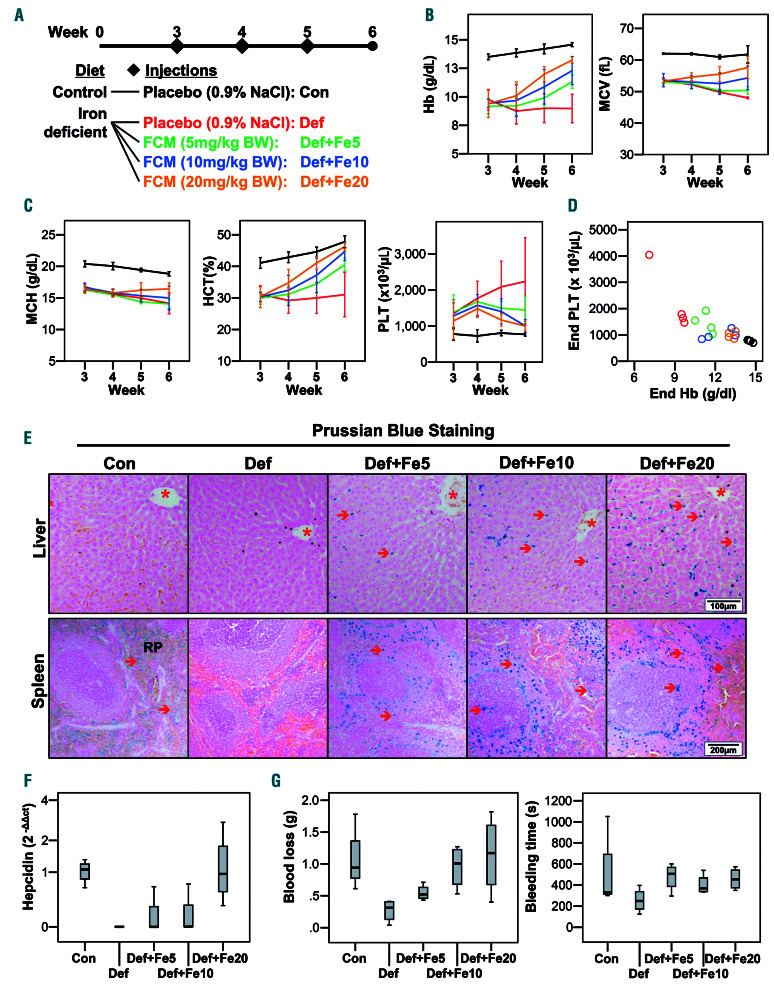
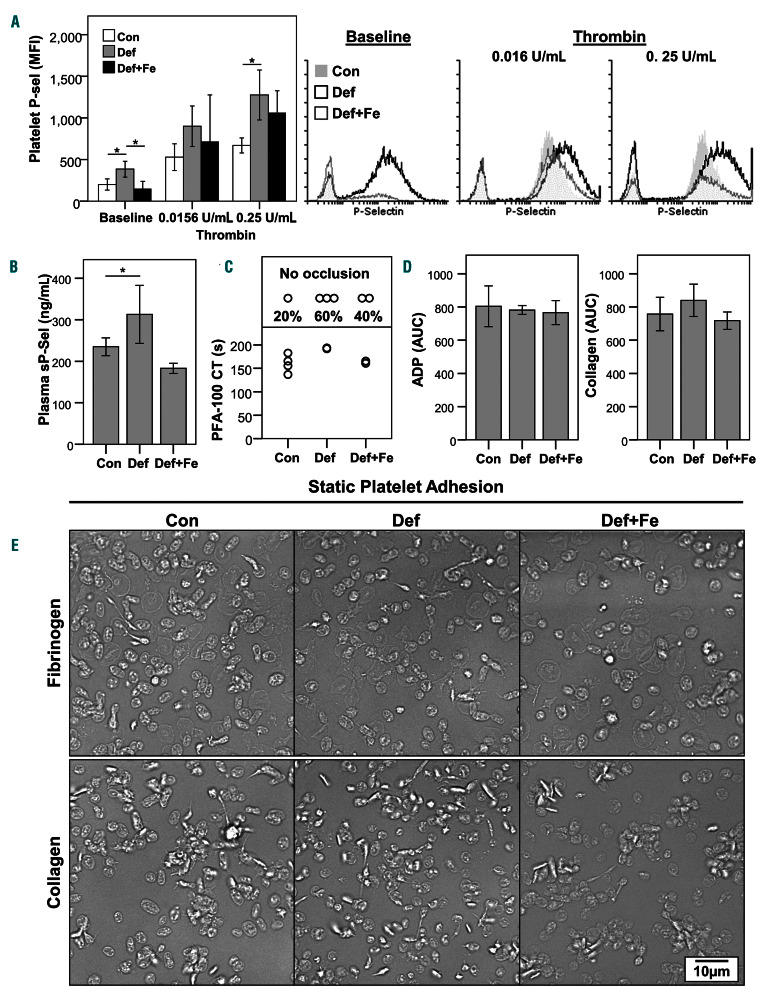
Iron deficiency (ID) is globally prevalent, and apart from anemia is associated with thrombocytosis. While considered benign, studies linking thrombotic events with prior ID anemia suggest otherwise. Herein we used animal models to assess the influence of ID on thrombotic tendency. Sprague-Dawley rats were fed control or iron deficient diets and ferric carboxymaltose was used to reverse ID. Thrombosis was induced via stenosis of the inferior vena cava or damage to the right carotid artery using ferric chloride. Thrombi were evaluated histologically and via high frequency ultrasound in the venous model. ID consistently induced thrombocytosis alongside anemia. Venous thrombus growth and final dimensions in both arterial and venous thrombi were largest in ID. In both models, platelet numbers correlated with the final thrombus size, with ID thrombi having the largest platelet areas. Platelet function was also evaluated in surgically naive rats. Coagulability on thromboelastography and hemostasis on tail transection were augmented in ID. Platelet and plasma P-selectin expression were both higher in ID. Platelet adhesion and aggregation in ID was impaired under shear flow but was intact on static assays. Iron replacement therapy reversed all ID-related changes in hematological parameters, thrombus dimensions, and platelet assays. In summary, ID alone increases thrombotic tendency. Iron replacement therapy reverses these changes, making it a viable strategy for prevention of ID-related thrombotic disease. This may be of importance in patients with chronic illnesses which may already be at increased risk for thrombosis such as inflammatory bowel disease, chronic kidney disease, or cancer.


Figures

Figure 1.
Figure 1.
Iron deficiency causes thrombocytosis, which is reversed by iron replacement therapy in a dose-dependent fashion. (A) Experimental design. Rats were fed an iron-deficient diet (Def) for 6 weeks, and given three injections of ferric carboxymaltose at the doses of 5, 10, or 20 mg/kg body weight (BW, +Fe5, +Fe10, +Fe20, respectively) or placebo (4 mL/kg BW 0.9% NaCl). Animals fed a control diet and given injections of placebo formed the control group (Con). Hematologic parameters were measured weekly from 3 to 6 weeks after the start of the experiment (n=4 per group). (B). Changes in hemoglobin and mean corpuscular volume from 3 to 6 weeks in the different groups of animals. (C) Values of mean corpuscular hemoglobin, hematocrit and platelet count over the course of the experiment. (D) Platelet counts versus hemoglobin concentration at 6 weeks. (E) Representative images of liver and spleen histological staining for iron (Prussian blue stain). Red arrows mark positively stained cells. Red asterisks (*) mark central veins. (F) Relative expression of hepcidin as determined by real-time quantitative polymerase chain reaction analysis of liver isolates. Values are normalized to those in Con animals, with Hprt1 as the endogenous control. (n=3-4 per group). (G) Blood loss and bleeding time measured during the tail bleeding assay (n=3-4 per group). Error bars: mean ± standard deviation. FCM: ferric carboxymaltose, Hb: hemoglobin, MCV: mean corpuscular volume, MCH: mean corpuscular hemoglobin, HCT: hematocrit, PLT: platelet count
Figure 2.
Figure 2.
Iron deficiency augments venous thrombotic tendency. In experiment 1, venous thrombosis was induced by stenosis of the inferior vena cava after animals had been on an iron-deficient diet (Def) for 7 weeks. A control group (Con) was fed a normal diet. (A-D) Hematologic parameters measured prior to surgery (n=7 per group); hemoglobin (A), mean corpuscular volume (B), hematocrit (C) and platelet count (D). (E) Representative three-dimensional images reconstructed from high frequency ultrasound scans at 3 and 4 h after ligation; and corresponding Carstairs staining of thrombi collected post-mortem. (F, G) Thrombus volume at 3 and 4 h after ligation (F) and the change in volume over time (G) (n=5 per group, error bars: mean ± standard deviation [SD]). (H) Final thrombus volume at 4 h (n=6-7 per group). (I, J) Thrombus length at 3 and 4 h after ligation (I) and the change in length over time (J) (n=5 per group, error bars: mean ± SD). (K) Final thrombus length at 4 h (n=6-7 per group). (L) Thrombus area measured on longitudinal histological sections (n=9 per group). (M) Comparison of thrombus area measured histologically (Histo) and ultrasound (US) volume. (N) Thrombus length measured on longitudinal histological sections (n=9 per group). (O) Comparison of thrombus length measured histologically and by US. *P<0.05, **P<0.01, ***P<0.001. Error bars: mean ± SD. Hb: hemoglobin, MCV: mean corpuscular volume, HCT: hematocrit, PLT: platelet count.
Figure 3.
Figure 3.
Iron replacement therapy reverses iron deficiency-induced increased venous thrombotic tendency. (A) Design of experiment 2. Rats were fed an iron-deficient diet (Def) for 7 weeks. and given three injections of ferric carboxymaltose (FCM) at the doses of 5, 10, or 20 mg/kg body weight (BW, +Fe5, +Fe10, +Fe20, respectively) or placebo (0.9% NaCl). Animals fed a control diet and given injections of placebo formed the control group (Con). Venous thrombosis was induced after hematologic parameters had been measured. (B-E) Hematologic parameters measured prior to surgery (n=4 per group): hemoglobin (B), mean corpuscular volume (C), hematocrit (D) and platelet count (E). (F) Representative images of Carstairs-stained sections of thrombi. (G) Thrombus area measured on longitudinal sections (n=4-5 per group). (H) Thrombus area versus platelet counts of both experiments, when both measurements were available (n=3-5 per group). *P<0.05, **P<0.01, ***P<0.001. Error bars: mean ± standard deviation. Hb: hemoglobin; MCV: mean corpuscular volume; HCT: hematocrit, PLT: platelet count.
Figure 4.
Figure 4.
Platelet area of venous thrombi is larger in iron deficiency. (A) Carstairs staining correlated with ITGA2B immunohistochemical staining for venous thrombi. Bone marrow was used as a positive control for ITGA2B. (B) Representative images of ITGA2B staining of venous thrombi. (C) Area of thrombus staining positive for ITGA2B. Experiment 1: n=9, Experiment 2: n=4-5 per group. (D) ITGA2B-positive area versus platelet count of both experiments, when both measurements were available (n=3-5 per group) ***P<0.001. Error bars: mean ± standard deviation. PLT: platelet count. Con: animals fed a normal diet and given placebo injections; Def: animals fed an iron-deficient diet; Def+Fe: animals fed an iron-deficient diet and then given injections of ferric carboxymaltose.
Figure 5.
Figure 5.
Iron deficiency enhances arterial thrombotic tendency. Arterial thrombosis was induced in animals fed an iron-deficient diet for 7 weeks and given three injections of ferric carboxymaltose at a dose of 20 mg/kg body weight or placebo (0.9% NaCl). (A) Hemoglobin concentration and platelet counts prior to surgery (n=9-11 per group). (B) Thrombus area and length measured on Carstairs-stained longitudinal sections of thrombi (n=5-7 per group). (C) Representative images of Carstairs-stained arterial thrombi. (D) Thrombus area versus platelet count (n=5-7 per group). (E) Time until cessation of carotid blood flow due to thrombus development (n=9-11 per group). (F) Area of thrombus staining positive for ITGA2B (n=5 per group). (G) ITGA2B-positive area versus platelet count (n=5 per group). (H) Representative images of ITGA2B staining of arterial thrombi. *P<0.05, **P<0.01, ***P<0.001. Error bars: mean ± standard deviation. Hb: hemoglobin; PLT: platelet count. Con: animals fed a normal diet and given placebo injections; Def: animals fed an iron-deficient diet; Def+Fe: animals fed an iron-deficient diet and then given injections of ferric carboxymaltose.
Figure 6.
Figure 6.
Iron deficiency augments clot dynamics. Animals were fed an irondeficient diet for 7 weeks and given three injections of ferric carboxymaltose at a dose of 20 mg/kg body weight or placebo (0.9% NaCl). (A, B) Hemoglobin (A) and platelet counts (B) at the end of the experiment (n=5 per group). (C-F) Thromboelastography measurements of clot strength (C), maximum rate of thrombus generation (D), time to clot initiation (E), and coagulation Index (F) (n=4-5 per group). P<0.05, ** P<0.01, ***P<0.001. Error bars: mean ± standard deviation. Con: animals fed a normal diet and given placebo injections; Def: animals fed an iron-deficient diet; Def+Fe: animals fed an iron-deficient diet and then given injections of ferric carboxymaltose; Hb: hemoglobin; PLT: platelet count; G: clot strength; MRTG: maximum rate of thrombus generation; R: time to clot initiation. .
Figure 7.
Figure 7.
Iron deficiency increases the expression of P-selectin, without altering platelet aggregability or static adhesion. (A) Mean fluorescence intensity of P-selection expression on platelets before and after stimulation with thrombin (0.0156 U/mL, 0.25 U/mL). Error bars: mean ± standard deviation (SD) (n=4 per group). Representative histograms show the population shift. (B) Plasma P-selectin concentration determined by enzyme-linked immunosorbent assay (n=4 per group). (C) Platelet Function Analyzer closure time, a measurement of platelet adhesion under shear flow (n=5 per group), depicted as seconds until occlusion, or no occlusion. (D) Area under the curve measured from Multiplate whole blood impedance aggregometry after stimulation with ADP or collagen (n=4-5 per group). (E) Representative images of washed platelets adhering to a fibrinogen- or collagen-coated surface. *P<0.05. Error bars: mean ± SD. P-sel: P-selectin; MFI: mean fluorescent intensity; sP-sel: soluble P-selectin; PFA-100 CT: Platelet Function Analyzer 100 closure time; AUC: area under the curve; Con: animals fed a normal diet and given placebo injections; Def: animals fed an iron-deficient diet; Def+Fe: animals fed an iron-deficient diet and then given injections of ferric carboxymaltose.

Comment in

References

    1. Camaschella C. Iron deficiency. Blood. 2019;133(1):30-39. - PubMed
    1. Evstatiev R, Gasche C. Iron sensing and signalling. Gut. 2012;61(6):933-952. - PubMed
    1. von Haehling S, Jankowska EA, van Veldhuisen DJ, Ponikowski P, Anker SD. Iron deficiency and cardiovascular disease. Nat Rev Cardiol. 2015;12(11):659-669. - PubMed
    1. Dan K. Thrombocytosis in iron deficiency anemia. Intern Med. 2005;44(10):1025-1026. - PubMed
    1. Keung YK, Owen J. Iron deficiency and thrombosis: literature review. Clin Appl Thromb Hemost. 2004;10(4):387-391. - PubMed

Publication types