. 2020 Mar 10;117(10):5463-5471.
doi: 10.1073/pnas.1913444117. Epub 2020 Feb 20.

The fibroblast-derived protein PI16 controls neuropathic pain

Affiliations

The fibroblast-derived protein PI16 controls neuropathic pain

Pooja Singhmar et al. Proc Natl Acad Sci U S A. .

Abstract

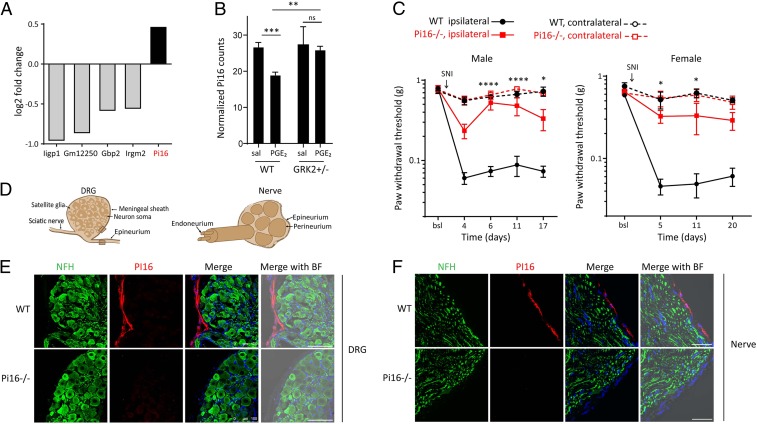
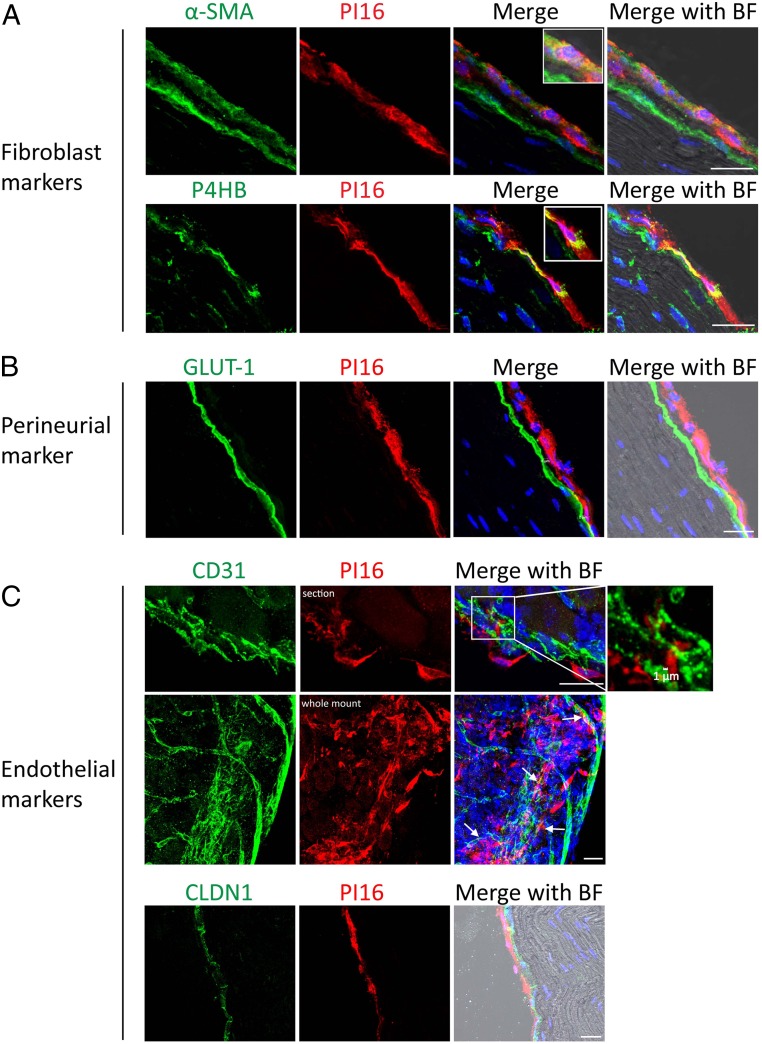
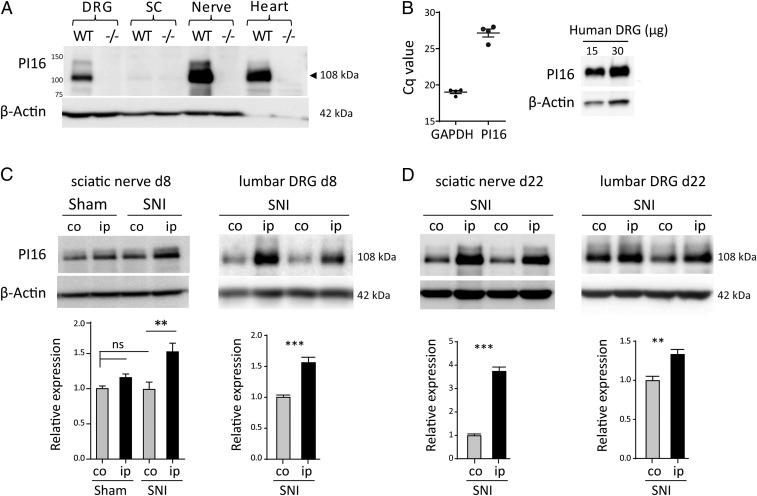
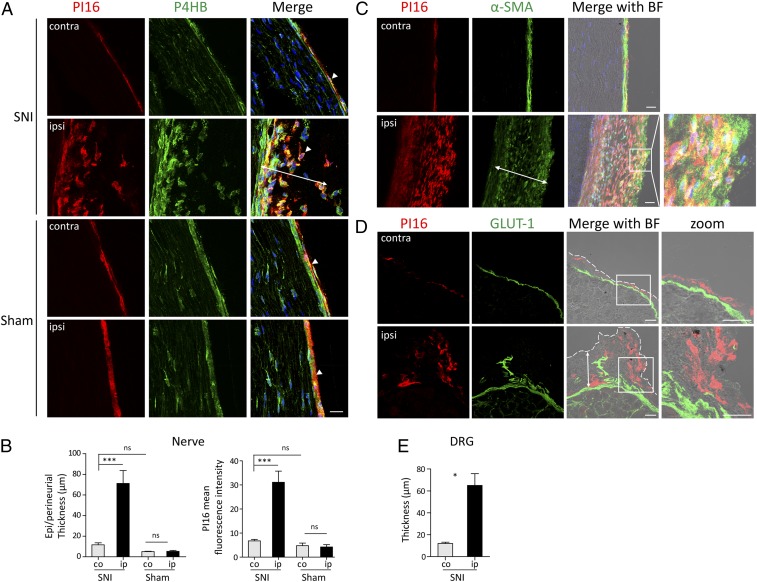
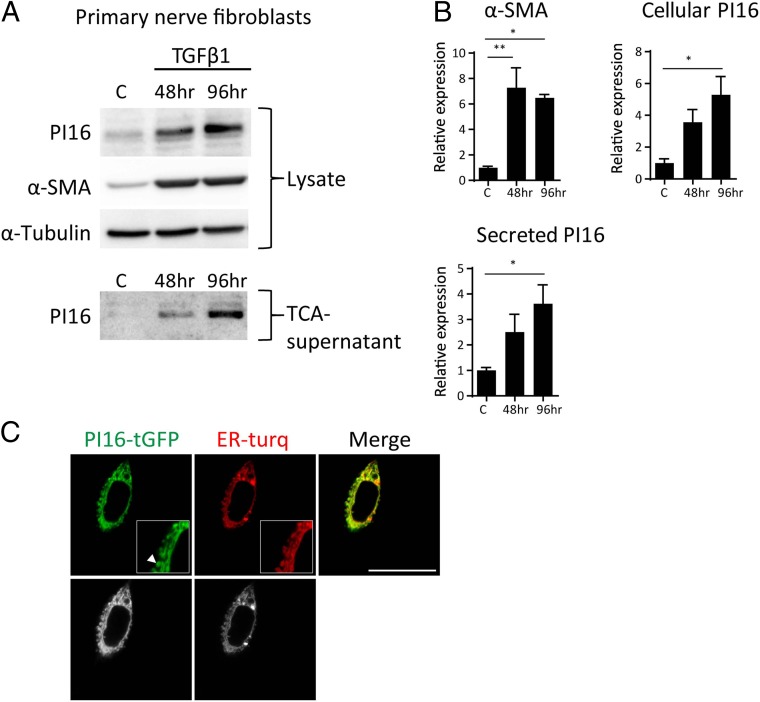
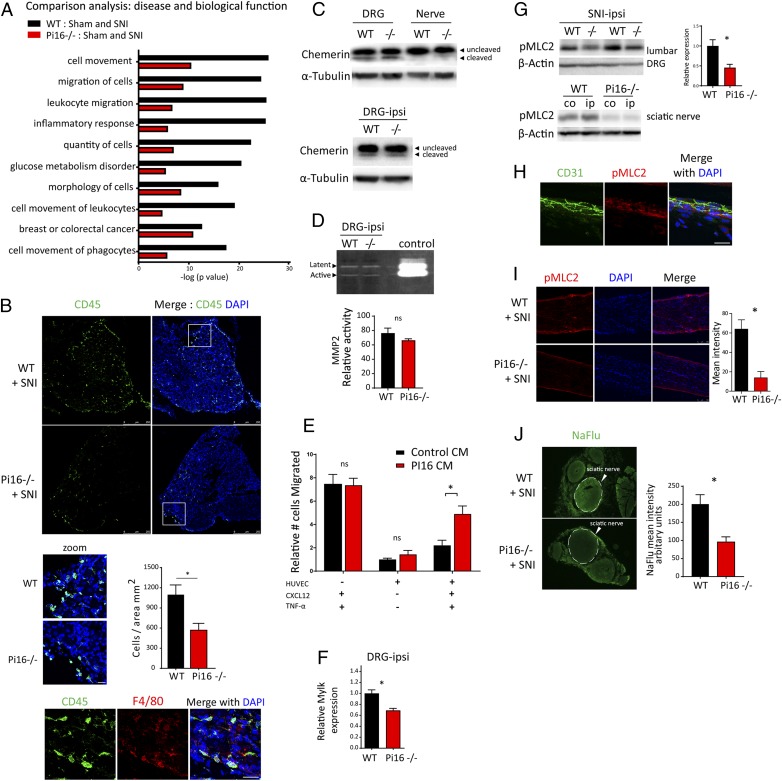
Chronic pain is a major clinical problem of which the mechanisms are incompletely understood. Here, we describe the concept that PI16, a protein of unknown function mainly produced by fibroblasts, controls neuropathic pain. The spared nerve injury (SNI) model of neuropathic pain increases PI16 protein levels in fibroblasts in dorsal root ganglia (DRG) meninges and in the epi/perineurium of the sciatic nerve. We did not detect PI16 expression in neurons or glia in spinal cord, DRG, and nerve. Mice deficient in PI16 are protected against neuropathic pain. In vitro, PI16 promotes transendothelial leukocyte migration. In vivo, Pi16-/- mice show reduced endothelial barrier permeability, lower leukocyte infiltration and reduced activation of the endothelial barrier regulator MLCK, and reduced phosphorylation of its substrate MLC2 in response to SNI. In summary, our findings support a model in which PI16 promotes neuropathic pain by mediating a cross-talk between fibroblasts and the endothelial barrier leading to barrier opening, cellular influx, and increased pain. Its key role in neuropathic pain and its limited cellular and tissue distribution makes PI16 an attractive target for pain management.

Keywords: PI16; Peptidase inhibitor 16; fibroblasts; neuropathic pain; perineurium.


Conflict of interest statement

The authors declare no competing interest.

Figures

Fig. 1.
Fig. 1.
Identification of Pi16 as a gene associated with pain and PI16 is localized in the meninges of DRG and the epi/perineurium. (A) Differentially expressed genes as identified by RNA-seq analysis of lumbar DRGs from female WT (n = 3) and Grk2+/− (n = 3) mice collected 5 h after PGE2 treatment (100 ng per paw). Fold change is based on counts per million reads adjusted for multiple testing error (false discovery rate < 0.05) (also see SI Appendix, Fig. S1). (B) Expression of Pi16 mRNA in lumbar DRGs of saline (sal) and PGE2-treated female WT (n = 3) and Grk2+/− (n = 3) mice 5 h after PGE2 treatment as assessed by RNA-seq analysis. Data represent normalized log counts per million reads. ***P < 0.001; **P < 0.01; ns, not significant; two-way ANOVA followed by Bonferroni analysis. (C) SNI was performed on male WT (n = 6) and Pi16−/− (n = 4), and, female WT (n = 4) and Pi16−/− (n = 5) mice and mechanical allodynia was assessed using von Frey hairs in ipsilateral and contralateral hind paw at baseline (bsl) and over time after SNI. Two-way repeated-measures ANOVA: Male mice-time: P < 0.0001; genotype: P < 0.001; interaction: P < 0.001. Female mice-time: P < 0.0001; genotype: P < 0.001; interaction: P < 0.045. Post hoc Bonferroni analysis: *P < 0.05, ****P < 0.0001 for Pi16−/− vs. WT ipsilateral. (D) Schematic of DRG and sciatic nerve containing neuronal soma, glia, and blood vessels. The DRG is enclosed by a meningeal sheath. The epineurium surrounds the entire nerve and is present between the nerve fascicles. The perineurium surrounds the fascicles and the endoneurium surrounds the axons. Shaded box represents region where images were captured. (E) Representative lumbar DRG section from naïve WT and Pi16−/− mice stained for the neuronal marker NFH and PI16. (F) Representative sciatic nerve sections from WT and Pi16−/− mice stained for NFH and PI16. Right-most in E and F: Bright field (BF) image merged with green (NFH), red (PI16), and DAPI (blue). Images in E and F are representative of n = 4 mice per group, and additional examples are shown in SI Appendix, Fig. S4. (Scale bar, 100 µm.)
Fig. 2.
Fig. 2.
PI16 is detected in fibroblasts in the meninges of the DRG and the epi/perineurium. Representative sciatic nerve section from naïve WT mice showing immunostaining of PI16 (red) with fibroblast markers α-SMA and P4HB (A), perineurial marker GLUT-1 (B), endothelial markers CD31 and CLDN1 (C). (Top) PI16-positive fibroblasts and endothelial cells are within 1 µm distance (indicated by arrows). (Middle) Staining of whole-mount DRG. Bright field (BF) image merged with other channels is shown. (Scale bar, 25 µm.) Images are representative of n = 4 for A and n = 3 for B and C mice per group. Additional examples are shown in SI Appendix, Fig. S5.
Fig. 3.
Fig. 3.
SNI up-regulates PI16 protein levels in DRG and sciatic nerve. (A) Western blot analysis of PI16 in DRG, spinal cord, nerve, and heart tissue from male WT and Pi16−/− mice. PI16 is mainly expressed as a 108-kDa protein that is not present in samples from Pi16−/− mice confirming antibody specificity. (B, Left) qRT-PCR analysis of PI16 mRNA in three human DRG samples normalized for GAPDH. (B, Right) Western blot analysis of PI16 protein in a human DRG. (C) Western blot analysis of PI16 protein expression in contralateral (co) and ipsilateral (ip) sciatic nerve (from male mice) and lumbar DRG (from female mice) at 8 d after SNI or sham surgery. For DRG, representative blot shows PI16 expression in two animals per group. Bar graphs represent means ± SEM of n = 4 mice per group for sciatic nerve (ANOVA test, **P < 0.01; ns, not significant) and n = 6 mice per group for DRG (Student’s t test, ***P < 0.001). (D) Western blot analysis of PI16 protein expression in sciatic nerve and lumbar DRG at 22 d (from n = 6 male mice per group) after SNI surgery (Student’s t test, ***P < 0.001, **P < 0.01).
Fig. 4.
Fig. 4.
SNI-induced increase in fibroblast Pi16 levels. (A) Representative images showing PI16 (red) and P4HB (green) staining in contralateral (contra) and ipsilateral (ipsi) sciatic nerve after SNI and sham surgery. Note PI16 in P4HB-positive fibroblasts (arrowheads). Note expansion of P4HB positive fibroblasts in the epi/perineurium coexpressing PI16 specifically in the SNI-ipsilateral nerve. (B) Quantitation of epi/perineurium thickness (double headed arrows in A and C) and PI16 mean intensity in contralateral (co) and ipsilateral (ip) side after Sham and SNI surgery is shown. One way-ANOVA test: ***P < 0.001; ns, not significant. n = 4–9 male mice per group. (C) Representative image showing PI16 (red) in α-SMA (green) positive fibroblast in sciatic nerve after SNI. Note expansion of α-SMA–positive fibroblasts coexpressing PI16 in the ipsilateral nerve. BF (bright field) image merged with PI16, α-SMA, and DAPI (blue) is shown. (D) Representative image of PI16 (red) and GLUT-1 (green) staining in lumbar DRG contralateral (contra) and ipsilateral (ipsi) to SNI surgery. BF image merged with PI16 and GLUT-1 is shown. The zoom images show a magnified view of the area outlined by the square. Perineurial GLUT-1 (green) staining marks the border of DRG, and the dotted white line marks the edge of the meningeal sheath. Note the PI16 staining in the meningeal sheath and increased PI16 outside GLUT-1 (double headed arrow) in the meninges of ipsilateral DRGs. (E) Quantitation of meningeal thickness (double headed arrows in D) in lumbar DRG after SNI. Meningeal sheath outside GLUT-1 (which labels inner layer of the perineurium) was measured. t test: *P < 0.05. Immunofluorescence data are representative of n = 3 mice for contralateral and n = 5 for ipsilateral. (Scale bar, 25 µm.)
Fig. 5.
Fig. 5.
Pi16 is secreted by myofibroblasts in vitro. (A) Mouse fibroblasts (postnatal day 8) cultured from sciatic nerve were serum starved for 24 h and treated with TGF-β1 (5 ng/mL) for 48 h or 96 h followed by Western blot analysis of total cell lysate or TCA precipitated culture supernatant. Representative Western blots are shown from three independent culture experiments. α-SMA was used as a myofibroblast marker and α-Tubulin was loading control. (B) Quantification of PI16 and α-SMA for B. Bar graph depicts means ± SEM of at least three independent experiments. *P < 0.05; **P < 0.01 (analyzed using t test). (C) Live imaging of mouse fibroblasts (L cells) transfected with mTurquoise2 (endoplasmic reticulum marker, ER-turq) and PI16 tagged with turbo-GFP (data represent images from 10 cells, three independent experiments). Raw black and white images are shown in Lower. Note PI16 staining in endoplasmic reticulum vesicles and tubules (arrowhead) in the magnified view in the white box. (Scale bar, 25 µm.)
Fig. 6.
Fig. 6.
Pi16 deficiency prevents the SNI-induced infiltration of leukocyte into the DRG and nerve. (A) IPA-based top 10 disease biological functions different in lumbar DRG from female WT and Pi16−/− mice post-SNI (day 9; n = 3 per group). IPA core analysis was performed between WT (WT-Sham and WT-SNI) and Pi16−/− groups (Pi16−/− Sham and Pi16−/− SNI) followed by comparison of the two core analyses. Black bars show change between WT-Sham and WT-SNI. Red bars show change between Pi16-Sham and Pi16-SNI. y axis denotes −log (P value). (−0.5 < log2 fold change < 0.5), P < 0.05. (B) Representative image of lumbar DRG ipsilateral to SNI showing immunostaining of leukocyte marker CD45 (green) and DAPI (blue) in female WT and Pi16−/− (n = 4) mice on SNI day 5 (Upper). The zoom panel shows a magnified view of the white box, and the bar graph shows quantitation data for CD45 staining from n = 4 mice per group. The cells were counted using Leica LAS software. t test: *P < 0.05. (Lower) Shows staining of CD45 (green), macrophage marker F4/80 (red), and DAPI (blue). (C) Western blot analysis of chemerin protein in naïve lumbar DRG and sciatic nerve of WT and Pi16−/− male mice (Upper) and in DRG from ipsilateral side after SNI in WT and Pi16−/− male mice (Lower). (D) Gelatin zymography for MMP-2 activity in the lumbar DRG of SNI WT and Pi16−/− mice. Bar graph shows quantitation data from n = 3 male mice per group. t test: ns, not significant. (E) Effect of conditioned medium of PI16-overexpressing fibroblasts on monocyte migration across a TNF-α–activated endothelial cell monolayer in response to CXCL12 in the lower chamber either in control or PI16 conditioned medium (CM). Number of monocytes that migrated to the lower chamber are plotted; relative to those of HUVEC (+) without activation (-TNF-α) and without chemoattractant (-CXCL12), n = 3 samples per group; *P < 0.05, two-way ANOVA, Tukey’s multiple comparisons test. ns, not significant. (F) Real-time PCR analysis of Mylk expression in lumbar DRGs of female WT and Pi16−/− mice. n = 3 per group. **P < 0.01 (analyzed using t test). (G, Upper Left) Western blot analysis of pMLC2 expression in ipsilateral lumbar DRGs after SNI. Blot showspMLC2 levels in two separate male WT and Pi16−/− mice, and bar graph shows quantitation data (n = 5 male mice per group). (G, Lower Right) Western blot analysis of pMLC2 level in sciatic nerve after SNI from contralateral (co) and ipsilateral (ip) side in WT and Pi16−/− mice. β-Actin was used as a loading control. Bar graph represents mean fluorescent intensity for pMLC2 as determined from 3 female mice per group. t test: *P < 0.05. (H) Representative images showing immunostaining of pMLC2 (red), DAPI (blue), and CD31 (green) in sciatic nerve longitudinal section in WT naïve mice (n = 3). (I) Representative images showing immunostaining of pMLC2 (red) and DAPI (blue) in sciatic nerve longitudinal section from ipsilateral and contralateral side after SNI (day 5 after SNI; n = 3 female mice). Bar graph represents mean fluorescence intensity for pMLC2. t test: *P < 0.05. (J) Representative fluorescent image of NaFlu extravasation in sciatic nerve cross-section. Male WT and Pi16−/− mice received 40 mg/kg NaFlu intravenously, and nerves were harvested 1 h later. Bar graph represents mean fluorescent intensity for NaFlu in the sciatic nerve (circle with dotted line) as determined from 3 mice per group. t test: *P < 0.05. (Scale bar, 25 µm.)

References

    1. Simon L. S., Relieving pain in America: A blueprint for transforming prevention, care, education, and research. J. Pain Palliat. Care Pharmacother. 26, 197–198 (2012).
    1. Gaskin D. J., Richard P., The economic costs of pain in the United States. J. Pain: Official J. Am. Pain Soc. 13, 715–724 (2012). - PubMed
    1. Eijkelkamp N., et al. , Low nociceptor GRK2 prolongs prostaglandin E2 hyperalgesia via biased cAMP signaling to Epac/Rap1, protein kinase Cepsilon, and MEK/ERK. J. Neurosci. 30, 12806–12815 (2010). - PMC - PubMed
    1. Singhmar P., et al. , Critical role for Epac1 in inflammatory pain controlled by GRK2-mediated phosphorylation of Epac1. Proc. Natl. Acad. Sci. U.S.A. 113, 3036–3041 (2016). - PMC - PubMed
    1. Wang H., et al. , Balancing GRK2 and EPAC1 levels prevents and relieves chronic pain. J. Clin. Invest. 123, 5023–5034 (2013). - PMC - PubMed

Publication types

Substances

LinkOut - more resources