. 2020 Feb 20;11(1):969.
doi: 10.1038/s41467-020-14725-y.

Relaxed sequence constraints favor mutational freedom in idiosyncratic metazoan mitochondrial tRNAs

Affiliations

Relaxed sequence constraints favor mutational freedom in idiosyncratic metazoan mitochondrial tRNAs

Bernhard Kuhle et al. Nat Commun. .

Abstract

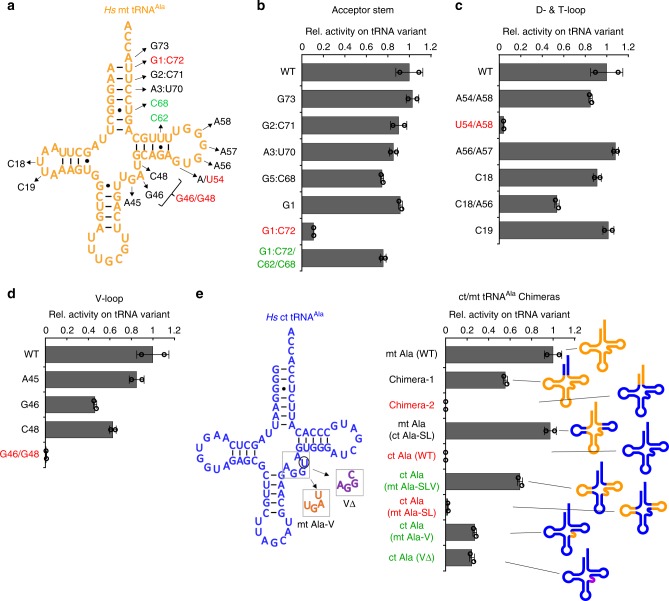
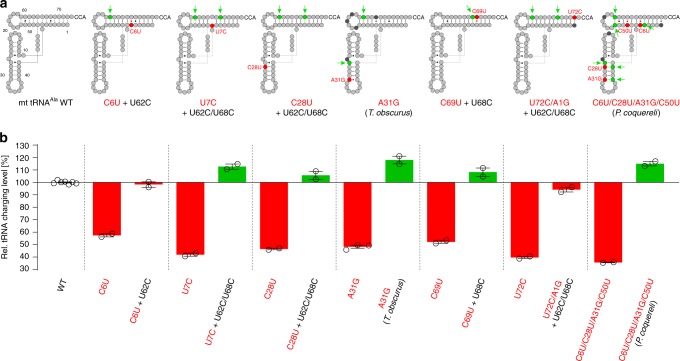
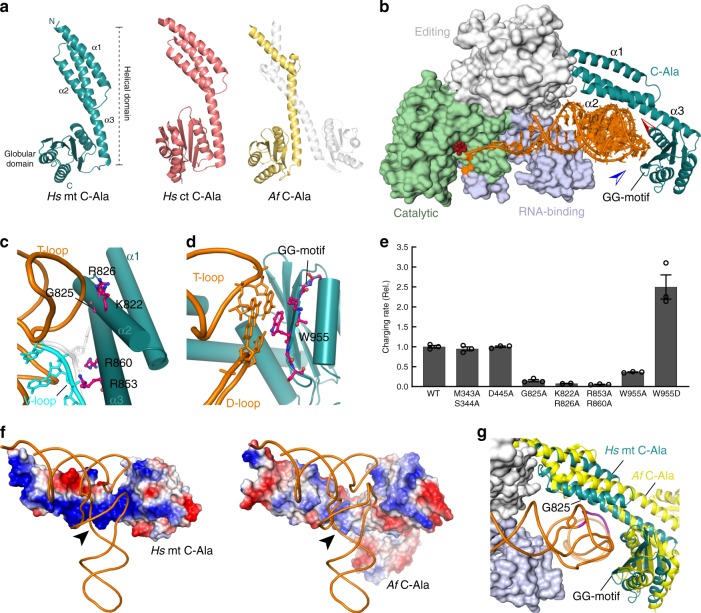
Metazoan complexity and life-style depend on the bioenergetic potential of mitochondria. However, higher aerobic activity and genetic drift impose strong mutation pressure and risk of irreversible fitness decline in mitochondrial (mt)DNA-encoded genes. Bilaterian mitochondria-encoded tRNA genes, key players in mitochondrial activity, have accumulated mutations at significantly higher rates than their cytoplasmic counterparts, resulting in foreshortened and fragile structures. Here we show that fragility of mt tRNAs coincided with the evolution of bilaterian animals. We demonstrate that bilaterians compensated for this reduced structural complexity in mt tRNAs by sequence-independent induced-fit adaption to the cognate mitochondrial aminoacyl-tRNA synthetase (aaRS). Structural readout by nuclear-encoded aaRS partners relaxed the sequence constraints on mt tRNAs and facilitated accommodation of functionally disruptive mutational insults by cis-acting epistatic compensations. Our results thus suggest that mutational freedom in mt tRNA genes is an adaptation to increased mutation pressure that was associated with the evolution of animal complexity.


Conflict of interest statement

The authors declare no competing interests.

Figures

Fig. 1
Fig. 1. Increased sequence divergence, degeneration of structural determinants and loss of sequence identity elements in bilaterian mt tRNAs.
a Average length (top) and sequence changes (middle) of mitochondrial (orange) and prokaryotic/cytoplasmic (ct) tRNAs (blue). The average length of ct tRNAs ranges from 72–74 nt to ≥80 nt for tRNAs with long variable arm. While non-bilaterian mt tRNAs retain canonical length distributions, average sequence length of bilaterian mt tRNAs drops significantly (Supplementary Fig. 1b) relative to cytoplasmic counterparts, with ~65 nt (mean) in protostomes (p < 0.001) and low branching deuterostomes, and ~69 nt in vertebrates (p<0.001). In terms of sequence divergence in tRNAs (middle), non-bilaterian mt tRNAs exhibit moderate but significant increases to ~44% sequence changes compared with ~40% (p < 0.001) in ct tRNAs, likely linked to increased A/U content (Supplementary Fig. 1a). Bilaterian mt tRNAs accumulate substitutions further to ~64% and ~58% in protostomes and deuterostomes, respectively, compared with ~40% in ct tRNAs (p < 0.001). Again, protostomes and low branching deuterostomes show stronger divergence than vertebrates, possibly also linked to stronger increases in A/U content. Mt tRNAAla and mt tRNASer/UGA are highlighted in dark and light yellow, respectively; ct tRNAAla and ct tRNASer/UGA are highlighted in dark and light blue, respectively. Each data point corresponds to one tRNA identity (Ala, Arg, etc.) within phylogenetic groups indicated below the x-axis. Sequence divergence was determined relative to α-proteobacterial tRNAs. The bottom panel shows the phylogenetic relationship and divergence times between the organismal groups for which tRNAs were compared. P-values were determined by Wilcoxon rank sum test (Supplementary Fig. 1b). Source data are provided as a Source Data file. b Scheme of cloverleaf and L-shaped fold of canonical tRNA with conserved structure- and sequence elements. Canonical tertiary interactions are indicated by cyan dashed lines. c Examples of mt tRNAAla (orange) from Octopus vulgaris (Ov) and humans (Hs) and of canonical tRNAAla (blue) from E. coli and human cytoplasm. Red boxes indicate the G3:U70 identity element. In O. vulgaris and human mt tRNAAla, G3:U70 is replaced by U:A and G:C pairs, respectively (bold red) (see also Supplementary Figs. 1–3).
Fig. 2
Fig. 2. Sequence-independent recognition of Hs mt tRNAAla by mt AlaRS.
a Hs mt tRNAAla mutants used in charging experiments with mt AlaRS. bd Relative charging activities (kcat/Km) of mt AlaRS on mt tRNAAla variants (activity with wild-type mt tRNAAla is set to 1). e Sequence of Hs ct tRNAAla (left) and relative activities of chimeric tRNAAla variants. Domains are colored orange for mt tRNAAla and blue for ct tRNAAla. Error bars represent SEM of two independent experiments for each wild-type and mutant. Source data are provided as a Source Data file (see also Table 1).
Fig. 3
Fig. 3. Compensatory epistasis in Hs mt tRNAAla.
a Hs mt tRNAAla is presented in schematic L-shape. Shown is a subset of constructs used in this study that showed compensatory epistasis between sites. Red indicates initial mutations that reduce charging. The positions for compensatory mutations that restore charging are shown in green and are indicated by arrows. “T. obscurus” and “P. coquereli” denote the mt tRNAAla’s from two primate species that contain known human disease-causing mutations in an overall altered sequence context. Black circles indicate positions with sequence alterations relative to wild-type (WT) Hs mt tRNAAla with unknown effects on stability. b Relative charging levels for mt tRNAAla constructs containing the destabilizing mutation alone or in combination with compensatory mutations. The charging level of wild-type Hs mt tRNAAla is set to 100%. Error bars represent the SEM of two to six independent experiments. Source data are provided as a Source Data file (see also Supplementary Figs. 4–6 and Table 2 for data on the complete set of compensatory mutations used in this study).
Fig. 4
Fig. 4. mt tRNAAla recognition by mt C-Ala.
a Structures of Hs mt C-Ala (left), Hs ct C-Ala (middle), and A. fulgidus C-Ala (right). b Structure model of mt tRNAAla (orange) bound to Hs mt AlaRS. The crystal structure of mt C-Ala is shown in cyan. Red and blue arrows indicate views in (c) and (d), respectively. c, d Details of the possible interaction interfaces between mt C-Ala and tRNA as indicated by the model. c Interaction of T-stem-loop (orange) and V-loop (cyan) with the N-terminal subdomain. d Interaction of T-loop and D-loop (orange) with the globular subdomain. In (c), the additional V-loop nucleotide that is absent in mt tRNAAla but present in ct tRNAAla (as U47), is shown in transparent gray. e Impact of mutations in Hs mt AlaRS on mt tRNAAla charging. Error bars represent SEM of triplicate experiments. Source data are provided as a Source Data file. f Comparison of surface charge distributions in Hs mt C-Ala (left) and Af C-Ala (right). Blue indicates positive, red is negative surface charge. Arrows indicate the position of the V-loop. g Superposition of Hs mt C-Ala (cyan) and Af C-Ala (yellow) based on the C-terminal globular domain (see also Supplementary Figs. 7 and 9; see Supplementary Table 1 for data collection and refinement statistics).
Fig. 5
Fig. 5. Structural idiosyncrasies and instability in the tRNA elbow region act as anti-identity elements between mtaaRS/tRNA systems.
a Hs mt AlaRS charges cognate mt tRNAAla but not mt tRNAs specific for Asp, Leu, or Ser. Error bars represent the SEM from triplicate experiments. b Cloverleaf presentations of Hs mt tRNAAsp (left) and variants containing D- and T-stem-loop and V-loop elements from mt tRNAAla (orange) or canonical ct tRNAs (blue/purple). Dashed lines indicate the potential for canonical D-loop-T-loop tertiary interactions. c Charging activity of Hs mt AlaRS on mt tRNAAsp variants relative to activities on wild-type mt tRNAAla (blue; top y-axis) and wild-type mt tRNAAsp (gray; bottom y-axis). See also Table 3. Error bars represent SEM of two to six independent experiments. Source data are provided as a Source Data file. d Hs mt SerRS charges cognate mt tRNASer/UGA and stabilized mt tRNAAsp variants but not wild-type mt tRNAs specific for Ala or Asp. Error bars represent the SEM from triplicate experiments. e Thermal melts for wild-type and stabilized mt tRNA variants and Hs ct tRNAAla (see also Supplementary Fig. 10).

References

    1. Lane N, Martin W. The energetics of genome complexity. Nature. 2010;467:929–934. doi: 10.1038/nature09486. - DOI - PubMed
    1. Lane N. Bioenergetic constraints on the evolution of complex life. Cold Spring Harb. Perspect. Biol. 2014;6:a015982. doi: 10.1101/cshperspect.a015982. - DOI - PMC - PubMed
    1. Bains, W. in Evolutionary Biology (ed. Pontarotti, P.) 255–272 (Springer, Cham, 2016).
    1. Lynch M. Mutation accumulation in transfer RNAs: molecular evidence for Muller's ratchet in mitochondrial genomes. Mol. Biol. Evol. 1996;13:209–220. doi: 10.1093/oxfordjournals.molbev.a025557. - DOI - PubMed
    1. Muller HJ. The relation of recombination to mutational advance. Mutat. Res. 1964;106:2–9. doi: 10.1016/0027-5107(64)90047-8. - DOI - PubMed

Publication types

MeSH terms