. 2020 Feb 20;10(1):3066.
doi: 10.1038/s41598-020-59652-6.

Antibacterial effects of low-temperature plasma generated by atmospheric-pressure plasma jet are mediated by reactive oxygen species

Affiliations

Antibacterial effects of low-temperature plasma generated by atmospheric-pressure plasma jet are mediated by reactive oxygen species

McKayla J Nicol et al. Sci Rep. .

Abstract

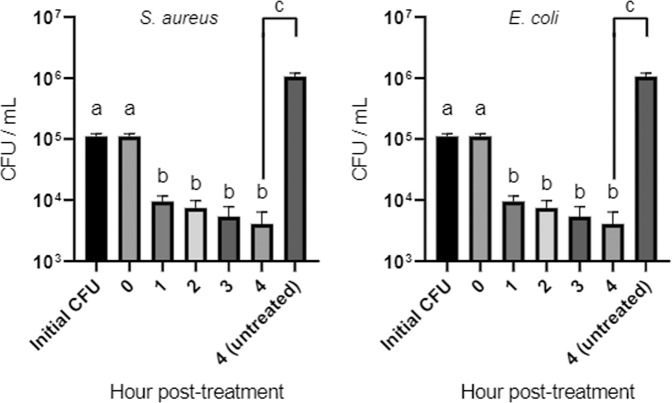
Emergence and spread of antibiotic resistance calls for development of non-chemical treatment options for bacterial infections. Plasma medicine applies low-temperature plasma (LTP) physics to address biomedical problems such as wound healing and tumor suppression. LTP has also been used for surface disinfection. However, there is still much to be learned regarding the effectiveness of LTP on bacteria in suspension in liquids, and especially on porous surfaces. We investigated the efficacy of LTP treatments against bacteria using an atmospheric-pressure plasma jet and show that LTP treatments have the ability to inhibit both gram-positive (S. aureus) and gram-negative (E. coli) bacteria on solid and porous surfaces. Additionally, both direct LTP treatment and plasma-activated media were effective against the bacteria suspended in liquid culture. Our data indicate that reactive oxygen species are the key mediators of the bactericidal effects of LTP and hydrogen peroxide is necessary but not sufficient for antibacterial effects. In addition, our data suggests that bacteria exposed to LTP do not develop resistance to further treatment with LTP. These findings suggest that this novel atmospheric-pressure plasma jet could be used as a potential alternative to antibiotic treatments in vivo.


Conflict of interest statement

The authors declare no competing interests.

Figures

Figure 1
Figure 1
Diagram of APPJ setup. (Left) The APPJ consists of a quartz tube with outer diameter 4 mm and inner diameter 2.4 mm Copper ring electrodes are located on the outside of the tube separated by 10 mm and with the ground electrode located 10 mm from the jet exit. Helium with or without oxygen admixture flows through the tube and is excited by a high-voltage amplifier. (Right) The APPJ can be exposed to living tissue without thermal sensation, demonstrating that its effects are non-thermal in nature.
Figure 2
Figure 2
Lissajous plot of APPJ. The standard Lissajous plot shows the charge on the monitor capacitor (C = 10 nF) placed between the downstream electrode and the electrical ground of the high-voltage amplifier. Integrating the enclosed area and multiplying by the frequency provides the power deposited in the plasma jet.
Figure 3
Figure 3
Low temperature atmospheric pressure plasma jet inhibits bacterial growth of S. aureus and E. coli. (A) Representative images of untreated (left) and treated (right) LB plates with 5 × 107 CFU/mL of S. aureus and (B) E. coli. (C) Quantification of zones of inhibition of S. aureus and E. coli from 0, 30, 60, 90, and 120 s of exposure to LTP, N = 5. (D) Quantification of area of zones of inhibition of indicated bacteria plated in soft agar and exposed to 0, 30, and 60 s of LTP. Statistical significance was determined by one-way ANOVA with Tukey’s multiple-comparison test. Significance is shown via grouping: a = significantly different from groups marked with b or c; b = significantly different from groups marked with a or c; c = significantly different from groups marked with a or b p ≤ 0.05, N = 3.
Figure 4
Figure 4
Antibacterial treatment of bacteria suspended in LB broth. Individual wells of a 24-well plate containing 1 × 105 CFU/mL of S.aureus and E. coli suspended in 400 μL of LB broth were exposed to LTP for 3 minutes each. Samples were taken at 0, 1, 2, 3, and 4 hours and plated to determine CFU. Statistical significance was determined by one-way ANOVA with Tukey’s multiple-comparison test for treated samples and paired t-test for untreated sample. Significance is shown via grouping: a = significantly different from groups marked with b or c; b = significantly different from groups marked by a or c; c = significantly different from groups marked with a or b, p ≤ 0.05, N = 6.
Figure 5
Figure 5
Antibacterial treatment of bacteria suspended in LB broth. Individual wells of a 24-well plate containing 2 × 109 CFU/mL of E. coli suspended in 1 mL of LB broth were exposed to LTP for 15 minutes each. Samples were taken at 4 hours post treatment and stained using Propidium Iodide and SYTO 9. Representative images of untreated (left), heat killed (center) and plasma treated (right) samples are shown.
Figure 6
Figure 6
Plasma activated media (PAM) shows similar bactericidal properties to direct LTP. (A) Individual wells of a 24-well plate containing 400 μL of LB broth were exposed to LTP for 3 minutes each. 1 × 105 CFU/mL of S. aureus and E. coli were added immediately post-treatment. Samples were incubated for 0, 1, 2, 3, and 4 hours and plated to determine CFU. Statistical significance was determined by one-way ANOVA with Tukey’s multiple-comparison test for treated samples and paired t-test for untreated sample. Significance is shown via grouping: a = significantly different from groups marked with b or c; a,b = significantly different from groups marked with c; b = significantly different from groups marked with a or c; c = significantly different from groups marked with a or b, p ≤ 0.05, N = 3.
Figure 7
Figure 7
Levels of extracellular ROS/RNS during incubation period. Individual wells of a 24-well plate containing 400 μL of LB broth were exposed to LTP for 3 minutes each. Samples were incubated for 0, 1, 2, 3, and 4 hours before measuring levels of (A) total ROS/RNS via DCF and (B) H2O2. Statistical significance was determined by one-way ANOVA with Tukey’s multiple-comparison test for treated samples. Significance is shown via grouping: a = significantly from other groups marked with b, c, or d; a, b = significantly different from groups marked with c or d; b = significantly different from groups marked by a, c, or d; c = significantly different from groups marked with a, b, or d; d = significantly different from groups marked with a, b, or c; a, d = significantly different from groups marked with b or c, p ≤ 0.05, N = 3.
Figure 8
Figure 8
H2O2 is not sufficient for bactericidal properties of LTP. (A) Individual wells of a 24-well plate containing 400 μL of LB broth and 200 U of bovine liver catalase were exposed to LTP for 3 minutes each. 1 × 105 CFU/mL of E. coli were added immediately post-treatment. Samples were incubated for 4 hours before enumerating CFU. (B) Wells were treated in the same manner described above with 135 μM H2O2. Samples were incubated for 4 hours before enumerating CFU. Statistical significance was determined by one-way ANOVA with Tukey’s multiple-comparison test for treated samples and two-tailed t-test for untreated sample comparison. Significance is shown via grouping: a = significantly different from groups marked with b or c; b = significantly different from groups marked with a or c; c = significantly different from groups marked with a or bp ≤ 0.05, N = 4.
Figure 9
Figure 9
Effectiveness of LTP treatment on fresh and previously treated bacteria. Individual wells of a 24-well plate containing 1 × 105 CFU/mL of fresh and previously treated E. coli from prior experiments suspended in 400 μL of LB broth were re-exposed to LTP for 3 minutes each. Re-exposure was repeated 4 times. Samples were incubated for 4 hours before enumerating CFU. Statistical significance was determined by two-way ANOVA with Tukey’s multiple-comparison test. Significance is shown via grouping: a = significantly different from groups marked with b or c; b = significantly different from groups marked with a or c; c = significantly different from groups marked with a or b, p ≤ 0.05, N = 4.

References

    1. Ventola CL. The antibiotic resistance crisis: part 1: causes and threats. P T. 2015;40:277–83. - PMC - PubMed
    1. Centers for Disease Control and Prevention. About Antimicrobial Resistance | Antibiotic/Antimicrobial Resistance | CDC. Available at, https://www.cdc.gov/drugresistance/about.html. (Accessed: 19th December 2018) (2018).
    1. World Health Organization. WHO Library Cataloguing-in-Publication Data Global Action Plan on Antimicrobial Resistance (2015).
    1. World Health Organization. Global Antimicrobial Resistance Surveillance System (GLASS) Report Early implementation. (2017).
    1. Naylor NR, et al. Estimating the burden of antimicrobial resistance: a systematic literature review. Antimicrob. Resist. Infect. Control. 2018;7:58. doi: 10.1186/s13756-018-0336-y. - DOI - PMC - PubMed

Publication types

MeSH terms