. 2020 Feb 20;10(1):3029.
doi: 10.1038/s41598-020-59812-8.

Chromosome 19 microRNA cluster enhances cell reprogramming by inhibiting epithelial-to-mesenchymal transition

Affiliations

Chromosome 19 microRNA cluster enhances cell reprogramming by inhibiting epithelial-to-mesenchymal transition

Ezinne F Mong et al. Sci Rep. .

Abstract

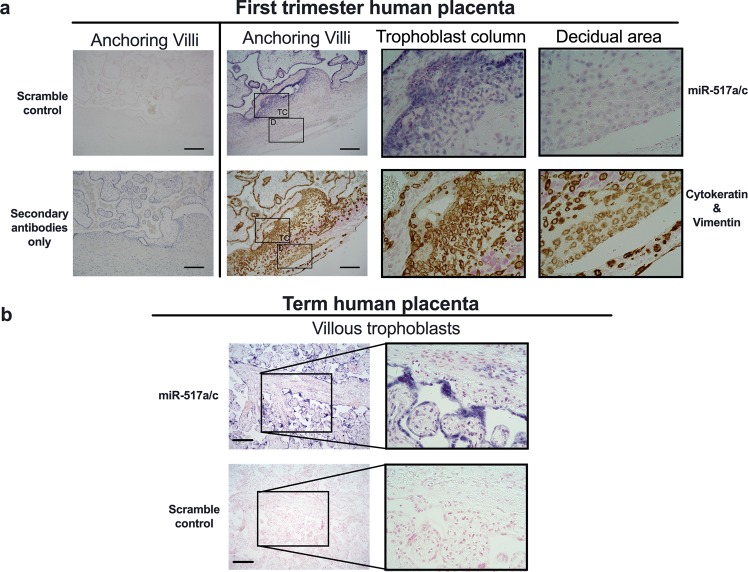
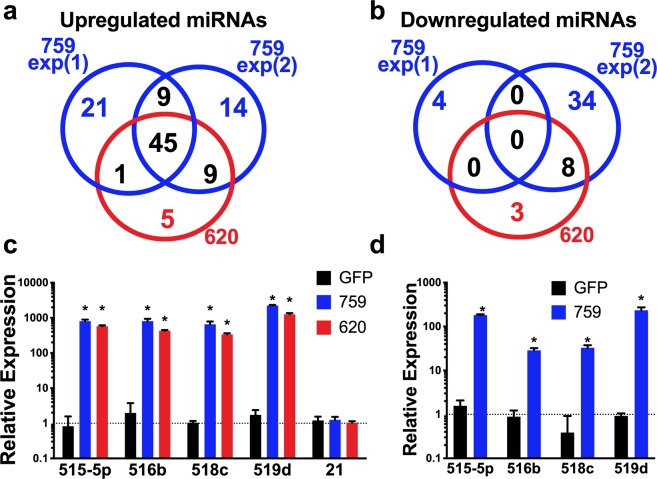
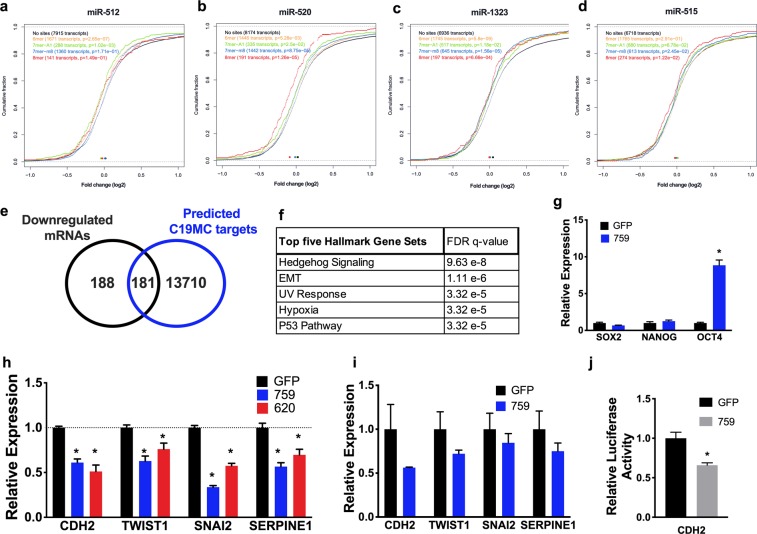
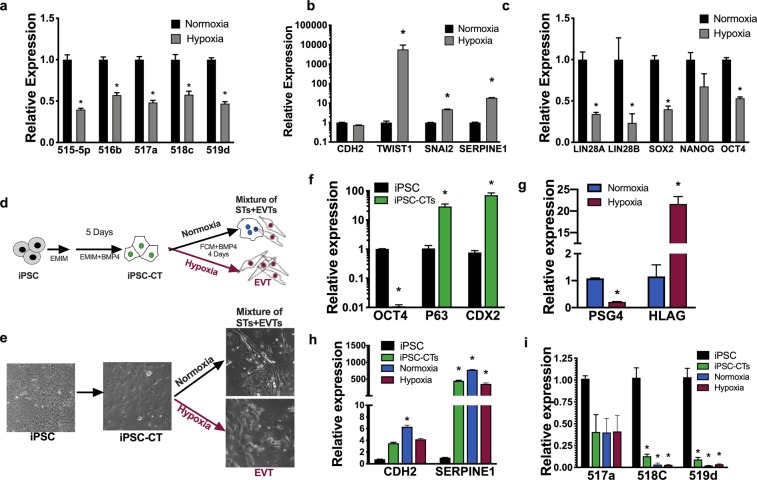
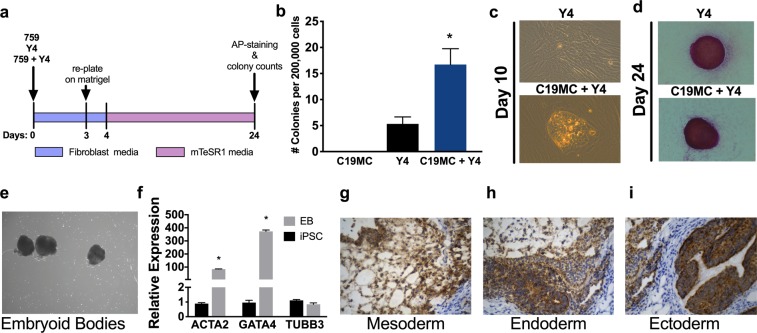
During implantation, cytotrophoblasts undergo epithelial-to-mesenchymal transition (EMT) as they differentiate into invasive extravillous trophoblasts (EVTs). The primate-specific microRNA cluster on chromosome 19 (C19MC) is exclusively expressed in the placenta, embryonic stem cells and certain cancers however, its role in EMT gene regulation is unknown. In situ hybridization for miR-517a/c, a C19MC cistron microRNA, in first trimester human placentas displayed strong expression in villous trophoblasts and a gradual decrease from proximal to distal cell columns as cytotrophoblasts differentiate into invasive EVTs. To investigate the role of C19MC in the regulation of EMT genes, we employed the CRISPR/dCas9 Synergistic Activation Mediator (SAM) system, which induced robust transcriptional activation of the entire C19MC cistron and resulted in suppression of EMT associated genes. Exposure of human iPSCs to hypoxia or differentiation of iPSCs into either cytotrophoblast-stem-like cells or EVT-like cells under hypoxia reduced C19MC expression and increased EMT genes. Furthermore, transcriptional activation of the C19MC cistron induced the expression of OCT4 and FGF4 and accelerated cellular reprogramming. This study establishes the CRISPR/dCas9 SAM as a powerful tool that enables activation of the entire C19MC cistron and uncovers its novel role in suppressing EMT genes critical for maintaining the epithelial cytotrophoblasts stem cell phenotype.


Conflict of interest statement

The authors declare no competing interests.

Figures

Figure 1
Figure 1
C19MC expression in human placenta. (a,b) Representative images of in situ hybridization for miR-517a/c (purple) or scramble control of first trimester human placentas (a) or term placentas (b). Nuclei were counterstained with nuclear fast red. To differentiate trophoblast from decidual cells, adjacent consecutively cut sections from first trimester human placentas were double-immunostained for trophoblast cell marker cytokeratin (brown), decidual cell marker vimentin (pink) or control secondary antibody and counterstained with hematoxylin. Scale bar represents 400 μm. Original magnification 10X, Black inserts 40X. TC, Trophoblast column; D, Decidual area.
Figure 2
Figure 2
Transcriptional activation of C19MC. (a,b) Venn diagram of upregulated miRNAs (a) and downregulated miRNAs (b) from sRNAseq data from 3 independent experiments in HEK293 cells transfected with either 759-sgRNA/SAM (759) or 620-sgRNA/SAM (620) for 72 hr. (c,d) qRT-PCR analysis of four representative miRNAs of the C19MC cistron or miR-21 normalized to U18, 72 h after transfection of HEK293 cells with 759-sgRNA/SAM or 620-sgRNA/SAM (c) or 72 h after transfection of HTR8/SVneo cells with 759-sgRNA/SAM (d). Graphs represent means ± SEM of at least 3 independent experiments containing 3 replicates each. *p < 0.05 vs. GFP transfected control cells by 2-way ANOVA with Dunnett’s post-hoc (c) or by Multiple T-tests with Holm-Sidak correction (d).
Figure 3
Figure 3
C19MC miRNAs increase OCT4 expression and decrease EMT gene expression. (ad) Cumulative distribution of differentially expressed mRNAs targeted by miR-512, miR-520, miR-1323 and miR-515 in HEK293 cells transfected with 759-sgRNA/SAM (759) compared to GFP transfected cells. (e,f) Venn diagram (e) and Hallmark gene set analysis (f) of the 181 common downregulated mRNAs in HEK293 cells transfected with 759-sgRNA/SAM or 620-sgRNA/SAM (620) compared to GFP control and predicted C19MC miRNAs target genes. (gi) qRT-PCR analysis of the indicated genes normalized to GAPDH in HEK293 cells (g,h) or in HTR8/SVneo cells (i) transfected with the indicated gRNA. (j) Luciferase reporter assay of HEK293 cells transfected with 759-sgRNA/SAM and PGL2 plasmid containing CDH2 3′ UTR normalized to GFP control. Graphs represent means ± SEM of at least 3 independent experiments containing 3 replicates each. *p < 0.05 vs. GFP transfected control cells. Multiple t-tests with Holm-Sidak correction (g,I,j); Two-way ANOVA with Dunnett’s post-hoc (h).
Figure 4
Figure 4
Hypoxia decreases the expression of C19MC miRNAs and upregulates EMT genes. (ac) qRT-PCR analysis of the indicated miRNA normalized to U18 (a) or indicated genes normalized to GAPDH (b,c) of iPSCs cultured in hypoxia (1% O2) or normoxia (21% O2) for 24 hours. (d,e) Schematic (d) and 20x phase images (e) showing two-step iPSC differentiation. Generation of iPSC derived CTs (iPSC-CT) using EMIM medium supplemented with 10 ng/ml BMP4 (step1) and subsequently cultured in FCM medium supplemented with 10 ng/ml BMP4 under normoxia or hypoxia to terminally differentiate iPSC-CTs into STs and EVTs, respectively (step2). (fi) qRT-PCR analysis of the indicated genes normalized to GAPDH (f-h) or the indicated miRNA normalized to U18 (i). Graphs represent means ± SEM of a minimum of 3 independent experiments each comprised of 3 replicates. *p < 0.05 vs. normoxia (ac) or vs. iPSC (f,h,i), Multiple t-tests with Holm-Sidak correction (ac,f,g); Two-way ANOVA with Dunnett’s post-hoc (h,i).
Figure 5
Figure 5
C19MC accelerates iPSC generation when co-transfected with Yamanaka factors. (a) Schematic of transfection protocol. 759, sgRNA-759/SAM; Y4, Yamanaka factors. (b) Colony counts from 759-, Y4- and 759+Y4-transfected NHDFs at day 24. (c,d) Colony morphology at 10 days post transfection (c) or AP staining of iPSC clones at day 24 (d) of Y4- or 759+Y4-transfected NHDFs. (e,f) Image (e) and qRT-PCR analysis of the indicated genes normalized to GAPDH (f) of embryoid bodies (EB) generated from 759+Y4 iPSC clone 3-CF-6 (passage 5) after 7 days culture in suspension compared to the parental non-differentiated iPSC clone. (gi) Images of teratoma sections from SCID mice injected with iPSCs generated using 759-sgRNA/SAM +Y4, immunostained with human mitochondria specific antibody and hematoxylin showing ectoderm, mesoderm and endoderm like cellular structures. Graph represents means ± SEM. *p < 0.05 vs. Y4 (b) or non-differentiated iPSC 3-CF-6 clone (f). Two way ANOVA with Dunnett’s post-hoc (b); Multiple t-tests with Holm-Sidak correction (f).

References

    1. Wang, Y. & Zhao, S. In Vascular Biology of the Placenta Integrated Systems Physiology: from Molecules to Function to Disease (2010).
    1. Goldman-Wohl D, Yagel S. Regulation of trophoblast invasion: from normal implantation to pre-eclampsia. Mol. Cell Endocrinol. 2002;187:233–238. doi: 10.1016/S0303-7207(01)00687-6. - DOI - PubMed
    1. Hemberger M. Immune balance at the foeto-maternal interface as the fulcrum of reproductive success. J. Reprod. Immunol. 2013;97:36–42. doi: 10.1016/j.jri.2012.10.006. - DOI - PubMed
    1. Maltepe E, Bakardjiev AI, Fisher SJ. The placenta: transcriptional, epigenetic, and physiological integration during development. J. Clin. Invest. 2010;120:1016–1025. doi: 10.1172/JCI41211. - DOI - PMC - PubMed
    1. Red-Horse K, et al. Trophoblast differentiation during embryo implantation and formation of the maternal-fetal interface. J. Clin. Invest. 2004;114:744–754. doi: 10.1172/JCI22991. - DOI - PMC - PubMed

Publication types

MeSH terms