

Color-specific porosity in double pigmented natural 3d-nanoarchitectures of blue crab shell
- PMID: 32080287
- PMCID: PMC7033127
- DOI: 10.1038/s41598-020-60031-4
Color-specific porosity in double pigmented natural 3d-nanoarchitectures of blue crab shell
Abstract
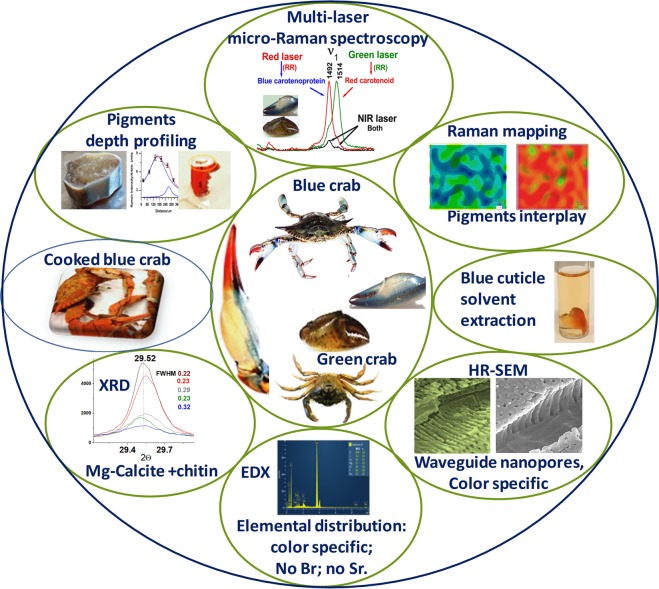
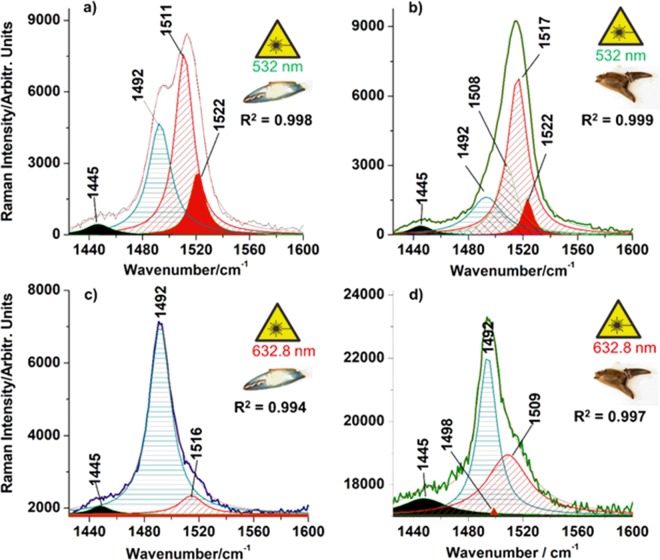
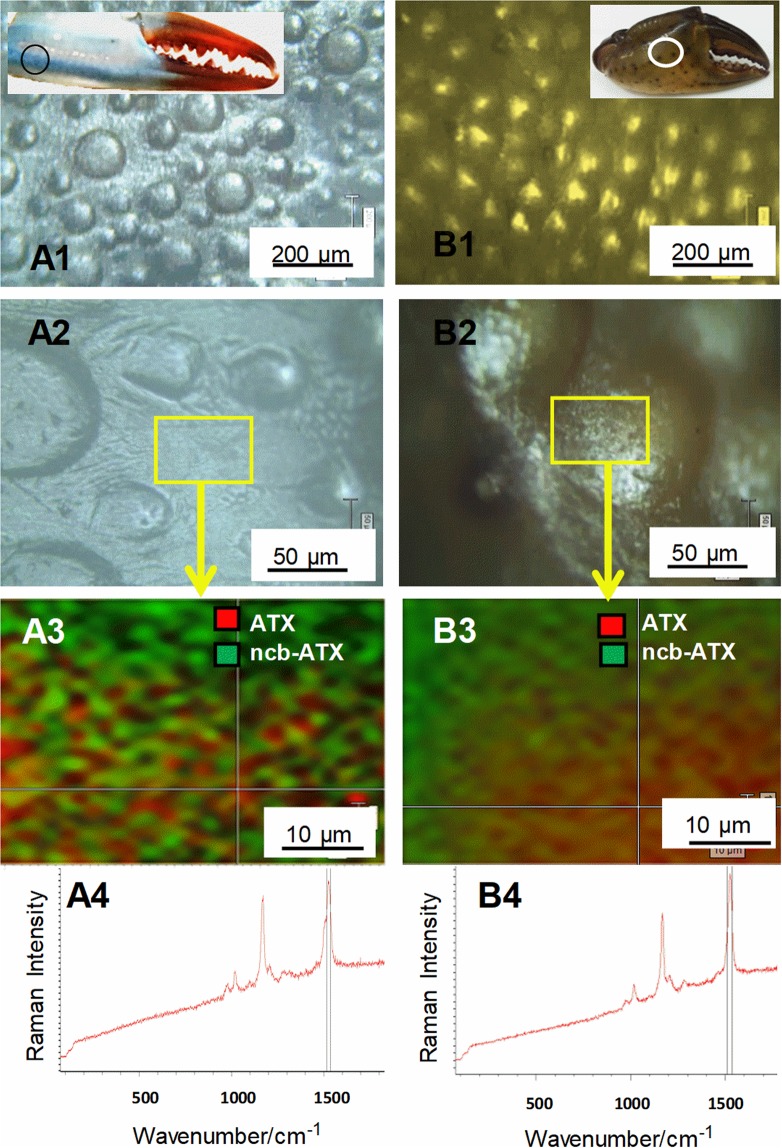
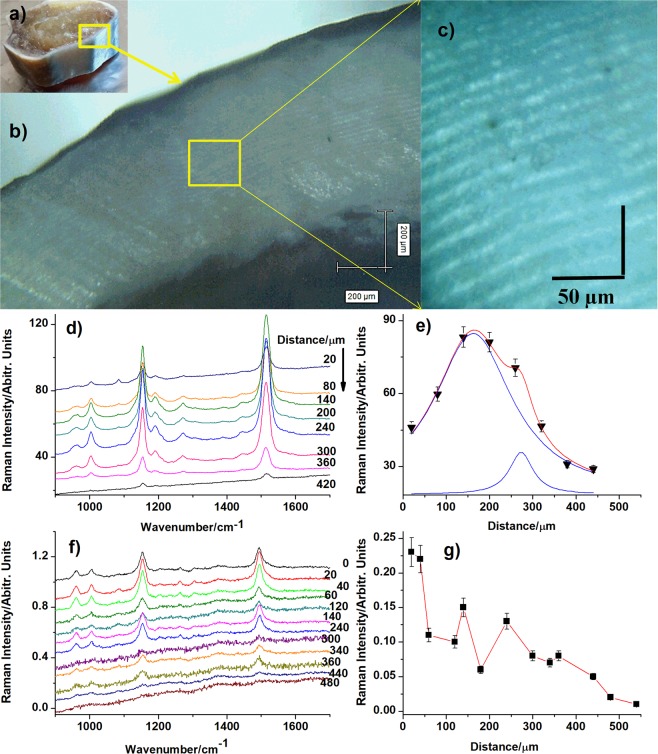
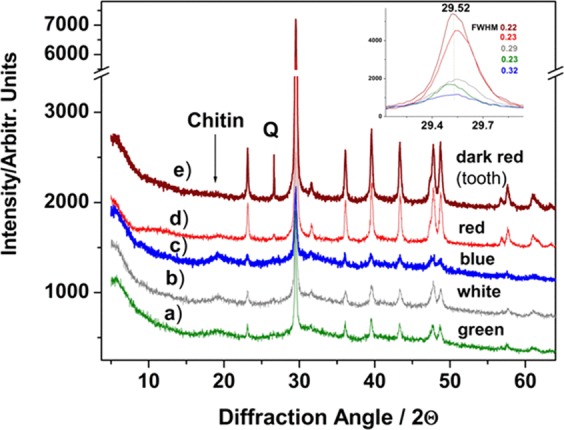
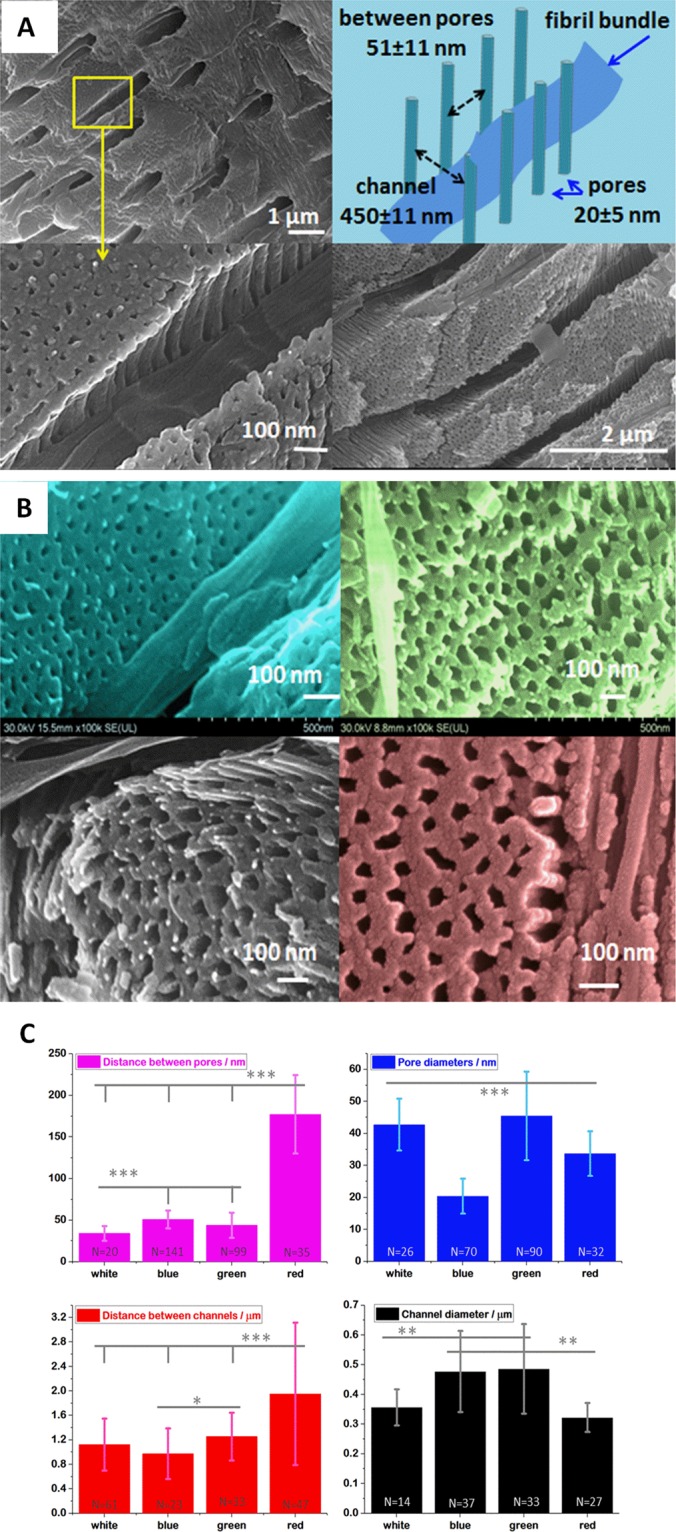
3D-engineered nano-architectures with various functionalities are still difficult to obtain and translate for real-world applications. However, such nanomaterials are naturally abundant and yet wasted, but could trigger huge interest for blue bioeconomy, provided that our understanding of their ultrastructure-function is achieved. To date, the Bouligand pattern in crustaceans shell structure is believed to be unique. Here we demonstrated that in blue crab Callinectes sapidus, the 3D-nanoarchitecture is color-specific, while the blue and red-orange pigments interplay in different nano-sized channels and pores. Thinnest pores of about 20 nm are found in blue shell. Additionally, the blue pigment co-existence in specific Bouligand structure is proved for the green crab Carcinus aestuarii, although the crab does not appear blue. The pigments interplay, simultaneously detected by Raman spectroscopy in color-specific native cuticles, overturns our understanding in crustaceans coloration and may trigger the selective use of particular colored natural nanoarchitectures for broaden area of applications.
Conflict of interest statement
The authors declare no competing interests.
Figures
Similar articles
-
Detailed spectroscopic study of the role of Br and Sr in coloured parts of the Callinectes sapidus crab claw.J Struct Biol. 2016 Jul;195(1):1-10. doi: 10.1016/j.jsb.2016.05.006. Epub 2016 May 14. J Struct Biol. 2016. PMID: 27183904
-
The male blue crab, Callinectes sapidus, uses both chromatic and achromatic cues during mate choice.J Exp Biol. 2012 Apr 1;215(Pt 7):1184-91. doi: 10.1242/jeb.067512. J Exp Biol. 2012. PMID: 22399664
-
Wasted Biomaterials from Crustaceans as a Compliant Natural Product Regarding Microbiological, Antibacterial Properties and Heavy Metal Content for Reuse in Blue Bioeconomy: A Preliminary Study.Materials (Basel). 2021 Aug 13;14(16):4558. doi: 10.3390/ma14164558. Materials (Basel). 2021. PMID: 34443081 Free PMC article.
-
The Atlantic blue crab Callinectes sapidus in southern European coastal waters: Distribution, impact and prospective invasion management strategies.Mar Pollut Bull. 2017 Jun 15;119(1):5-11. doi: 10.1016/j.marpolbul.2017.02.050. Epub 2017 Feb 24. Mar Pollut Bull. 2017. PMID: 28242280 Review.
-
Natural blue pigments and bikaverin.Microbiol Res. 2021 Mar;244:126653. doi: 10.1016/j.micres.2020.126653. Epub 2020 Nov 25. Microbiol Res. 2021. PMID: 33302226 Review.
Cited by
-
pH-Dependent Behavior of Novel 5-FU Delivery System in Environmental Conditions Comparable to the Gastro-Intestinal Tract.Pharmaceutics. 2023 Mar 21;15(3):1011. doi: 10.3390/pharmaceutics15031011. Pharmaceutics. 2023. PMID: 36986870 Free PMC article.
-
Flexible design in the stomatopod dactyl club.IUCrJ. 2023 May 1;10(Pt 3):288-296. doi: 10.1107/S2052252523002075. IUCrJ. 2023. PMID: 36912686 Free PMC article.
-
Superior mechanical resistance in the exoskeleton of the coconut crab, Birgus latro.Mater Today Bio. 2021 Sep 8;12:100132. doi: 10.1016/j.mtbio.2021.100132. eCollection 2021 Sep. Mater Today Bio. 2021. PMID: 34622195 Free PMC article.
-
Convergent Evolution of Armor: Thermal Resistance in Deep-Sea Hydrothermal Vent Crustaceans.Biology (Basel). 2024 Nov 21;13(12):956. doi: 10.3390/biology13120956. Biology (Basel). 2024. PMID: 39765623 Free PMC article.
-
The pathogenic oral-gut-liver axis: new understandings and clinical implications.Expert Rev Clin Immunol. 2021 Jul;17(7):727-736. doi: 10.1080/1744666X.2021.1935877. Epub 2021 Jun 8. Expert Rev Clin Immunol. 2021. PMID: 34057877 Free PMC article. Review.
References
-
- Onofri V, Dulčić J, Conides A, Matić-Skoko S, Glamuzina B. The occurrence of the blue crab, Callinectes sapidus Rathbun, 1896 (Decapoda, Brachyura, Portunidae) in the eastern Adriatic (Croatian coast) Crustaceana. 2008;81:403–409. doi: 10.1163/156854008783797561. - DOI
-
- Glamuzina L, et al. Population dynamics and reproduction of Mediterranean green crab Carcinus aestuarii in Parila Lagoon (Neretva estuary, Adriatic Sea, Croatia) as fishery management tools. Mar. Coast. Fish. 2017;9:260–270. doi: 10.1080/19425120.2017.1310155. - DOI
-
- Dulčić J, Tutman P, Matić-Skoko S, Glamuzina B. Six years from from first record ot popolation establishment: the case of the Blue crab, Callinectes sapidus Rathvun, 1896 (Brachyura, Portunidae) in the Neretva River delta (South-Eastern Adriatic Sea, Croatia) Crustaceana. 2011;84:1211–1220. doi: 10.1163/156854011X587478. - DOI
-
- Streptaris N, Zenetos A. Alien marine species in the Mediterranean – the 100 “worst invasives” and their impact. Mediterr. Mar. Sci. 2013;7:87–118. doi: 10.12681/mms.180. - DOI
Publication types
MeSH terms
Substances
LinkOut - more resources
Full Text Sources
