

Predicting Clinical Effects of CYP3A4 Modulators on Abemaciclib and Active Metabolites Exposure Using Physiologically Based Pharmacokinetic Modeling
- PMID: 32080863
- PMCID: PMC7318171
- DOI: 10.1002/jcph.1584
Predicting Clinical Effects of CYP3A4 Modulators on Abemaciclib and Active Metabolites Exposure Using Physiologically Based Pharmacokinetic Modeling
Abstract
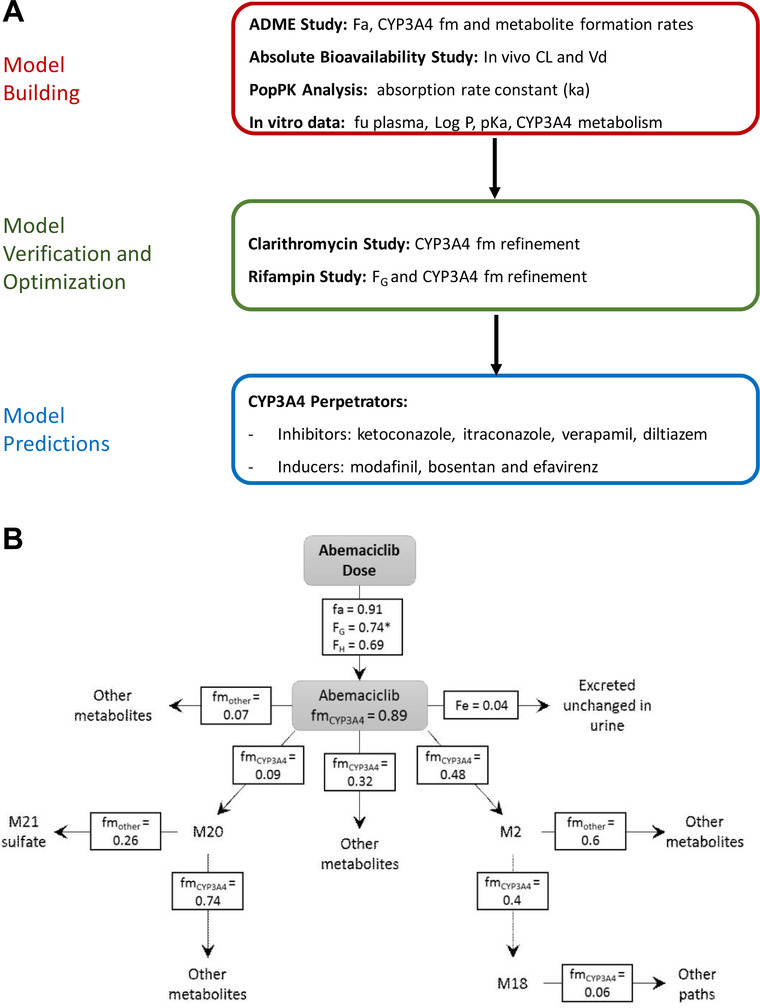
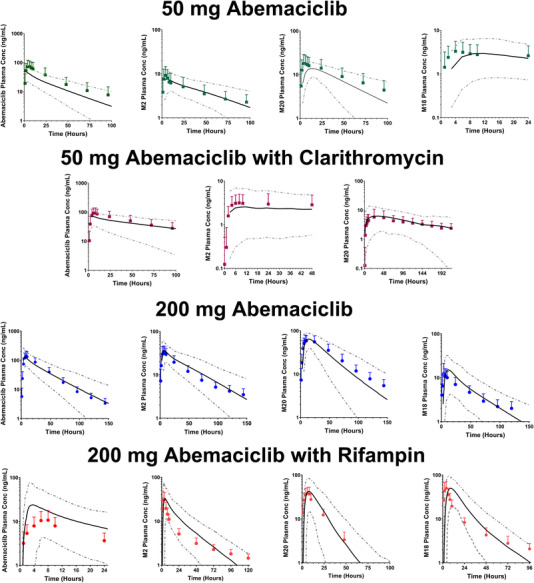
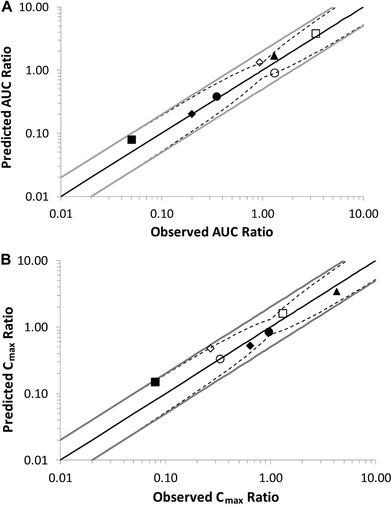
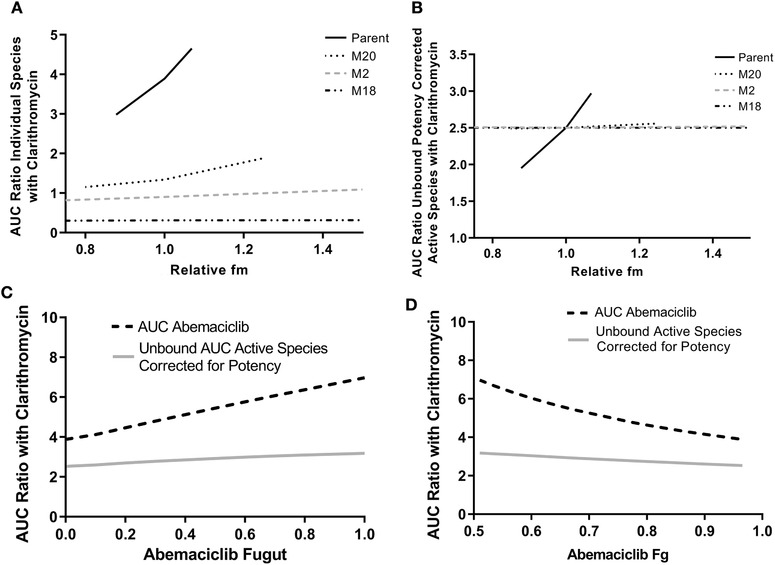
Abemaciclib, a selective inhibitor of cyclin-dependent kinases 4 and 6, is metabolized mainly by cytochrome P450 (CYP)3A4. Clinical studies were performed to assess the impact of strong inhibitor (clarithromycin) and inducer (rifampin) on the exposure of abemaciclib and active metabolites. A physiologically based pharmacokinetic (PBPK) model incorporating the metabolites was developed to predict the effect of other strong and moderate CYP3A4 inhibitors and inducers. Clarithromycin increased the area under the plasma concentration-time curve (AUC) of abemaciclib and potency-adjusted unbound active species 3.4-fold and 2.5-fold, respectively. Rifampin decreased corresponding exposures 95% and 77%, respectively. These changes influenced the fraction metabolized via CYP3A4 in the model. An absolute bioavailability study informed the hepatic and gastric availability. In vitro data and a human radiolabel study determined the fraction and rate of formation of the active metabolites as well as absorption-related parameters. The predicted AUC ratios of potency-adjusted unbound active species with rifampin and clarithromycin were within 0.7- and 1.25-fold of those observed. The PBPK model predicted 3.78- and 7.15-fold increases in the AUC of the potency-adjusted unbound active species with strong CYP3A4 inhibitors itraconazole and ketoconazole, respectively; and 1.62- and 2.37-fold increases with the concomitant use of moderate CYP3A4 inhibitors verapamil and diltiazem, respectively. The model predicted modafinil, bosentan, and efavirenz would decrease the AUC of the potency-adjusted unbound active species by 29%, 42%, and 52%, respectively. The current PBPK model, which considers changes in unbound potency-adjusted active species, can be used to inform dosing recommendations when abemaciclib is coadministered with CYP3A4 perpetrators.
Keywords: CYP3A4; PBPK; abemaciclib; active metabolites; cyclin-dependent kinases 4 and 6; drug interaction.
© 2020 Eli Lilly and Company. The Journal of Clinical Pharmacology published by Wiley Periodicals, Inc. on behalf of American College of Clinical Pharmacolog.
Conflict of interest statement
M.M.P., B.L.M., P.K.T., S.D.H., and G.L.D. are all employees and shareholders of Eli Lilly and Company; P.K. is a shareholder of Eli Lilly and Company.
Figures
References
-
- Patnaik A, Rosen LS, Tolaney SM, et al. Efficacy and safety of abemaciclib, an inhibitor of CDK4 and CDK6, for patients with breast cancer, non‐small cell lung cancer, and other solid tumors. Cancer Discov. 2016;6(7):740‐753. - PubMed
-
- U.S. Food and Drug Administration . https://www.accessdata.fda.gov/drugsatfda_docs/label/2018/208855s000lbl.pdf. Accessed May 10, 2019.
-
- Chigutsa E, Sykes KS A, Posada MM, Turner PK. A mechanistic population pharmacokinetic model of abemaciclib and its metabolites and the impact of diarrhea. Paper presented at: American Conference on Pharmacometrics; October 14‐19, 2017; Fort Lauderdale, FL.
-
- Kulanthaivel P, Mahadevan D, Turner PK, et al. Abstract CT153. Pharmacokinetic drug interactions between abemaciclib and CYP3A inducers and inhibitors. Cancer Res. 2016;76(14 suppl):CT153.
Publication types
MeSH terms
Substances
LinkOut - more resources
Full Text Sources
Molecular Biology Databases
