

SKIP-HOPS recruits TBC1D15 for a Rab7-to-Arl8b identity switch to control late endosome transport
- PMID: 32080880
- PMCID: PMC7073467
- DOI: 10.15252/embj.2019102301
SKIP-HOPS recruits TBC1D15 for a Rab7-to-Arl8b identity switch to control late endosome transport
Abstract
The endolysosomal system fulfils a myriad of cellular functions predicated on regulated membrane identity progressions, collectively termed maturation. Mature or "late" endosomes are designated by small membrane-bound GTPases Rab7 and Arl8b, which can either operate independently or collaborate to form a joint compartment. Whether, and how, Rab7 and Arl8b resolve this hybrid identity compartment to regain functional autonomy is unknown. Here, we report that Arl8b employs its effector SKIP to instigate inactivation and removal of Rab7 from select membranes. We find that SKIP interacts with Rab7 and functions as its negative effector, delivering the cognate GAP, TBC1D15. Recruitment of TBC1D15 to SKIP occurs via the HOPS complex, whose assembly is facilitated by contacts between Rab7 and the KMI motif of SKIP. Consequently, SKIP mediates reinstatement of single identity Arl8b sub-compartment through an ordered Rab7-to-Arl8b handover, and, together with Rab7's positive effector RILP, enforces spatial, temporal and morphological compartmentalization of endolysosomal organelles.
Keywords: HOPS; SKIP; Arl8b; Rab7; TBC1D15.
© 2020 The Authors. Published under the terms of the CC BY 4.0 license.
Conflict of interest statement
The authors declare that they have no conflict of interest.
Figures
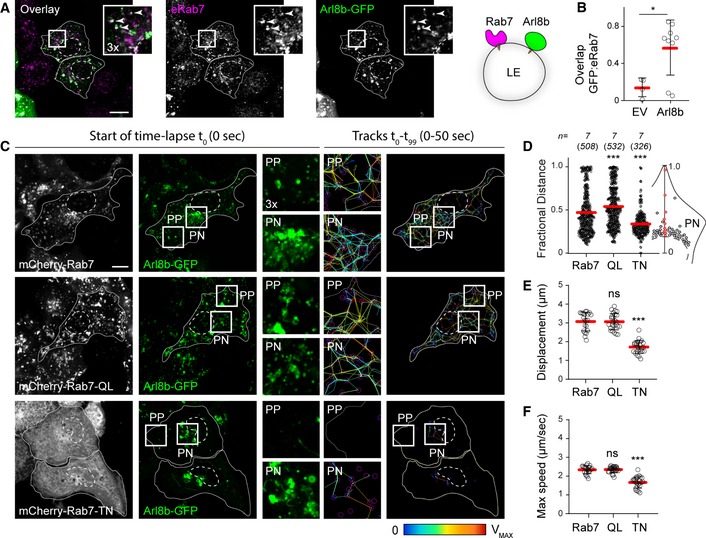
- A, B
Hybrid Rab7/Arl8b compartment. (A) Representative confocal images of fixed HeLa cells expressing Arl8b‐GFP (green), immunolabelled against endogenous Rab7 (eRab7, magenta). Zoom insets (3×) highlight select regions of colocalization (white), and white arrowheads point to vesicles positive for both GTPases. (B) Colocalization (Mander's overlap) of endogenous Rab7 with Arl8b‐GFP versus free GFP (EV), n EV = 4, n Arl8b = 9 images (3 ≥ cells per image) analysed from 2 independent experiments. Significance: two‐tailed Student's t‐test, *P < 0.05.
- C–F
Analysis of Arl8b compartment organization and dynamics as a function of Rab7 activity status. (C) Left and middle panels: representative confocal images of live HeLa cells expressing mCherry‐Rab7 or its mutants Q67L and T22N (white), together with Arl8b‐GFP (green), taken at the start of time‐lapse (t 0). Right panels: tracks followed by Arl8b‐positive vesicles during the time‐lapse lasting 50 s recorded at 0.5 s per frame, with highest displacement rates for each track depicted on a rainbow colour scale (blue: immobile; red: maximum mobility per time interval). Zoom insets (2.8×) highlight select peripheral (PP) and perinuclear (PN) cell regions (see also Movies [Link], [Link], [Link]). (D) Plot of Arl8b‐positive pixel distribution expressed as fractional distance along a straight line from centre of nucleus (0) to the plasma membrane (1.0), numbers of (pixels) plotted given above each scatter, n = 7 cells analysed per condition from 2 independent experiments. (E, F) Quantification of mean Arl8b vesicle displacement and maximum speed, respectively, n Rab7 = 21, n QL = 25, n TN = 24 images (3 ≥ cells per image) analysed from 2 independent experiments. Significance: one‐way ANOVA test (relative to wild type Rab7), ***P < 0.001, ns: not significant.
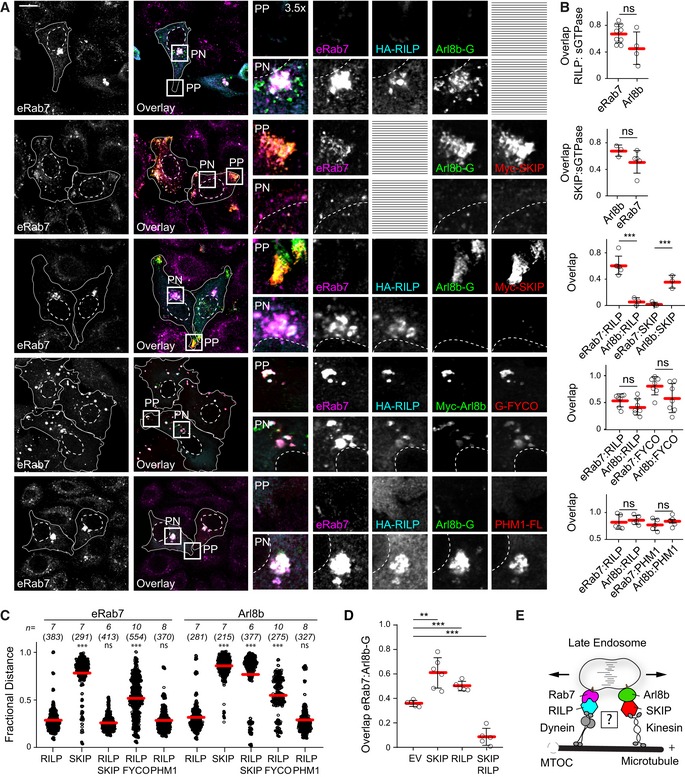
- A–D
Effects of select transport route activation on the spatial organization of late compartments. (A) Representative confocal images of fixed HeLa cells ectopically expressing Arl8b‐GFP or Arl8b‐Myc (green), in combination with HA‐RILP (cyan) and/or Myc‐SKIP, PLEKHM1‐FLAG or GFP‐FYCO1 (red), immunolabelled against endogenous Rab7 (eRab7, magenta) and the indicated epitope tags. Cell and nuclear boundaries are demarcated with solid and dashed lines, respectively, and zoom insets (3.5×) highlight select peripheral (PP) and perinuclear (PN) cell regions, scale bar: 10 μm. (B) Colocalization (Mander's overlap) between the indicated pairs of proteins, n ≥ 3 images (3 ≥ cells per image) analysed per condition from 2 independent experiments. (C) Plot of eRab7‐ or Arl8b‐GFP/Myc‐Arl8b‐positive pixel distribution in response to the indicated effector perturbations, expressed as fractional distance along a straight line from centre of nucleus (0) to the plasma membrane (1.0), number of (pixels) plotted given above each scatter, n ≥ 6 cells per condition analysed from 2 independent experiments. Significance: one‐way ANOVA test (relative to RILP only), ***P < 0.001, ns: not significant. (D) Colocalization (Mander's overlap) between Arl8b and Rab7 as a function of the indicated effector perturbations, n ≥ 5 images (3 ≥ cells per image) analysed per condition from 2 independent experiments.
- E
Graphical summary of late compartment segregation as mediated by Rab7 and Arl8b.
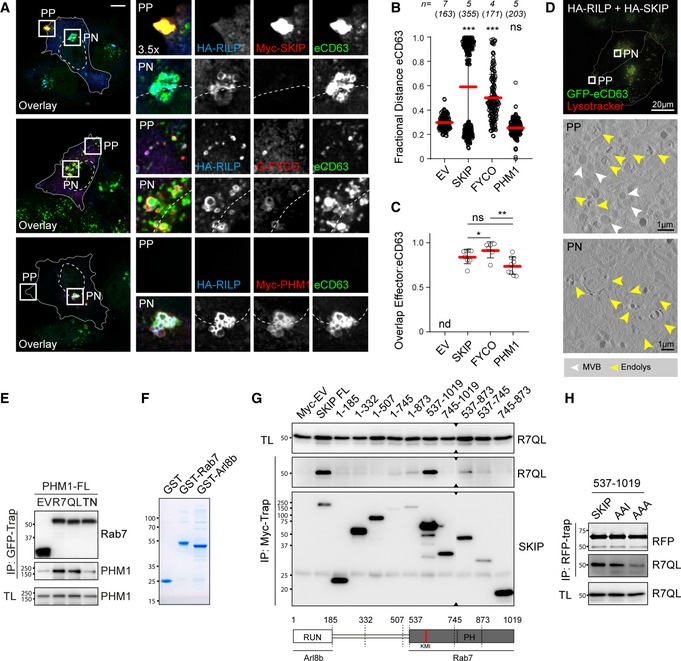
Representative confocal images of fixed HeLa cells ectopically expressing HA‐RILP (blue) in combination with Myc‐SKIP, GFP‐FYCO or Myc‐PLEKHM1 (red), immunolabelled against endogenous CD63 (green) and the indicated epitope tags. Zoom insets (3.5×) highlight select peripheral (PP) and perinuclear (PN) cell regions, scale bar: 10 μm.
Plots of CD63 pixel distribution as a function of various effector perturbations shown in (A) expressed as fractional distance along a straight line from the centre of the nucleus (0) to the cell membrane (1.0), number of (pixels) plotted given above each scatter, n ≥ 4 cells per condition analysed from 2 independent experiments. Significance: one‐way ANOVA (relative to EV), ***P < 0.001, ns: not significant.
Colocalization (Mander's overlap) of the indicated effectors with CD63, n ≥ 6 images (2 ≥ cells per image) per condition analysed from 2 independent experiments. Significance: 2‐tailed Student's t‐test, *P < 0.05, **P < 0.01, ns: not significant, nd: not determined.
Upper panel: wide‐field image of fixed HeLa cells harbouring endogenous CD63 tagged with GFP, co‐transfected with HA‐RILP and HA‐SKIP and labelled with SiR‐lysosome. Selected tomogram slices for peripheral (PP, middle panel) and perinuclear (PN, bottom panel) cell regions are shown (see also Movies EV1 and EV2). Arrowheads designate distinct endosomal subtypes: MVBs (white) and endolysosomes (yellow), scale bars as indicated.
Co‐immunoprecipitations (Co‐IP) of PLEKHM1‐FLAG with GFP‐Rab7 (R7) versus its mutants Q67L (QL) and T22N (TN) from HEK293T cells using GFP‐trap beads. Representative immunoblots against GFP and Flag are shown; EV: empty vector, TL: total lysate.
InstantBlue staining of purified GST, GST‐Rab7 and GST‐Arl8b proteins.
Myc‐SKIP truncation analysis for interactions with GFP‐Rab7 Q67L by Co‐IP from HEK293T cells using Myc‐trap beads. Representative immunoblots against Myc and GFP are shown, along with a schematic representation of SKIP domain organization. Regions of SKIP capable of interacting with Arl8b versus Rab7 are demarcated with solid black lines.
Co‐IP of C‐terminal RFP‐SKIP fragment (aa 537–1,019) versus its KMI motif mutants AAI and AAA with constitutively active GFP‐Rab7 Q67L from HEK293T cells using RFP‐Trap beads. Representative immunoblots against RFP and GFP are shown.
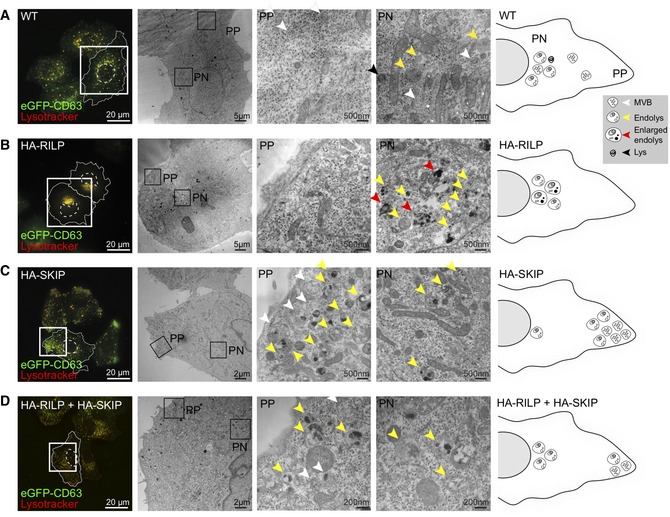
- A–D
Correlative light and electron microscopy (CLEM) on (A) untransfected (WT) HeLa cells harbouring endogenous CD63 labelled with GFP as compared to those ectopically expressing (B) HA‐RILP, (C) HA‐SKIP or (D) both HA‐RILP and HA‐SKIP. Left panels: wide‐field fluorescence images of fixed cells showing endogenous GFP‐CD63 (green) and SiR‐lysosome‐stained endosomes and/or lysosomes (red). Cell and nuclear boundaries are demarcated with solid and dashed lines, respectively, and zoom insets highlight regions selected for EM imaging. Middle panels: overview electron micrographs of perinuclear (PN) and peripheral (PP) cell regions selected for further analysis. Various endolysosomal subtypes are designated by arrowheads: MVBs (white), lysosomes (black), endolysosomes (yellow) and abnormal/enlarged endolysosomes (red). Right panels: graphical representations of endosomal distribution under the indicated conditions based on ultrastructural characterization. Scale bars as indicated (see also Fig EV1D, and Movies EV4 and EV5).
- A
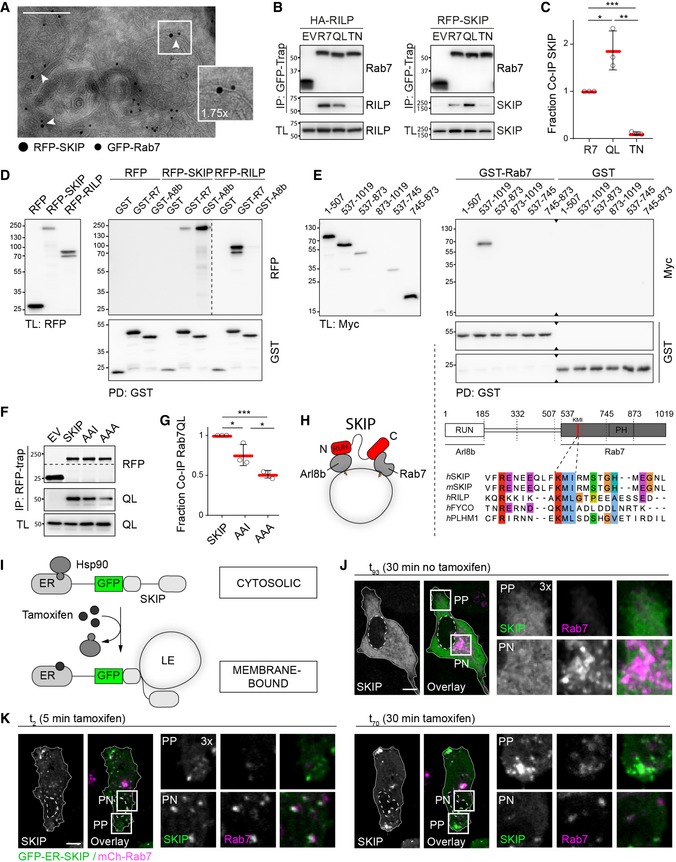
Electron micrograph of sections immunolabelled against RFP‐SKIP (15 nm gold) and GFP‐Rab7 (10 nm gold). Arrowheads and zoom inset (1.75×) highlight presence of RFP‐SKIP and GFP‐Rab7 on the same endosomal membrane, scale bar: 200 nm.
- B
Co‐immunoprecipitations (Co‐IP) of HA‐RILP and RFP‐SKIP with GFP‐Rab7 (R7) versus its mutants Q67L (QL) and T22N (TN) from HEK293T cells using GFP‐trap beads. Representative immunoblots against GFP, HA and RFP are shown, EV: empty vector, IP: immunoprecipitation, TL: total lysate (see also Fig EV1E).
- C
Quantification of interaction between SKIP and Rab7 mutants expressed as fraction Co‐IP relative to wild‐type Rab7, n = 3 independent experiments.
- D, E
In vitro glutathione precipitation assays. (D) Pull‐down (PD) of RFP‐SKIP or RFP‐RILP from HEK293T cell lysates using recombinant GST‐Rab7 versus GST‐Arl8b and free GST. Representative immunoblots against RFP and GST are shown (see also Fig EV1F). (E) SKIP truncation analysis by PD against GST‐Rab7. Top panels: representative immunoblots against Myc and GST (see also Fig EV1G). Bottom panels: schematic representation of SKIP domain organization. Regions of SKIP capable of interacting with Arl8b versus Rab7 are demarcated with solid black lines. An alignment of human (h) and murine (m) SKIP sequences to known effectors of Rab7 surrounding the conserved KML/I effector motif at residues 610–612 of SKIP is provided.
- F, G
Co‐IP of RFP‐SKIP versus its KMI motif mutants AAI and AAA with constitutively active GFP‐Rab7 Q67L using RFP‐trap beads (see also Fig EV1H). (F) Representative immunoblots against GFP and RFP. (G) Quantification of interaction between SKIP mutants with Rab7 expressed as fraction Co‐IP relative to wild‐type SKIP, n = 3 independent experiments.
- H
Graphical summary of SKIP as a dual effector of Arl8b and Rab7.
- I–K
Time‐lapse of SKIP‐mediated transport of late endosomes. (I) Schematic representation of tamoxifen‐induced activation of SKIP onto endosomal membranes. (J, K) Live HeLa cells co‐expressing GFP‐ER‐SKIP (green) and mCherry‐Rab7 (magenta) together with HA‐RILP (unstained) expressed at low levels (cells transfected at 1:5 RILP:SKIP ratio) were imaged in the (J) absence or (K) presence of tamoxifen, allowing on‐demand association of SKIP with endosomal membranes. Confocal frames from time‐lapses taken at the indicated time points following treatment are shown. Cell and nuclear boundaries are demarcated with solid and dashed lines, respectively, and zoom insets (3×) highlight select peripheral (PP) and perinuclear (PN) cell regions, scale bars: 10 μm (see also Movies [Link], [Link], [Link]).
- A–C
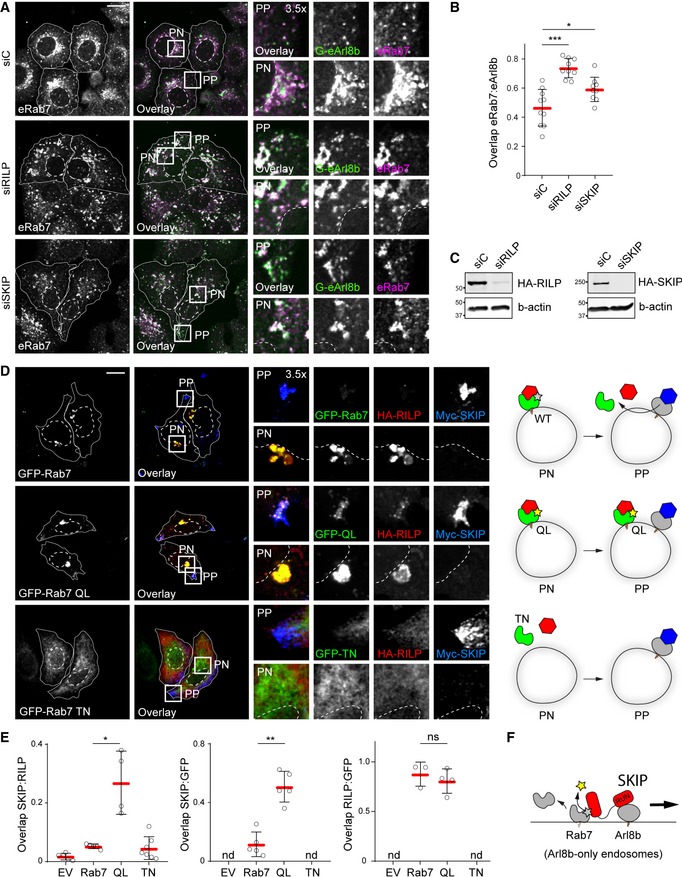
Consequences of effector depletion on the endogenous Arl8b/Rab7 hybrid compartment. (A) Representative confocal images of fixed HeLa cells harbouring GFP‐tagged endogenous Arl8b (G‐eArl8b, green), transfected with the indicated siRNAs and immunolabelled against endogenous Rab7 (eRab7, magenta). (B) Colocalization (Mander's overlap) between endogenous Arl8b and Rab7 in response to effector depletion, n siC = 10, n siRILP = 9, n siSKIP = 9 images (4 ≥ cells per image) analysed from 2 independent experiments. (C) Immunoblot analysis for depletion efficiency of SKIP and RILP, with actin as loading control.
- D, E
Effect of Rab7 GTPase activity status on its association with the peripheral SKIP compartment. (D) Left panels: Representative confocal images of fixed HeLa cells expressing GFP‐Rab7 or its mutants Q67L or T22N (green) together with HA‐RILP (red) and Myc‐SKIP (blue), immunolabelled against the indicated epitope tags. Right panels: Schematic overview per condition. (E) Colocalization (Mander's overlap) between the indicated protein pairs, n Rab7 = 5, n QL = 5, n TN = 7 images (2 ≥ cells per image) analysed from 2 independent experiments.
- F
Graphical summary of Rab7 removal from the SKIP compartment.
- A–C
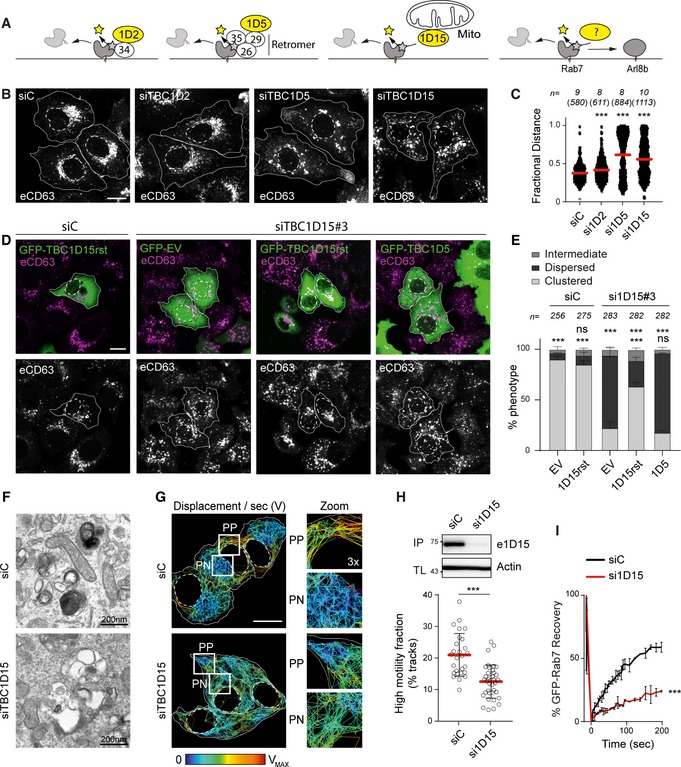
Identification of a Rab7 GAP that promotes endolysosomal system's bilateral architecture along the PN/PP axis. (A) Graphical summary depicting the functions of 3 known TBC domain‐containing GAPs for Rab7. (B) Representative confocal images of fixed HeLa cells depleted of TBC1D2, 1D5 or 1D15 using siRNA oligo pools and immunolabelled against CD63 (white), scale bar: 10 μm. (C) Plot of CD63 pixel distribution as a function of TBC1D2/1D5/1D15 depletion expressed as fractional distance along a straight line from centre of nucleus (0) to the plasma membrane (1.0), number of (pixels) plotted given above each scatter, n ≥ 8 cells per condition analysed from 2 independent experiments. Significance: one‐way ANOVA test (relative to siC), ***P < 0.001 (see also Fig EV2A and B).
- D, E
Rescue of TBC1D15 depletion phenotype. (D) Representative confocal images of fixed HeLa cells transfected with either control siRNA (siC) or oligo #3 targeting TBC1D15 (siTBC1D15) and ectopically expressing either GFP‐EV, GFP‐TBC1D5 or siRNA‐resistant GFP‐TBC1D15res (green), immunolabelled for CD63 (magenta), scale bar: 10 μm. (E) Quantification of rescue expressed as % cells (average) in the population exhibiting one of 3 phenotypes: clustered, dispersed or intermediate; total numbers of cells analysed per condition appear above each bar, n = 3 independent experiments. Significance (based on clustered phenotype): one‐way ANOVA test relative to either siC/EV (top row) or si1D15/EV (bottom row), ***P < 0.001, ns: not significant.
- F–H
Effects of TBC1D15 depletion on the morphology and dynamics of late organelles. (F) Representative electron micrographs of fixed HeLa cells transfected with either control siRNA (siC) or a pool of oligos targeting TBC1D15 (siTBC1D15) are shown, scale bars as indicated. (G) Analysis of late compartment dynamics as a function of TBC1D15 depletion. Tracks followed by SiR lysosome‐positive vesicles during a time‐lapse lasting 255 s (5 s per frame), with highest displacement rates for each track depicted on a rainbow colour scale (blue: immobile; red: maximum mobility per time interval). Zoom insets (3×) highlight select peripheral (PP) and perinuclear (PN) regions, scale bar: 10 μm (see also Movies EV9 and EV10). (H) Quantification of high motility fraction (% tracks with displacement rates above 0.9 μm/s), n siC = 27, n si1D15 = 37 images (2 ≥ cells per image) analysed from 2 independent experiments. Effectiveness of TBC1D15 (si1D15) depletion is confirmed by immunoblot (also appearing in Fig EV2A) against endogenous TBC1D15 (e1D15) following its immunoprecipitation (IP), TL: total lysate.
- I
FRAP of GFP‐Rab7 in live HeLa cells transfected with either control siRNA (siC, black line) or a pool of oligos targeting TBC1D15 (si1D15, red line). Plotted is average GFP‐Rab7 signal recovery during 200 s following bleaching, expressed as % of pre‐bleach signal, n = 3 bleach regions per sample.
- A–C
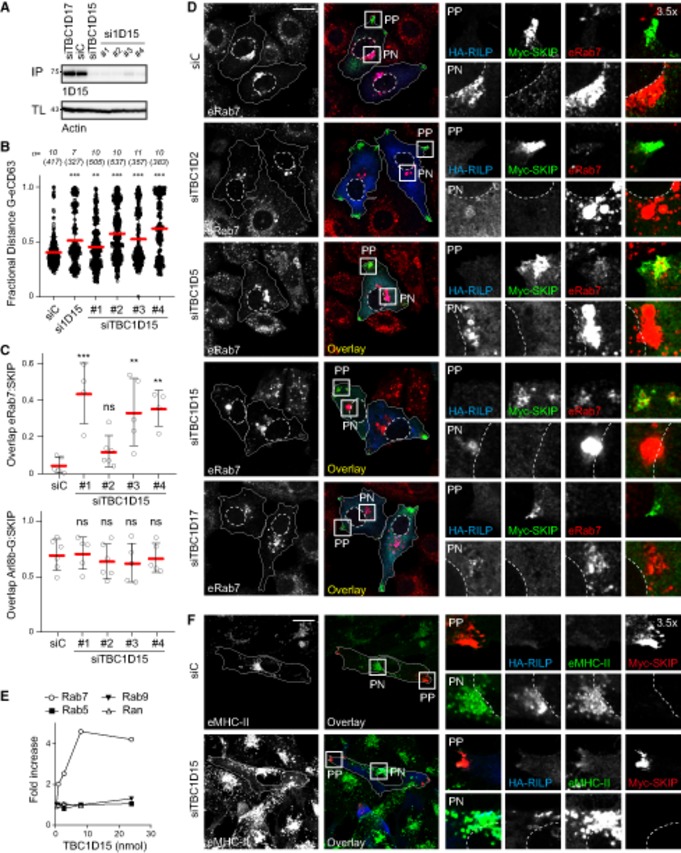
Consequences of TBC1D15 depletion for the organization of late compartments. (A) Effectiveness of TBC1D15 (pool and single duplexes #1–#4) and TBC1D17 (pool) targeting siRNA oligos as assayed by immunoblot of total lysates (TL) following immunoprecipitation (IP) against TBC1D15. (B) Plots of CD63 pixel distribution as a function of TBC1D15 depletion (pool and single duplexes #1–#4) expressed as fractional distance along a straight line from the centre of the nucleus (0) to the cell membrane (1.0), number of (pixels) plotted given above each scatter, n ≥ 7 cells analysed per condition from 2 independent experiments. Significance: one‐way ANOVA (relative to siC), **P < 0.01, ***P < 0.001. (C) Colocalization (Mander's overlap) of endogenous Rab7 (top graph) versus Arl8b‐GFP (bottom graph) with Myc‐SKIP in response to TBC1D15 depletion, n ≥ 4 images, 2 ≥ cells per image, analysed from 2 independent experiments. Significance: one‐way ANOVA (relative to siC), **P < 0.01, ***P < 0.001, ns: not significant.
- D
Effects of depleting different Rab7 GAPs on late compartment segregation. Representative confocal images of fixed HeLa cells transfected with either control siRNA (siC) or oligo pools targeting TBC1D2, TBC1D5, TBC1D15 or TBC1D17 and ectopically expressing HA‐RILP (blue) and Myc‐SKIP (green), immunolabelled against endogenous Rab7 (eRab7, red) and relevant epitope tags.
- E
In vitro GAP assay showing the effect on γ32P‐GTP hydrolysis with increasing concentration of purified TBC domain of TBC1D15 on γ32P‐GTP loaded Rab7, Rab5, Ran and Rab9 GTPases. Plotted are hydrolysis rates relative to no TBC1D15 added (1.0).
- F
Effects of TBC1D15 depletion on trafficking of Rab7‐dependent cargo MHC‐II to the SKIP‐positive compartment. Representative images of fixed MelJuSo cells transfected with either control siRNA (siC) or a pool of oligos targeting TBC1D15 (siTBC1D15) and ectopically expressing Myc‐SKIP (red) and HA‐RILP (blue), immunostained against MHC‐II (green) and relevant epitope tags.
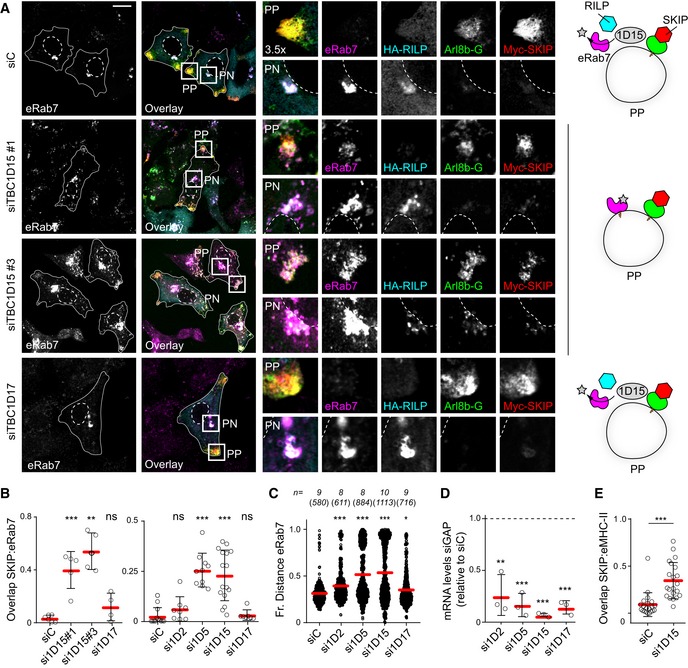
- A–D
Effects of depleting known GAPs for Rab7 on late compartment segregation mediated by RILP and SKIP. (A) Representative confocal images of fixed HeLa cells transfected with either control siRNA (siC), two different siRNA oligos targeting TBC1D15 (#1 and #3) or oligo pool targeting TBC1D17 and ectopically expressing GFP‐Arl8b (green) in combination with HA‐RILP (cyan) and Myc‐SKIP (red), immunolabelled against endogenous Rab7 (eRab7, magenta) and the indicated epitope tags. Cell and nuclear boundaries are demarcated with solid and dashed lines, respectively, and zoom insets (3.5×) highlight select peripheral (PP) and perinuclear (PN) cell regions, scale bar: 10 μm. Graphical summaries appear on the right of each condition. (B) Colocalization of SKIP with endogenous Rab7 (Mander's overlap) in response to depletion of TBC‐containing proteins, n ≥ 4 images (3 ≥ cells per image) analysed per condition from 2 or more independent experiments (see also Fig EV2C). (C) Plot of Rab7‐positive pixel distribution expressed as fractional distance along a straight line from centre of nucleus (0) to the plasma membrane (1.0), number of (pixels) plotted given above each scatter, n ≥ 8 cells analysed per condition from 2 independent experiments. (D) Validation of depletion efficiencies expressed as fraction of the indicated mRNA remaining relative to siC assayed by qPCR, n = 3 independent experiments.
- E
Effect of TBC1D15 depletion on Rab7‐dependent MHC‐II receptor trafficking to the SKIP‐positive compartment, n siC = 21, n si1D15 = 21 cells analysed from 3 independent experiments (see also Fig EV2F). Significance: two‐tailed Student's t‐test, ***P < 0.001.
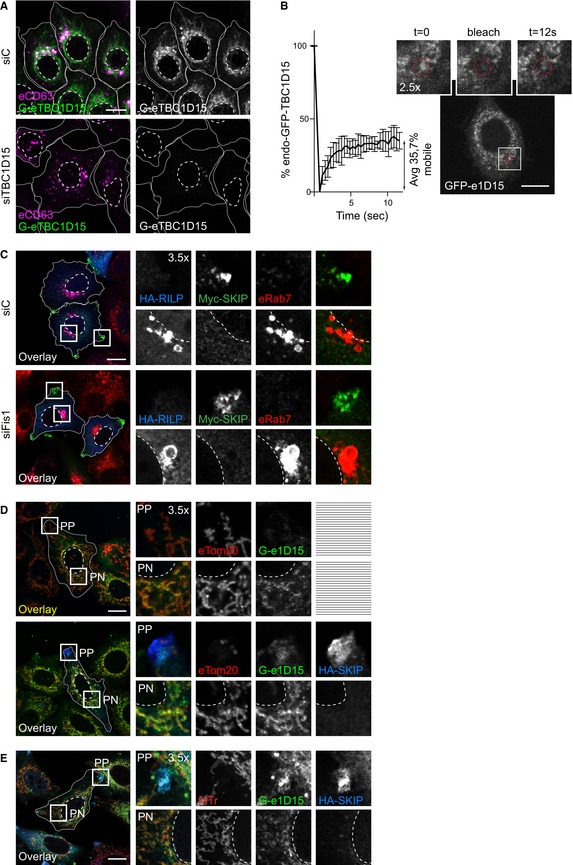
- A
Validation of endogenously GFP‐tagged TBC1D15 in HeLa cells. Representative confocal images of eTBC1D15 (green) HeLa cells transfected with either control siRNA (siC) or a pool of oligos targeting TBC1D15 (siTBC1D15), fixed and immunostained against CD63 (magenta).
- B
Fluorescence recovery after photobleaching (FRAP) of endogenous GFP‐tagged TBC1D15 in HeLa cells. Left panel: per cent of GFP signal recovery over time, n = 3 cells analysed from a representative experiment, error bars reflect ± SD. Right panels: representative images taken at the indicated time points, and zoom insets (2.5×) highlight the bleach region.
- C
Representative confocal images of either control (siC) HeLa cells or those depleted of FIS1 using a pool of siRNA oligos (siFIS1) and ectopically expressing HA‐RILP (blue) and Myc‐SKIP (green), fixed and immunolabelled for endogenous Rab7 (red) and relevant epitope tags.
- D, E
Representative confocal images of fixed HeLa cells expressing endogenous GFP‐tagged GFP‐TBC1D15 (e1D15, green) in the presence or absence of HA‐SKIP (blue), immunostained against HA and (D) Tom20 (red) or (E) labelled using Mitotracker (red).
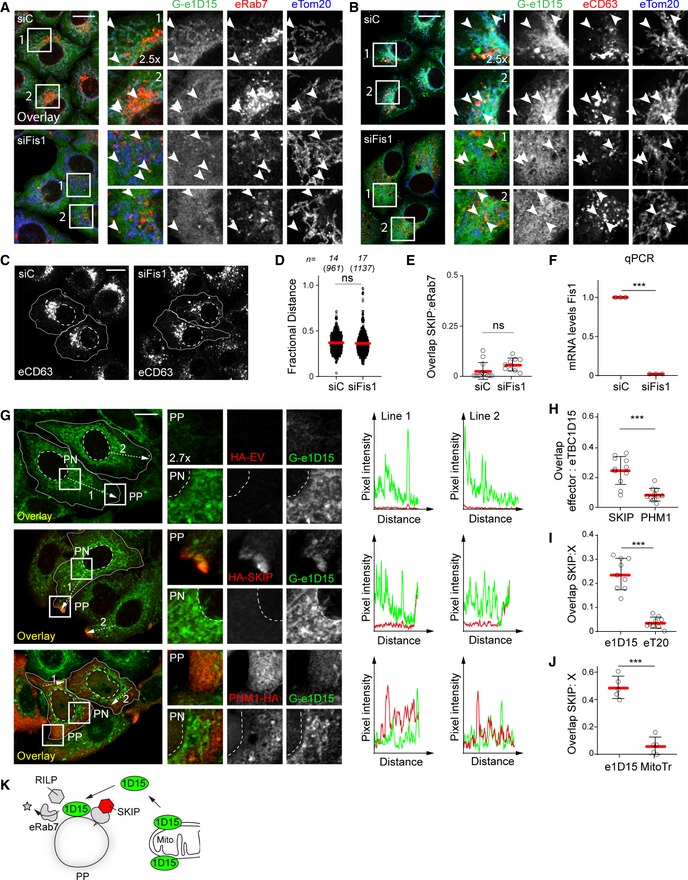
- A, B
Representative confocal images of either control (siC) HeLa cells harbouring endogenous TBC1D15 tagged with GFP (Ge1D15, green) or those depleted of FIS1 using a pool of siRNA oligos, fixed and immunolabelled for the mitochondrial marker TOM20 (blue) in combination with either endogenous (A) Rab7 or (B) CD63 (red). Zoom insets (2.5×) highlight select cell regions, arrowheads point to vesicles positive for TBC1D15 and negative for TOM20 (yellow).
- C–F
Effect of FIS1 on late compartment distribution. (C) Representative confocal images of fixed HeLa cells depleted of FIS1 using a siRNA oligo pool and immunolabelled against CD63 (white). (D) Plot of CD63 pixel distribution as a function of FIS1 depletion expressed as fractional distance along a straight line from centre of nucleus (0) to the plasma membrane (1.0), number of (pixels) plotted given above each scatter, n siC = 14, n siFis1 = 17 cells analysed from 2 independent experiments. (E) Colocalization of SKIP with endogenous Rab7 (Mander's overlap) in response to FIS1 depletion, n siC = 13, n siFis1 = 9 images (3 ≥ cells per image) analysed from 2 independent experiments (see also Fig EV2C). (F) Validation of FIS1 depletion efficiency assayed by qPCR and expressed as fraction FIS1 mRNA remaining relative to siC, n = 3 independent experiments.
- G–J
Recruitment of endogenous TBC1D15 to the SKIP compartment. (G) Left panels: representative confocal images of fixed HeLa cells harbouring endogenous TBC1D15 tagged with GFP (G‐e1D15, green) and ectopically expressing either empty vector, HA‐SKIP or PLEKHM1‐HA (red), immunolabelled against HA. Zoom insets (2.7×) highlight select peripheral (PP) and perinuclear (PN) cell regions. Right panels: pixel plots of endogenous GFP‐TBC1D15 (green line) and HA signals (red line) corresponding to the dashed white lines in (G). (H–J) Colocalization (Mander's overlap) between the indicated pairs of proteins, n ≥ 5 images, 3 ≥ cells per image, analysed per condition from 2 independent experiments (see also Fig EV3D and E).
- K
Graphical summary of TBC1D15 recruitment to SKIP.
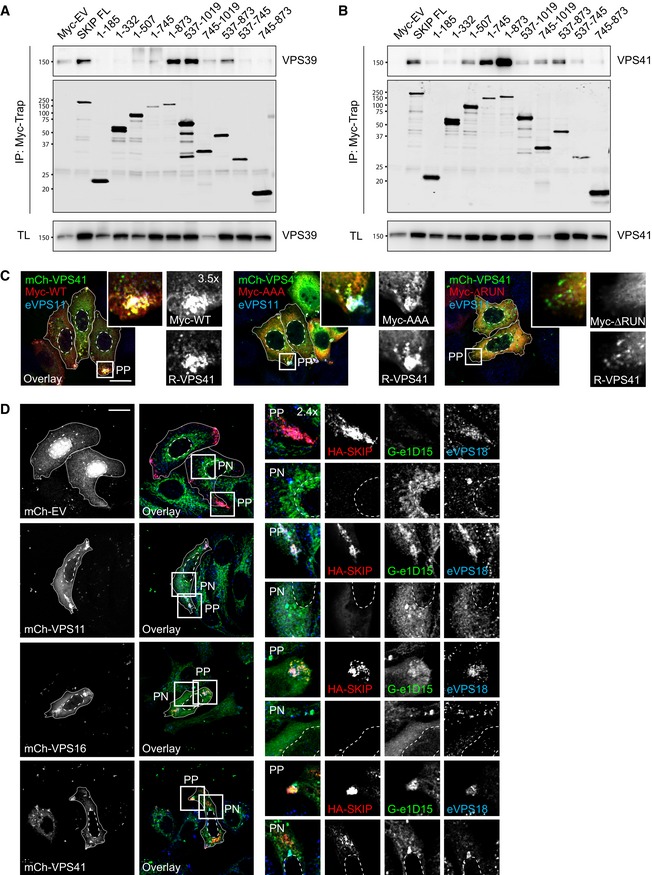
- A, B
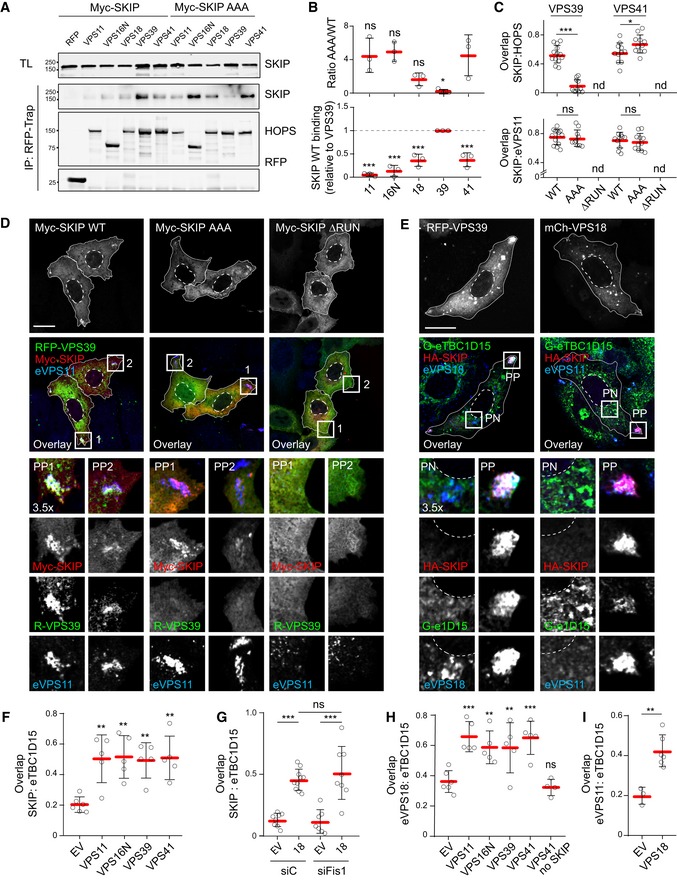
Analysis of HOPS/SKIP interactions by Co‐IP of Myc‐SKIP truncations with (A) RFP‐VPS39 or (B) mCherry‐VPS41 from HEK293T cells using Myc‐trap beads. Representative immunoblots against RFP/mCherry and Myc are shown.
- C
Effects of Rab7 and/or Arl8b interactions on the SKIP compartment. Representative confocal images of fixed HeLa cells ectopically expressing Myc‐SKIP (red), KMI motif mutant (AAA) or RUN domain truncation mutant (ΔRUN) together with mCherry‐VPS41 (green), immunolabelled for endogenous VPS11 (eVPS11, blue). Zoom insets (3.5×) highlight select peripheral (PP) cell regions.
- D
Effect of HOPS complex member overexpression on recruitment of eTBC1D15 to SKIP. Representative confocal images of fixed HeLa cells harbouring endogenous GFP‐TBC1D15 (G‐e1D15, green) and transfected with HA‐SKIP (red) and either mCherry‐VPS11, VPS16 or VPS41 (white), immunostained against endogenous VPS18 (eVPS18, blue) and HA. Zoom insets (2.4×) highlight select peripheral (PP) and perinuclear (PN) cell regions.
- A–D
Effects of SKIP KMI motif on HOPS complex recruitment. (A) Analysis of SKIP/HOPS interactions by co‐IP of RFP/mCherry‐HOPS subunits with Myc‐SKIP versus the KMI motif mutant AAA from HEK293T cells using RFP‐trap beads. Representative immunoblots against RFP and Myc are shown, IP: immunoprecipitation, TL: total lysate. (B) Quantification of SKIP/HOPS interactions, n = 3 independent experiments. Top graph: fold change in binding of HOPS subunits to AAA mutant relative to wild type (WT) SKIP (1.0), significance: one‐way ANOVA test (relative to VPS41). Bottom graph: Co‐IP per HOPS subunit relative to VPS39, significance: one‐way ANOVA test (relative to VPS39), *P < 0.05, ***P < 0.001, ns: not significant. (C) Colocalization (Mander's overlap) between SKIP and RFP‐VPS39 (images shown in D) or mCherry‐VPS41 (images shown in Fig EV4C), n ≥ 10 images (2 ≥ cells per image) analysed per condition from 2 independent experiments. (D) Representative confocal images of fixed HeLa cells ectopically expressing Myc‐SKIP, KMI motif mutant (AAA) or RUN domain truncation mutant (ΔRUN) (red) together with RFP‐VPS39 (green), immunolabelled for endogenous VPS11 (eVPS11, blue).
- E–I
Effect of HOPS overexpression on recruitment of TBC1D15 to the SKIP compartment. (E) Representative confocal images of fixed HeLa cells harbouring endogenous GFP‐TBC1D15 (Ge1D15, green) and ectopically expressing HA‐SKIP (red) together with mCh‐VPS18 or RFP‐VPS39 (white), immunolabelled for endogenous VPS18 or VPS11 (blue), as indicated (see also Fig EV4D). (F–I) Colocalization of SKIP and HOPS complex with TBC1D15 as a function of HOPS subunit overexpression. (F, H) Mander's overlap between (F) SKIP or (H) eVPS18 and endogenous TBC1D15, n ≥ 5 images (2 ≥ cells per image) analysed per condition from 2 independent experiments, significance: one‐way ANOVA test (relative to EV), **P < 0.01, ***P < 0.001, ns: not significant. (G, I) Mander's overlap between (G) SKIP or (I) eVPS11 and endogenous TBC1D15 as a function VPS18 overabundance, with or without FIS1 depletion (siFIS1), n ≥ 3 images (2 ≥ cells per image) analysed per condition from 2 or more independent experiments.
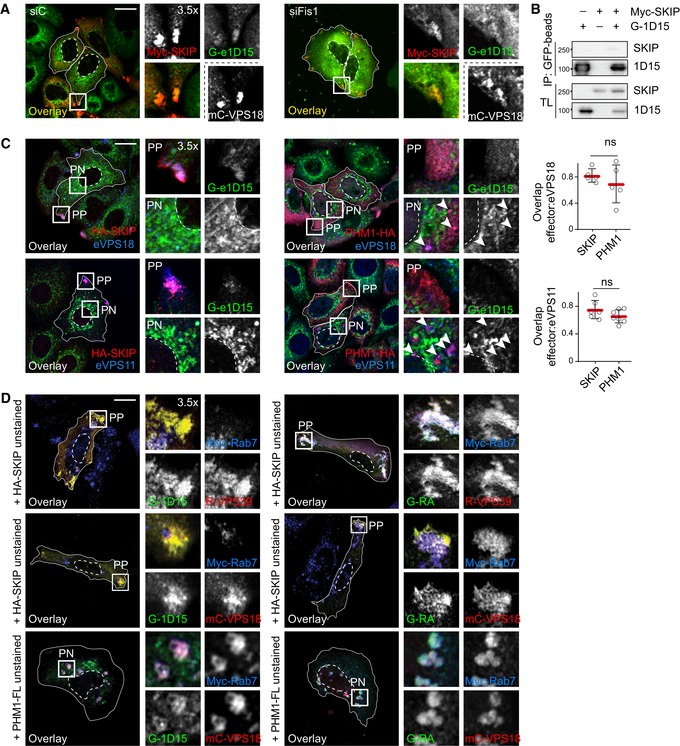
Effect of FIS1 depletion on recruitment of TBC1D15 to the SKIP/HOPS complex. Representative confocal images of either control (siC) HeLa cells harbouring endogenous TBC1D15 tagged with GFP (G‐e1D15, green) or those depleted of FIS1 using a pool of siRNA oligos, expressing Myc‐SKIP (red) and mCherry‐VPS18, fixed and immunolabelled for Myc.
Co‐immunoprecipitations (Co‐IP) of Myc‐SKIP with GFP‐TBC1D15 (1D15) from HEK293T cells using GFP‐trap beads. Representative immunoblots against Myc and GFP are shown, TL: total lysate.
Effect of HOPS complex member overexpression on recruitment of eTBC1D15 to different Rab7 effectors. Representative confocal images of fixed HeLa cells harbouring endogenous GFP‐TBC1D15 (G‐e1D15, green), transfected with HA‐SKIP or PLEKHM1‐HA (red), immunostained against endogenous (e) VPS18 (blue, upper panels) or VPS11 (blue, bottom panels) and HA. Arrowheads point at PLEKHM1/HOPS‐positive, TBC1D15‐negative structures. Graphs report fraction overlap (Mander's coefficient) between the indicated Rab7 effectors and endogenous VPS18 or VPS11. Red line: mean of sample values (open circles), n ≥ 5 images, 2 ≥ cells per image, analysed from 2 independent experiments, error bars reflect ± SD. Significance: two‐tailed Student's t‐test, ns: not significant.
Representative confocal images of fixed HeLa cells ectopically expressing HA‐SKIP (upper and middle panels, unstained) or PLEKHM1‐FLAG (bottom panels, unstained) together with RFP‐VPS39 (upper panels, red) or mCherry‐VPS18 (middle and bottom panels, red), Myc‐Rab7 (blue), and either GFP‐TBC1D15 wild type (WT) or its inactive point mutant R417A (RA) (green), immunostained against Myc.
- A, B
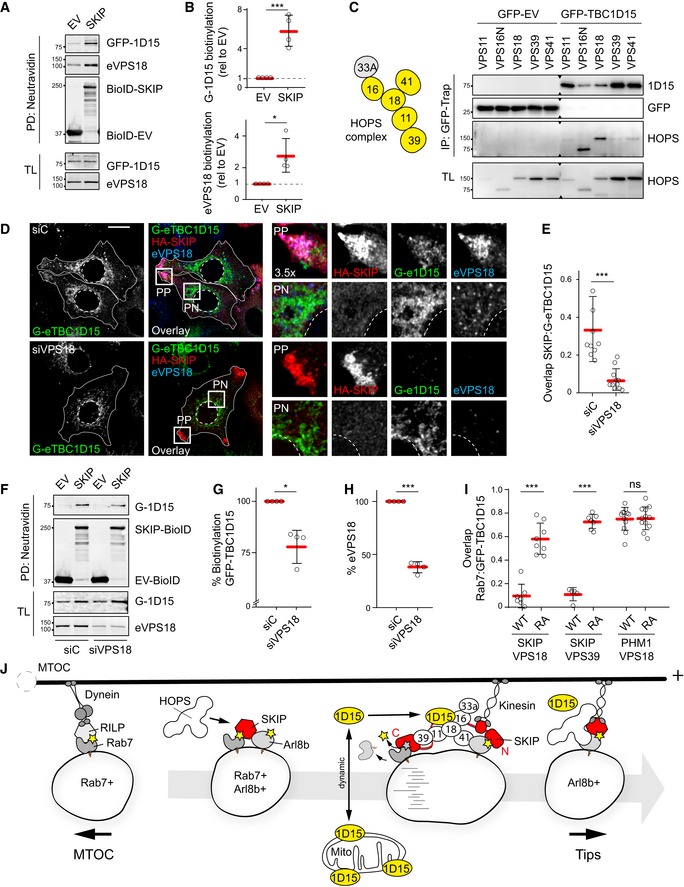
In situ SKIP/TBC1D15 complex formation assayed using proximity‐based biotin ligation (BioID). (A) Neutravidin precipitates (PD) from biotin‐treated HEK293T cells ectopically expressing GFP‐TBC1D15 (GFP‐1D15) together with HA‐BioID‐SKIP or HA‐BioID‐EV. Representative immunoblots against GFP, HA and VPS18 are shown, TL: total lysate. (B) Quantification of biotinylation of GFP‐TBC1D15 (top graph) and endogenous VPS18 (eVPS18, bottom graph) by BioID‐SKIP, expressed relative to BioID‐EV (1.0), n = 4 independent experiments.
- C
Analysis of TBC1D15/HOPS interactions by co‐IP of RFP/mCherry‐HOPS subunits with GFP‐TBC1D15 from HEK293T cells using GFP‐trap beads. Left panel: schematic of HOPS complex composition, with subunits tested marked in yellow. Right panel: representative immunoblots against GFP and RFP; IP: immunoprecipitation, TL: total lysate.
- D–H
Effects of VPS18 depletion on the recruitment of TBC1D15 to the SKIP complex. (D) Representative confocal images of fixed HeLa cells harbouring endogenous GFP‐TBC1D15 (G‐e1D15, green), transfected with either control siRNA (siC) or oligo pool targeting VPS18 (siVPS18) and ectopically expressing HA‐SKIP (red), immunolabelled against endogenous VPS18 (eVPS18, blue) and HA, scale bar: 10 μm. Cell and nuclear boundaries are demarcated with solid and dashed lines, respectively, and zoom insets (3.5×) highlight select peripheral (PP) and perinuclear (PN) cell regions. (E) Colocalization (Mander's overlap) between SKIP and endogenous TBC1D15 as a function of VPS18 depletion, n siC = 9, n siVPS18 = 11 images (2 ≥ cells per image) analysed from 2 independent experiments. (F) Neutravidin precipitates (PD) from biotin‐treated HeLa cells ectopically expressing GFP‐TBC1D15 (GFP‐1D15) together with BioID‐SKIP or BioID‐EV. Representative immunoblots against GFP, HA and VPS18 are shown, TL: total lysate. (G) Quantification of GFP‐TBC1D15 biotinylation by BioID‐SKIP over BioID‐EV in response to VPS18 depletion expressed as % of control (siC), n = 4 independent experiments performed in HeLa or HEK293T cells. (H) Quantification of VPS18 protein abundance from experiments in G, n = 4.
- I
Effect of TBC1D15 activity on Rab7 displacement from the SKIP compartment. Colocalization (Mander's overlap) between Rab7 and TBC1D15 (WT or R417A mutant) in the presence of either SKIP or PLEKHM1 combined with the indicated VPS proteins, n ≥ 5 images (2 ≥ cells per image) analysed from 2 independent experiments (see also Fig EV5D).
- J
Proposed model. Left panel: active (yellow star) membrane‐bound Rab7 can partner with its effector RILP to mediate dynein‐dependent minus‐end‐directed transport of late endosomes and/or lysosomes into the perinuclear region, towards the microtubule organizing centre (MTOC). Left middle panel: a subpopulation of Rab7‐positive vesicles acquires Arl8b, forming a hybrid identity compartment. Arl8b in turn recruits the effector SKIP through the N‐terminal RUN domain (red), as well as VPS41 and the core HOPS subunits to endosomes. Right middle panel: SKIP is now in the position to engage Rab7 using its C‐terminal segment featuring the KMI motif. This promotes acquisition of VPS39 and reconstitution of the HOPS complex, providing a platform for recruitment of the Rab7 GAP TBC1D15 (yellow) not associated with mitochondrial membranes. Right panel: the resulting Arl8b/SKIP/HOPS/TBC1D15 complex induces inactivation (grey star) and removal of Rab7 from the membrane, while maintaining Arl8b/SKIP identity and liberating the endosome for kinesin‐dependent transport towards the microtubule plus‐end, into the cell periphery. Regulated disengagement of Rab7 thus enables orderly selection of transport route.
References
-
- Bakker J, Spits M, Neefjes J, Berlin I (2017) The EGFR odyssey – from activation to destruction in space and time. J Cell Sci 130: 4087–4096 - PubMed
-
- Balderhaar HJ, Ungermann C (2013) CORVET and HOPS tethering complexes – coordinators of endosome and lysosome fusion. J Cell Sci 126: 1307–1316 - PubMed
-
- Bento CF, Puri C, Moreau K, Rubinsztein DC (2013) The role of membrane‐trafficking small GTPases in the regulation of autophagy. J Cell Sci 126: 1059–1069 - PubMed
Publication types
MeSH terms
Substances
Grants and funding
LinkOut - more resources
Full Text Sources
Other Literature Sources
Research Materials
Miscellaneous
