

Cortical responses to auditory novelty across task conditions: An intracranial electrophysiology study
- PMID: 32081413
- PMCID: PMC7417283
- DOI: 10.1016/j.heares.2020.107911
Cortical responses to auditory novelty across task conditions: An intracranial electrophysiology study
Abstract
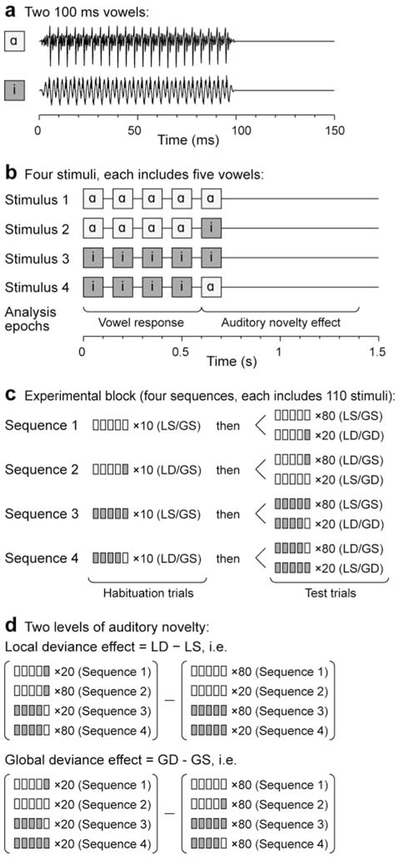
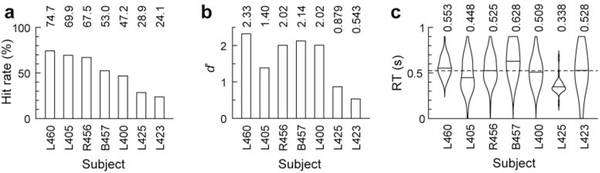
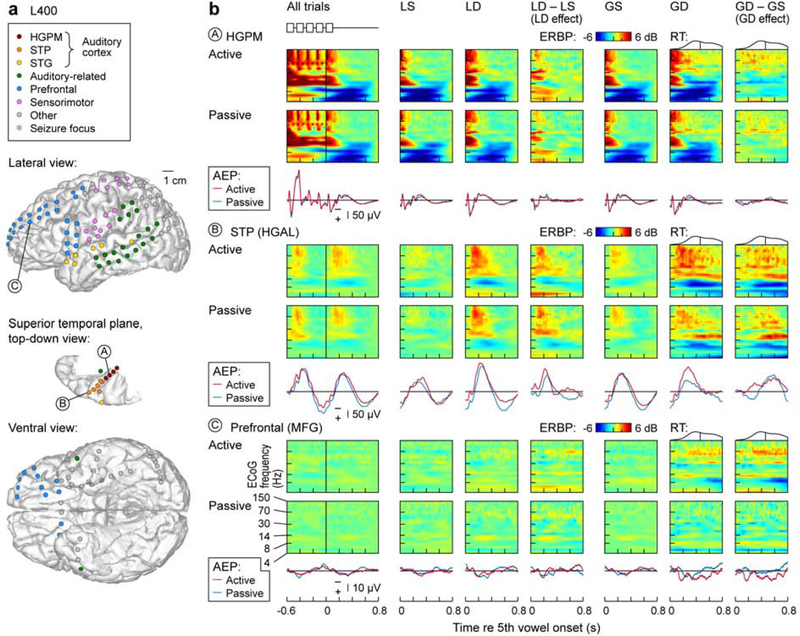
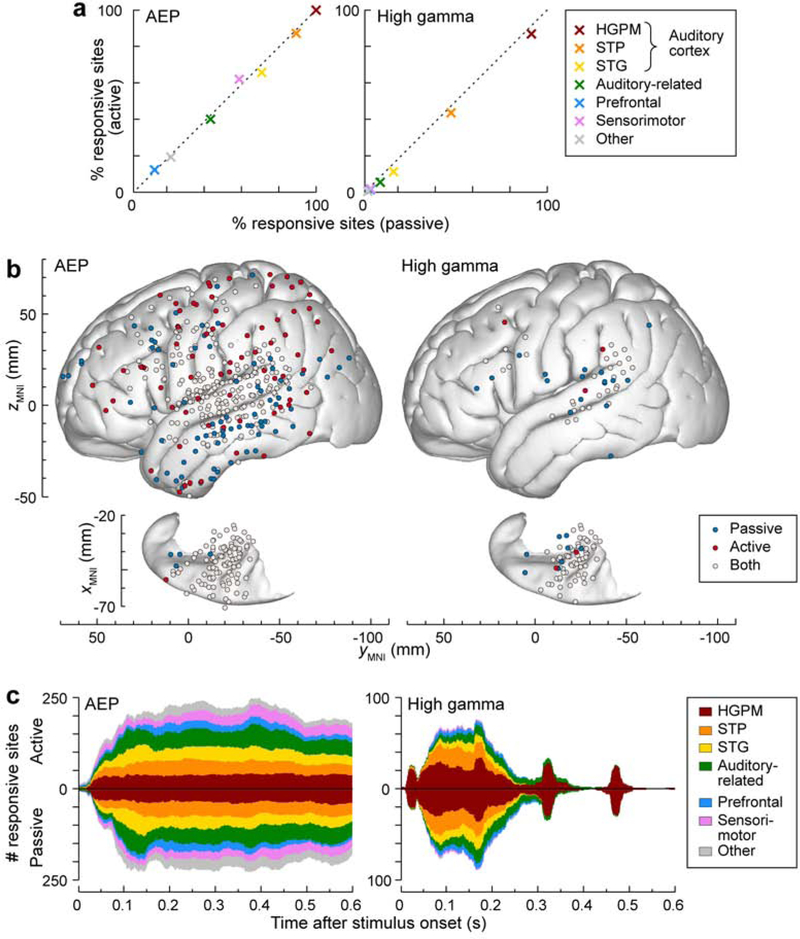
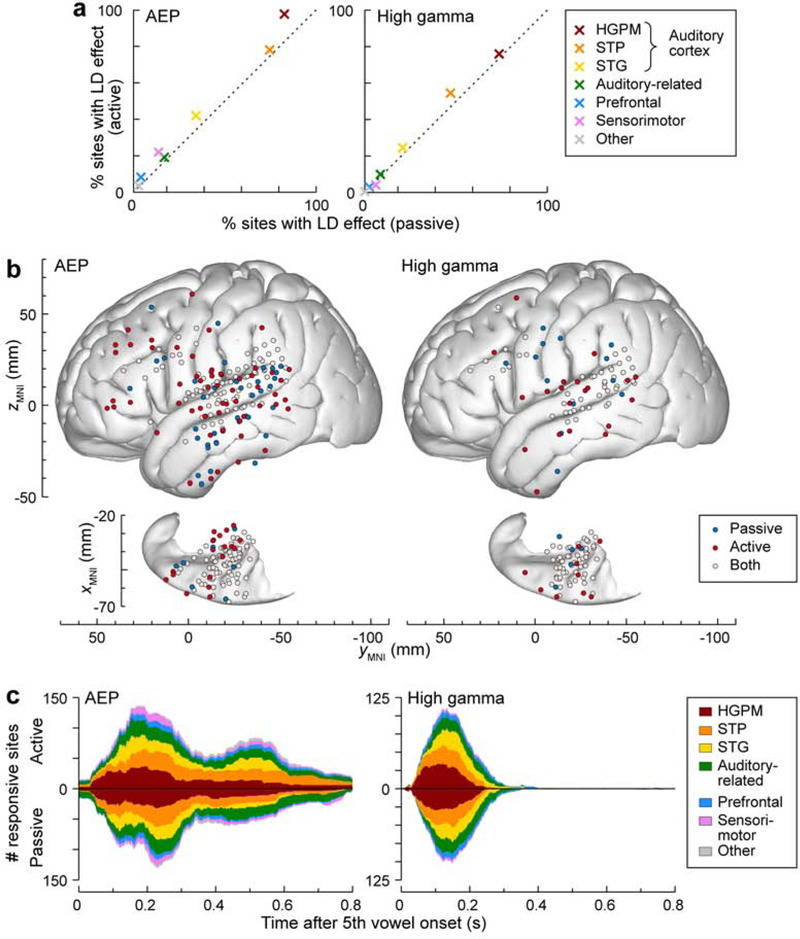
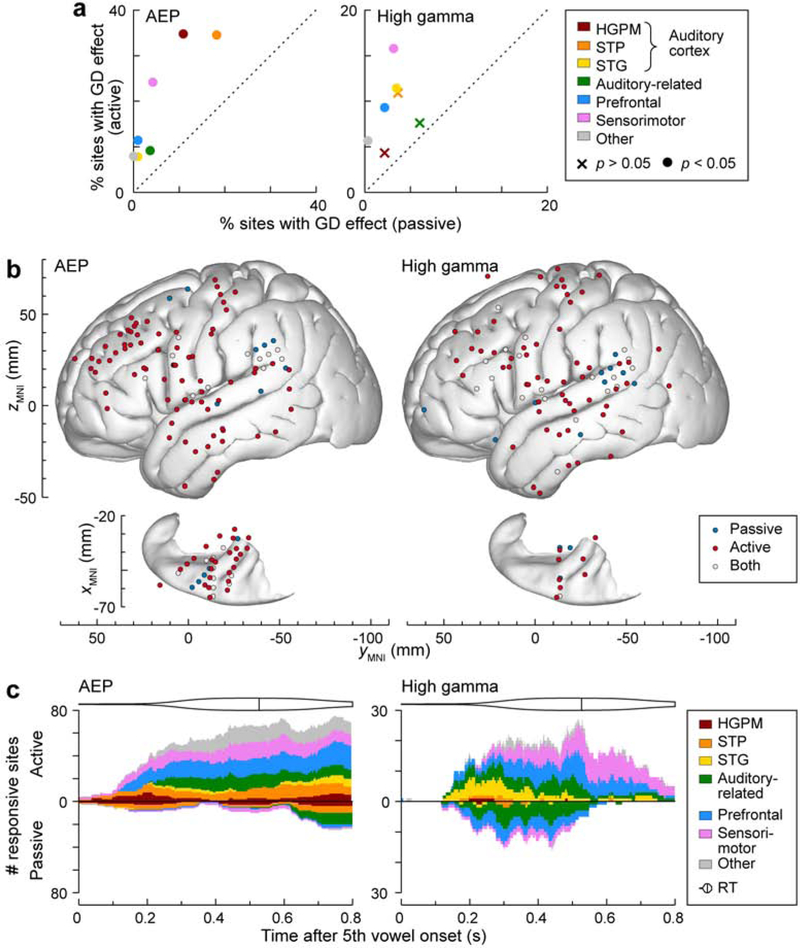
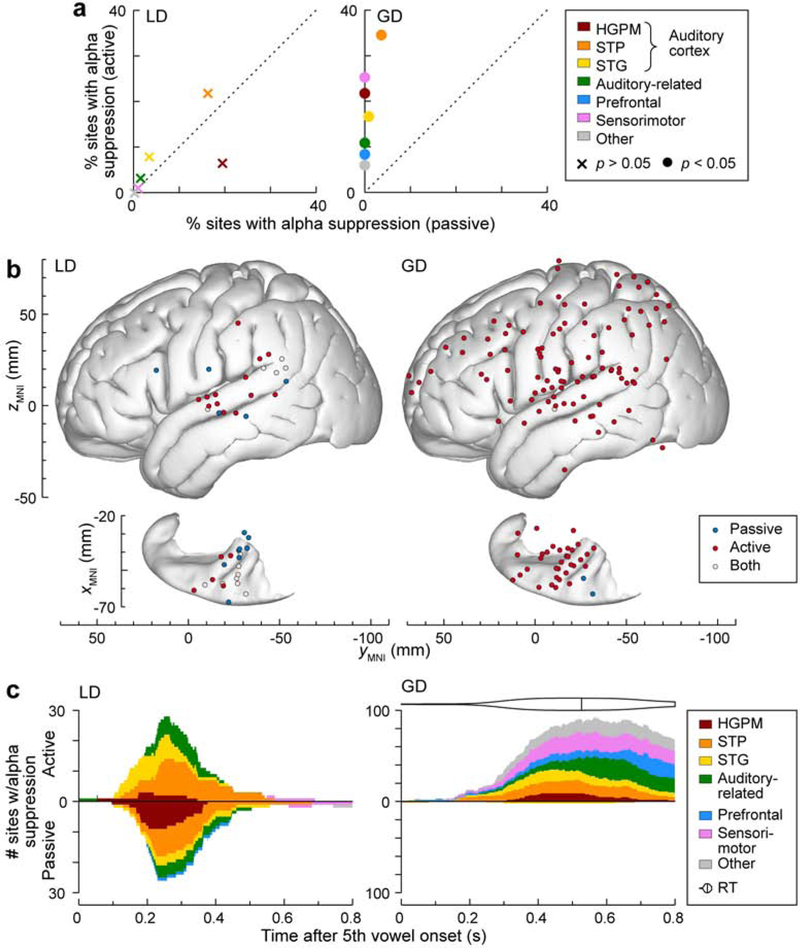
Elucidating changes in sensory processing across attentional and arousal states is a major focus in neuroscience. The local/global deviant (LGD) stimulus paradigm engages auditory predictive coding over short (local deviance, LD) and long (global deviance, GD) time scales, and has been used to assay disruption of auditory predictive coding upon loss of consciousness. Our previous work (Nourski et al., 2018, J Neurosci 38:8441-52) examined effects of general anesthesia on short- and long-term novelty detection. GD effects were suppressed at subhypnotic doses of propofol, suggesting that they may be more related to task engagement than consciousness per se. The present study addressed this hypothesis by comparing cortical responses to auditory novelty during passive versus active listening conditions in awake listeners. Subjects were seven adult neurosurgical patients undergoing chronic invasive monitoring for medically intractable epilepsy. LGD stimuli were sequences of four identical vowels followed by a fifth identical or different vowel. In the passive condition, the stimuli were presented to subjects as they watched a silent TV program and were instructed to attend to its content. In the active condition, stimuli were presented in the absence of a TV program, and subjects were instructed to press a button in response to GD target stimuli. Intracranial recordings were made from multiple brain regions, including core and non-core auditory, auditory-related, prefrontal and sensorimotor cortex. Metrics of task performance included hit rate, sensitivity index, and reaction times. Cortical activity was measured as averaged auditory evoked potentials (AEPs) and event-related band power in high gamma (70-150 Hz) and alpha (8-14 Hz) frequency bands. The vowel stimuli and LD elicited robust AEPs in all studied brain areas in both passive and active conditions. High gamma responses to stimulus onset and LD were localized predominantly to the auditory cortex in the superior temporal plane and had a comparable prevalence and spatial extent between the two conditions. In contrast, GD effects (AEPs, high gamma and alpha suppression) were greatly enhanced during the active condition in all studied brain areas. The prevalence of high gamma GD effects was positively correlated with individual subjects' task performance. The data demonstrate distinct task engagement-related effects on responses to auditory novelty across the auditory cortical processing hierarchy. The results motivate a closer examination of effective connectivity underlying attentional modulation of cortical sensory responses, and serve as a foundation for examining changes in sensory processing associated with general anesthesia, sleep and disorders of consciousness.
Keywords: Alpha suppression; Auditory evoked potential; Electrocorticography; High gamma; Human auditory cortex.
Copyright © 2020 Elsevier B.V. All rights reserved.
Conflict of interest statement
Declaration of competing interest None.
Figures
Similar articles
-
Modulation of Auditory Novelty Processing by Dexmedetomidine and Natural Sleep: A Human Intracranial Electrophysiology Study.Eur J Neurosci. 2025 Jul;62(1):e70181. doi: 10.1111/ejn.70181. Eur J Neurosci. 2025. PMID: 40653365 Free PMC article.
-
Arousal State-Dependence of Interactions Between Short- and Long-Term Auditory Novelty Responses in Human Subjects.Front Hum Neurosci. 2021 Oct 1;15:737230. doi: 10.3389/fnhum.2021.737230. eCollection 2021. Front Hum Neurosci. 2021. PMID: 34658820 Free PMC article.
-
Auditory Predictive Coding across Awareness States under Anesthesia: An Intracranial Electrophysiology Study.J Neurosci. 2018 Sep 26;38(39):8441-8452. doi: 10.1523/JNEUROSCI.0967-18.2018. Epub 2018 Aug 20. J Neurosci. 2018. PMID: 30126970 Free PMC article.
-
Processing of auditory novelty across the cortical hierarchy: An intracranial electrophysiology study.Neuroimage. 2018 Dec;183:412-424. doi: 10.1016/j.neuroimage.2018.08.027. Epub 2018 Aug 13. Neuroimage. 2018. PMID: 30114466 Free PMC article.
-
Stimulus-dependent activations and attention-related modulations in the auditory cortex: a meta-analysis of fMRI studies.Hear Res. 2014 Jan;307:29-41. doi: 10.1016/j.heares.2013.08.001. Epub 2013 Aug 11. Hear Res. 2014. PMID: 23938208 Review.
Cited by
-
Modulation in cortical excitability disrupts information transfer in perceptual-level stimulus processing.Neuroimage. 2021 Nov;243:118498. doi: 10.1016/j.neuroimage.2021.118498. Epub 2021 Aug 21. Neuroimage. 2021. PMID: 34428572 Free PMC article.
-
Passive functional mapping of receptive language cortex during general anesthesia using electrocorticography.Clin Neurophysiol. 2023 Mar;147:31-44. doi: 10.1016/j.clinph.2022.11.021. Epub 2022 Dec 22. Clin Neurophysiol. 2023. PMID: 36634533 Free PMC article.
-
Modulation of Auditory Novelty Processing by Dexmedetomidine and Natural Sleep: A Human Intracranial Electrophysiology Study.Eur J Neurosci. 2025 Jul;62(1):e70181. doi: 10.1111/ejn.70181. Eur J Neurosci. 2025. PMID: 40653365 Free PMC article.
-
Cortical Responses to Vowel Sequences in Awake and Anesthetized States: A Human Intracranial Electrophysiology Study.Cereb Cortex. 2021 Oct 22;31(12):5435-5448. doi: 10.1093/cercor/bhab168. Cereb Cortex. 2021. PMID: 34117741 Free PMC article.
-
Arousal State-Dependence of Interactions Between Short- and Long-Term Auditory Novelty Responses in Human Subjects.Front Hum Neurosci. 2021 Oct 1;15:737230. doi: 10.3389/fnhum.2021.737230. eCollection 2021. Front Hum Neurosci. 2021. PMID: 34658820 Free PMC article.
References
-
- Andres FG, Mima T, Schulman AE, Dichgans J, Hallett M, Gerloff C. 1999. Functional coupling of human cortical sensorimotor areas during bimanual skill acquisition. Brain 122 ( Pt 5), 855–70. - PubMed
-
- Benjamini Y, Hochberg Y. 1995. Controlling the False Discovery Rate: A Practical and Powerful Approach to Multiple Testing. J Royal Stat Soc Series B Stat Methodol 57, 289–300.
Publication types
MeSH terms
Grants and funding
LinkOut - more resources
Full Text Sources
Other Literature Sources
Research Materials
