. 2020 Feb 21;11(1):1003.
doi: 10.1038/s41467-020-14740-z.

Prefrontal parvalbumin interneurons require juvenile social experience to establish adult social behavior

Affiliations

Prefrontal parvalbumin interneurons require juvenile social experience to establish adult social behavior

Lucy K Bicks et al. Nat Commun. .

Abstract

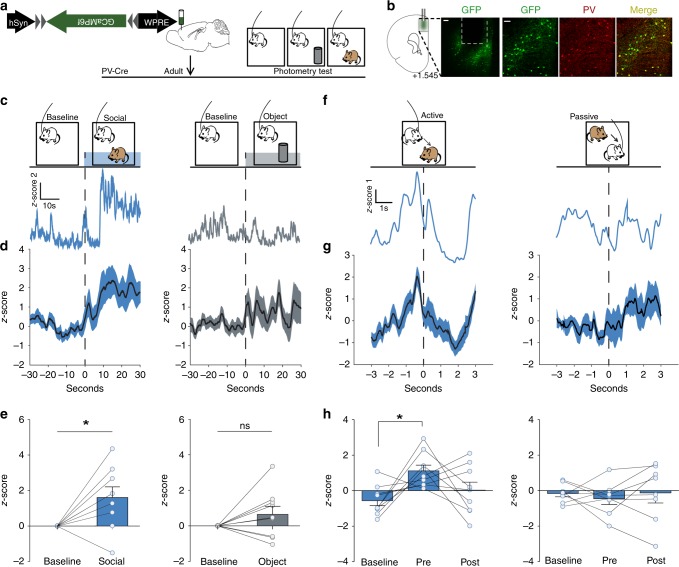
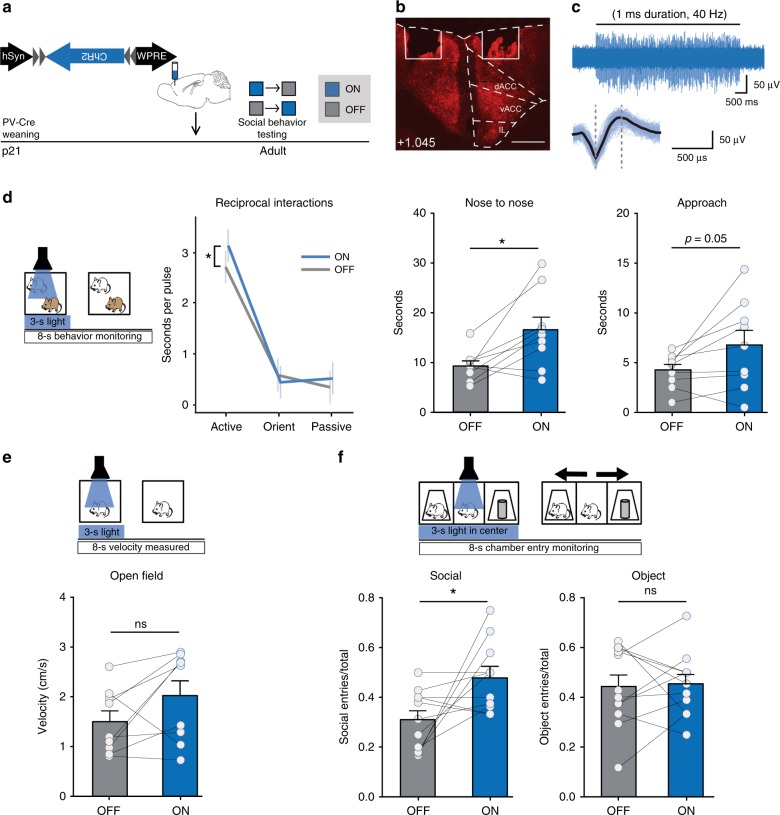
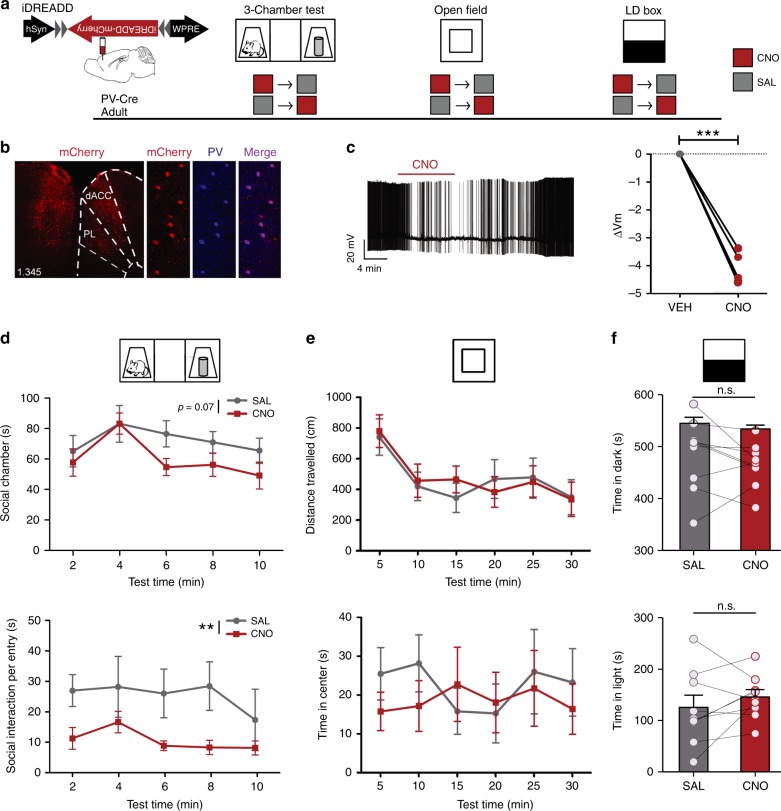
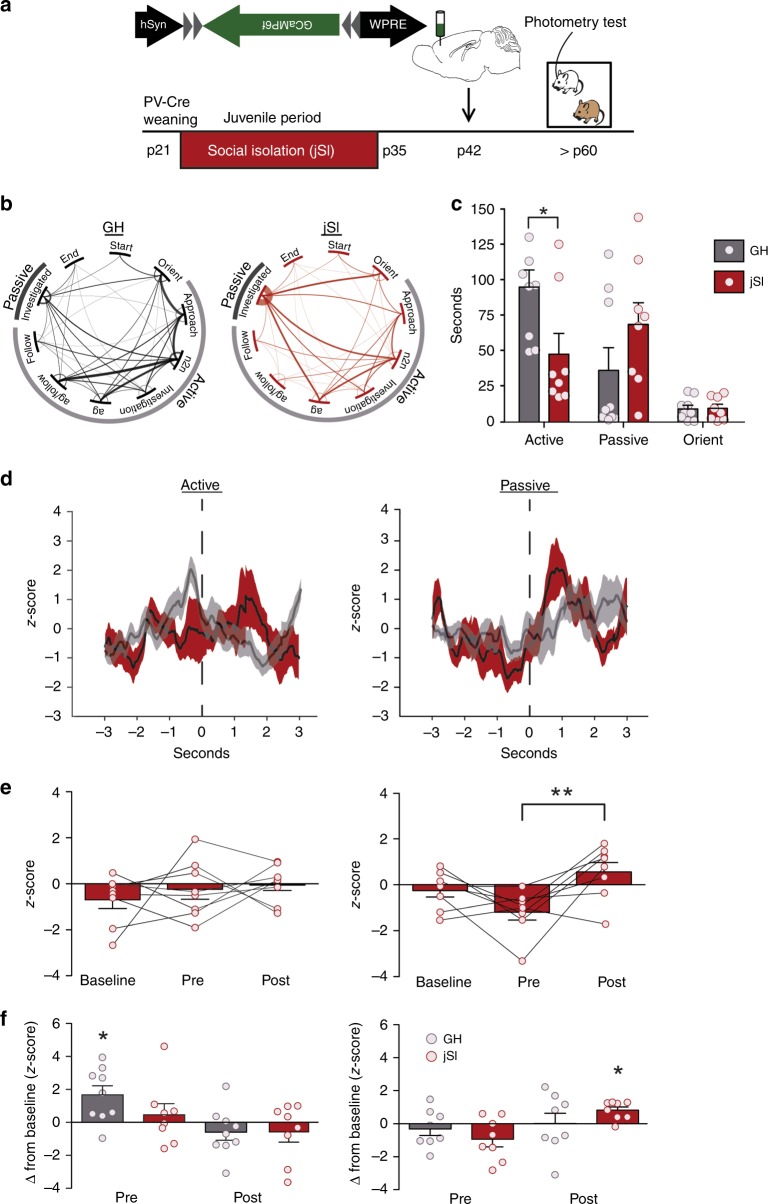
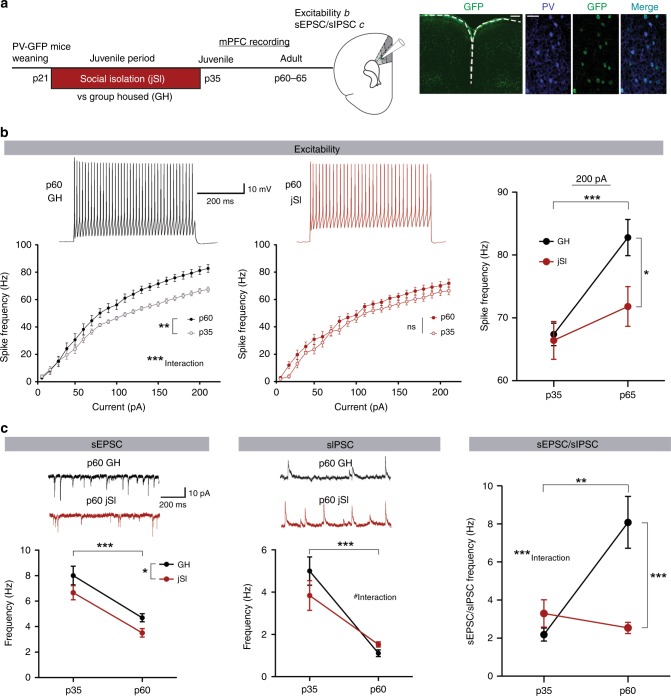
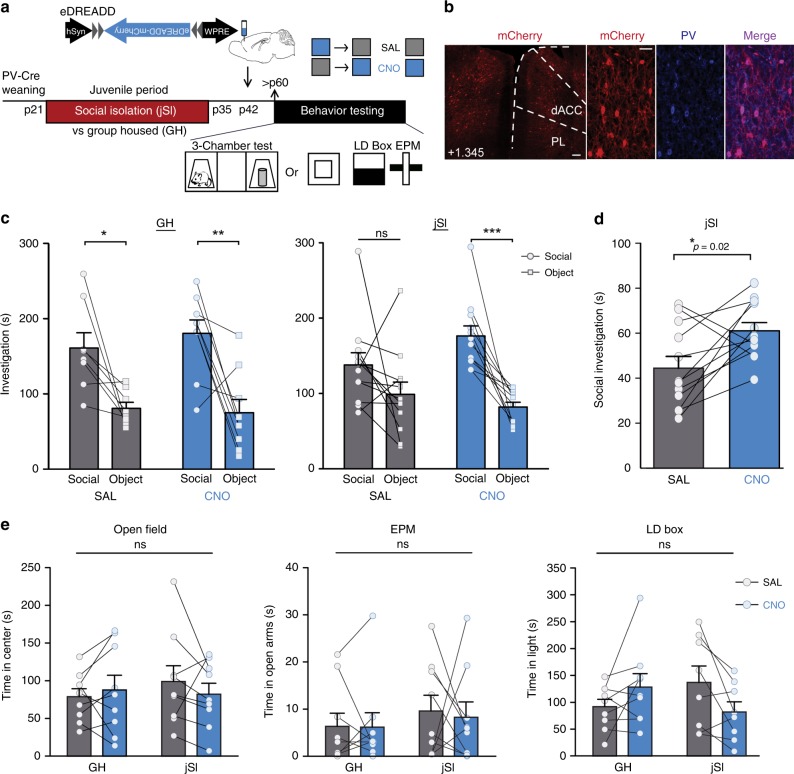
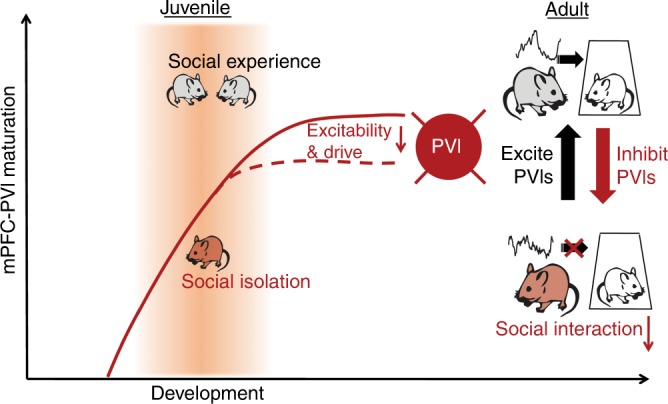
Social isolation during the juvenile critical window is detrimental to proper functioning of the prefrontal cortex (PFC) and establishment of appropriate adult social behaviors. However, the specific circuits that undergo social experience-dependent maturation to regulate social behavior are poorly understood. We identify a specific activation pattern of parvalbumin-positive interneurons (PVIs) in dorsal-medial PFC (dmPFC) prior to an active bout, or a bout initiated by the focal mouse, but not during a passive bout when mice are explored by a stimulus mouse. Optogenetic and chemogenetic manipulation reveals that brief dmPFC-PVI activation triggers an active social approach to promote sociability. Juvenile social isolation decouples dmPFC-PVI activation from subsequent active social approach by freezing the functional maturation process of dmPFC-PVIs during the juvenile-to-adult transition. Chemogenetic activation of dmPFC-PVI activity in the adult animal mitigates juvenile isolation-induced social deficits. Therefore, social experience-dependent maturation of dmPFC-PVI is linked to long-term impacts on social behavior.


Conflict of interest statement

The authors declare no competing interests.

Figures

Fig. 1
Fig. 1. Short activation of dmPFC PVIs precedes an active social approach.
a Timeline showing injection of GCaMP6f in adult dmPFC in PV-Cre mice and subsequent behavioral testing paradigm for fiber photometry imaging (order of object and social exploration was counterbalanced). b Example location of fiber ferrule and GCaMP6f expression in mouse PFC (left) and co-localization of GCaMP6f expression (green) and PV staining (red). (left, scale bar = 100 μm; right, scale bar = 50 μm). c, d GCaMP6f signals of dmPFC-PVIs show increased mean z-score 30 s after introduction of a novel mouse (left), but not a novel object (right). c Example GCaMP signal traces. d Mean + /− SEM smoothed signal. e Mean dmPFC-PVI GCaMP6f signal for each mouse comparing baseline and post stimulus introduction for social and object (Wilcoxon signed-rank test, n = 9 mice, social: *p = 0.03, object: p = 0.25). f Top: active behavior, defined as behavior initiated by the focal mouse (left) and passive behavior, defined as behavior initiated by the stimulus mouse (right) were scored during photometry imaging. Bottom: Representative responses from the first active and first passive bout shows an increase in dmPFC-PVI activity immediately prior to the active bout initiation. No change is seen in the passive bout. g Mean + /− SEM smoothed signal for the first active and passive bout. h Mean dmPFC-PVI GCaMP6f signal for each mouse comparing baseline (−3 to −2 s before active/passive initiation) pre (−1 to 0 s) and post (0–1 s). (One-way repeated measures ANOVA, active (left): F(2,8) = 4.67, *p = 0.02, Tukey post hoc tests, active baseline vs pre, *p < 0.05, n = 9 mice. Passive (right): F(2,7) = 0.27, p = 0.77, n = 8 mice). All error bars reflect + /− SEM. See related Supplementary Figs. 1 and  2. Source data is available as a Source Data file.
Fig. 2
Fig. 2. Short optogenetic activation of dmPFC PVIs promotes subsequent social approach.
a Timeline showing injections of Cre-dependent Channelrhodopsin (ChR2) in PV-Cre mice and subsequent social behavior in adult mice. Light order was counterbalanced. b Representative viral transduction (ChR2-mCherry) and LED location. Scale bar = 500 µm. c Representative in vivo spike activity of ChR2-expressing dmPFC-PVIs upon 40 Hz stimulation (top), and averaged spike following 40 Hz stimulation showing characteristic narrow spike shape (bottom). d Three seconds of light were randomly triggered at least 8 s apart over the course of a 5 min reciprocal interaction trial with an unfamiliar age-, sex-, and strain-matched mouse. Behavior was measured for 8 s following initiation of the light pulse (left). Duration of active behavior per pulse was increased in ‘on’ compared with ‘off’ conditions, while orienting to the stimulus and passive behavior were not changed (middle, linear mixed model effect of light, p = 0.04, planned post hoc tests: active on vs off, *p = 0.01, orient on vs. off p = 0.40, passive on vs. off p = 0.30, n = 9 mice). By animal statistics reveal a significant increase in duration of nose-to-nose investigation and Approach (right, paired t tests, nose-to-nose: t = 3.14, df = 8, *p = 0.01, Approach: t = 2.25, df = 8, p = 0.05, n = 9 mice). e Using the same stimulation protocol as in (d), velocity was measured in the 8 s following light-stimulation initiation. There were no changes in velocity (paired t test, t = 1.88, df = 8, p = 0.10, n = 9 mice). f Three seconds of light stimulation were triggered when the mouse was in the center chamber, and subsequent entries into either the social chamber, the object chamber, or neither were measured in the 8 s following light initiation (top) in a 3-chamber. Bottom: social entries (left) but not object entries (right) increase following 3 s 40 Hz light stimulation in the 3-chamber test (paired t test, Social: t = 2.54, df = 10, *p = 0.03 Object: t = 0.14, df = 9, p = 0.89, n = 11 mice). Error bars reflect + /− SEM. See related Supplementary Figs. 3 and  4. Source data are available as a Source Data file.
Fig. 3
Fig. 3. Chemogenetic suppression of adult dmPFC-PVIs activity disrupts social behavior.
a Timeline showing injection of Cre-dependent inhibitory DREADD (iDREADD) virus to dmPFC of adult PV-Cre mice and subsequent repeated measures behavioral design. For CNO (red square) and SAL (gray square) injections, each mouse is tested under both CNO and SAL conditions, and the order is counterbalanced for each behavior test. b Representative injection of inhibitory DREADD injected in dmPFC of PV-Cre mouse (left, scale bar = 100 μm) and co-localization of DREADD virus expression (mCherry, red) with PV staining (blue) (right, scale bar = 50 μm). c Validation of iDREADD in dmPFC-PVI. Left: representative trace of whole-cell recording from a PVI in adult dmPFC slice upon CNO bath application. Right: change in membrane potential from vehicle after CNO application. Repeated measures t test, t = 16.68, df = 5, ***p < 0.001, n = 6 cells from three mice. d Three-chamber tests show trending decreases in time in social chamber (top), and significant decreases in time interacting per social chamber entry (bottom) when PVIs are suppressed with CNO, compared with saline. (n = 9 mice. Two-way repeated measures ANOVA, effect of the drug: F(1,8) = 4.39, p = 0.07 (top), F(1,8) = 14.28, p = 0.005 (bottom)). e No effect of the drug was seen on distance traveled (top) or time in the center vs. periphery (bottom) in an open-field test (two-way repeated measures ANOVA, distance traveled: effect of the drug, F(1,7) = 0.01, p = 0.92, time in the center: effect of the drug, F(1,7) = 0.21, p = 0.66, n = 8 mice), or in f the light–dark (LD) box test in either time in the dark (top) or time in the light (bottom), (paired t test, time in light: t = 1.089, df = 8, p = 0.31, time in the dark: t = 1.16, df = 8, p = 0.28, n = 9 mice). All error bars reflect + /− SEM. See related Supplementary Figs. 5 and  6. Source data are available as a Source Data file.
Fig. 4
Fig. 4. Juvenile social isolation alters adult dmPFC-PVI activity during reciprocal social interaction.
a Timeline showing weaning at p21, and subsequent 2 weeks of juvenile social isolation (jSI), followed by injection of GCaMP6f in the dmPFC of PV-Cre jSI mice at p42, and subsequent reciprocal interaction behavioral testing paradigm for fiber photometry imaging. b Transition matrices between specific behaviors reveal significant differences between the joint-distribution matrix between jSI and GH mice (p < 0.05), suggesting distinct sequences of behaviors between two groups. c Behavior categories during photometry imaging show decreased active exploration in jSI vs. GH mice (two-way mixed model ANOVA, effect of housing, F(1,15) = 1.42, p = 0.25, housing x behavior interaction, F(2,15) = 9.57, p = 0.03, Bonferroni post hoc tests, active behavior *p < 0.05, passive, Orient, p > 0.05, n = 8 mice jSI, n = 9 mice GH). d Mean and SEM smoothed signal for the first active and passive bout in jSI mice (red) and GH (gray: from Fig. 1). e jSI mice do not show increased pre-active GCamp6f signal in dmPFC-PVIs (left) (baseline vs. pre, Tukey post hoc test p > 0.05), however, dmPFC-PVIs do respond during the first passive encounter, with a significant increase in activity (pre vs. post, Tukey post hoc test, **p < 0.001). f Change in z-score from baseline in the first active encounter shows a significant difference from zero only in GH mice during the pre-active time bin. Change in z-score from baseline in the first passive encounter shows a significant difference from zero only in the post-passive time bin. (Wilcoxon signed -rank test, active (left): GH pre, *p = 0.03, passive (right): *p = 0.02, n = 9 GH mice, n = 7 jSI mice). All error bars reflect + /− SEM. See related Supplementary Figs. 7–14. Source data are available as a Source Data file.
Fig. 5
Fig. 5. Juvenile social isolation causes altered maturation of dmPFC PVIs, leading to long-lasting reduction of excitability and input drive of adult dmPFC PVIs.
a Timeline of juvenile social isolation (jSI) or group housing (GH) followed by whole-cell patch clamp from dmPFC PVIs at p35 or adulthood (left). Right: GFP+ cells (green) co-localize with PV+ cells (blue). Scale bar: left: 300 μm right 50 μm. b Top: Intrinsic excitability of dmPFC PVIs. Representative traces, 200 pA.. Bottom left: adult GH mice showed increased spike frequency at higher current steps (two-way mixed ANOVA, Age factor, F(1,40) = 9.36, **p = 0.0035, age x current F(20,40) = 5.91, ***p < 0.0001). (bottom, middle) In jSI mice, there were no developmental differences (two-way mixed ANOVA, age factor F(1,37) = 2.15, df = 1, p = 0.15, age x current F(20,37) = 0.73, df = 20, p = 0.7977). Right: At 200 pA, spike frequency was significantly lower only in adult jSI mice (two-way ANOVA, housing factor, F(1,77) = 4.53, *p = 0.04, age factor, F(1,77) = 13.75, ***p = 0.0004, Bonferroni post hoc tests p60: p < 0.05, p35: p > 0.05). n = 19 cells, four mice (p36, GH/jSI), 20 cells, five mice (p60, jSI) and 23 cell five mice (p60, GH). c Upper: representative postsynaptic current (PSC) traces. Lower left: sEPSC frequency significantly decreased across development and was lower in jSI (two-way ANOVA, age factor, F(1,81) = 43.75, ***p < 0.001, housing factor, F(1,81) = 6.68, *p = 0.01, p35 sEPSCs: n = 20 cells, five mice (GH), n = 17 cells, five mice (jSI), adult sEPSCs: n = 26 cells, seven mice (GH), 22 cells, six mice (jSI)). Lower middle: sIPSC frequency also decreased in adults; however, there was a trending interaction (two-way ANOVA, age factor, F(1,81) = 49.59, ***p < 0.0001, age x housing F(1,81) = 3.20, #p = 0.07, p35 sIPSCs: n = 20 cells, five mice (GH), n = 17 cells, five mice (jSI), adult sIPSCs: n = 26 cells, seven mice (GH), n = 22 cells, six mice (jSI)). Right: the developmental change of the sEPSC/sIPSC frequency ratio showed a strong interaction (two-way ANOVA, age x housing, F(1,81) = 13.06, ***p = 0.0005), indicating an absent developmental increase in jSI mice (Bonferroni post hoc test p60, ***p < 0.0001). Error bars reflect + /− SEM. Supplementary Fig. 15. Source data are available as a Source Data file.
Fig. 6
Fig. 6. Chemogenetic activation of adult dmPFC-PVIs mitigates social deficits induced by juvenile isolation.
a Timeline showing juvenile social isolation (jSI), Cre-dependent excitatory DREADD (eDREADD) viral injection (p42) in PV-Cre mice, and sociability and anxiety behavior testing (adult, p60–80). b Immunohistochemistry validation of co-localization between mCherry (eDREADD, red) and parvalbumin (PV) antibody (blue). Scale bar left = 100 μm. Scale bar right = 50 μm. c Full behavioral results from the 3-chamber test for sociability show that jSI mice treated with SAL do not show a social preference; however, mice treated with CNO show a significant social preference. GH mice show a significant social preference under both SAL and CNO conditions (two-way repeated measures ANOVA, GH: drug x stimulus interaction F(1,7) = 0.13, p = 0.73 jSI: drug x stimulus interaction, F(1,11) = 6.28, *p = 0.03 followed by post hoc Bonferroni corrected t tests, *p < 0.05, **p < 0.01, ***p < 0.001). n = 12 mice jSI, 8 mice GH. d Juvenile socially isolated JSI adult mice show a significant increase in social interaction in the first 2 min of behavior testing when treated with CNO compared with SAL (paired t test, t = 2.75, df = 11, *p = 0.02). e Neither jSI nor dmPFC-PVI activation with CNO has significant effects on anxiety behavior in the open field (mixed effects ANOVA, OF: effect of housing, p = 0.73, F(1,16) = 0.12, effect of the drug, F(1,16) = 0.12, p = 0.74, interaction, F(1,16) = 1,26, p = 0.28), elevated-plus maze (EPM: effect of housing, F(1,19) = 0.68, p = 0.42, effect of the drug, F(1,19) = 0.06, p = 0.81, interaction, F(1,16) = 0.04, p = 0.85), or the light–dark box (LD, effect of housing, F(1,16) = 0.09, p = 0.77, effect of the drug, F(1,16) = 1.03, df = 1, p = 0.32, interaction F(1,16) = 3.36, p = 0.09). All error bars reflect + /− SEM. See related Supplementary Figs. 16 and  17. Source data are available as a Source Data file.
Fig. 7
Fig. 7. Summary Scheme: PFC-PVIs show decreased excitability and drive following juvenile social isolation, a manipulation that leads to decreased social interaction.
In group housed adults, short dmPFC-PVI activation induced by optogenetics mirrors naturally observed pre-active dmPFC-PVI activity, and leads to social approach. This relationship is not observed in juvenile socially isolated mice. Decreased social interaction can be induced in group housed animals by inhibiting PFC-PVI in adult mice; social interaction of isolated mice can be mitigated by increasing PFC-PVI activity.

References

    1. Nelson CA, 3rd, et al. Cognitive recovery in socially deprived young children: the Bucharest Early Intervention Project. Science. 2007;318:1937–1940. doi: 10.1126/science.1143921. - DOI - PubMed
    1. Almas AN, Degnan KA, Nelson CA, Zeanah CH, Fox NA. IQ at age 12 following a history of institutional care: findings from the Bucharest Early Intervention Project. Dev. Psychol. 2016;52:1858–1866. doi: 10.1037/dev0000167. - DOI - PMC - PubMed
    1. Makinodan M, Rosen KM, Ito S, Corfas G. A critical period for social experience-dependent oligodendrocyte maturation and myelination. Science. 2012;337:1357–1360. doi: 10.1126/science.1220845. - DOI - PMC - PubMed
    1. Yamamuro Kazuhiko, Yoshino Hiroki, Ogawa Yoichi, Makinodan Manabu, Toritsuka Michihiro, Yamashita Masayuki, Corfas Gabriel, Kishimoto Toshifumi. Social Isolation During the Critical Period Reduces Synaptic and Intrinsic Excitability of a Subtype of Pyramidal Cell in Mouse Prefrontal Cortex. Cerebral Cortex. 2017;28(3):998–1010. doi: 10.1093/cercor/bhx010. - DOI - PubMed
    1. Bicks LK, Koike H, Akbarian S, Morishita H. Prefrontal cortex and social cognition in mouse and man. Front. Physiol. 2015;6:1805. - PMC - PubMed

Publication types