. 2020 Feb 21;11(1):1004.
doi: 10.1038/s41467-020-14815-x.

Optogenetic modulation of TDP-43 oligomerization accelerates ALS-related pathologies in the spinal motor neurons

Affiliations

Optogenetic modulation of TDP-43 oligomerization accelerates ALS-related pathologies in the spinal motor neurons

Kazuhide Asakawa et al. Nat Commun. .

Abstract

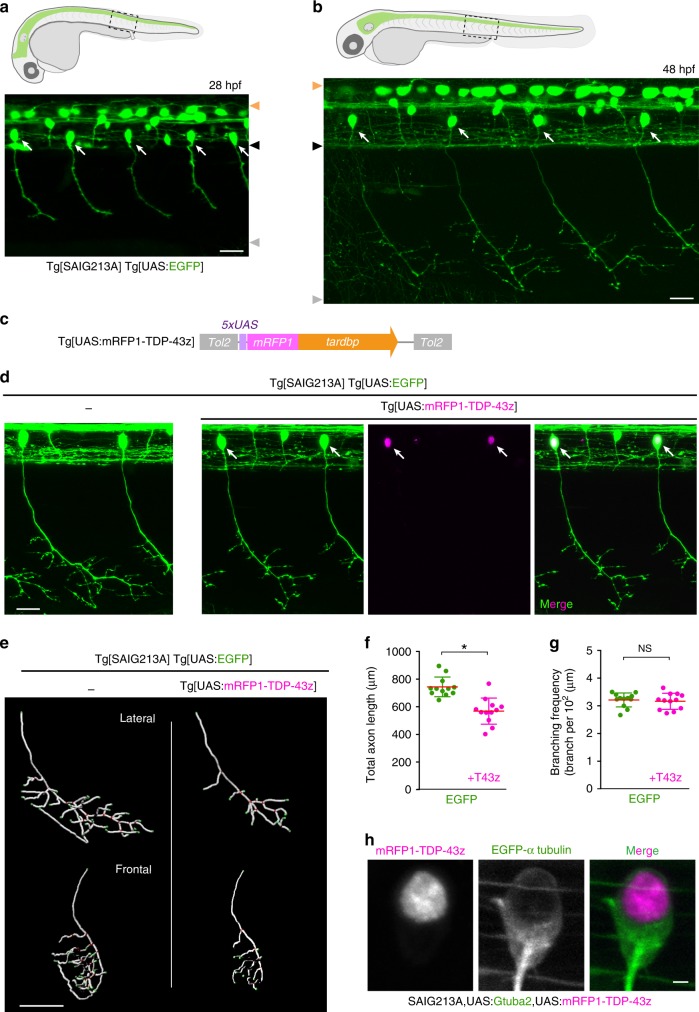
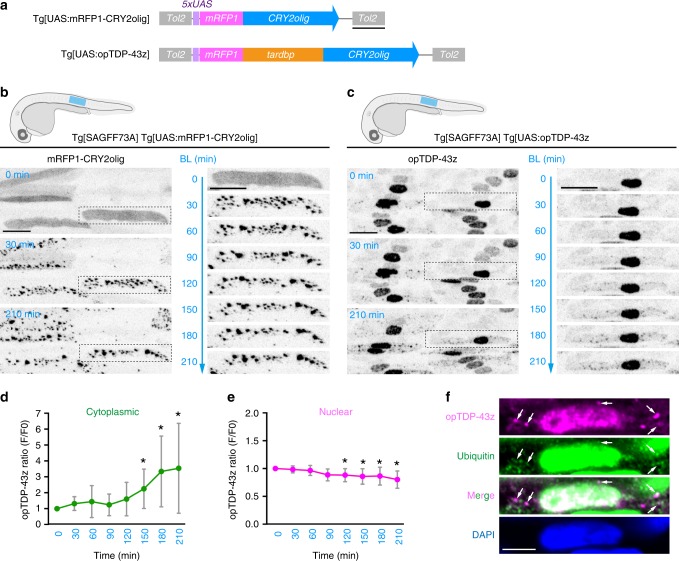
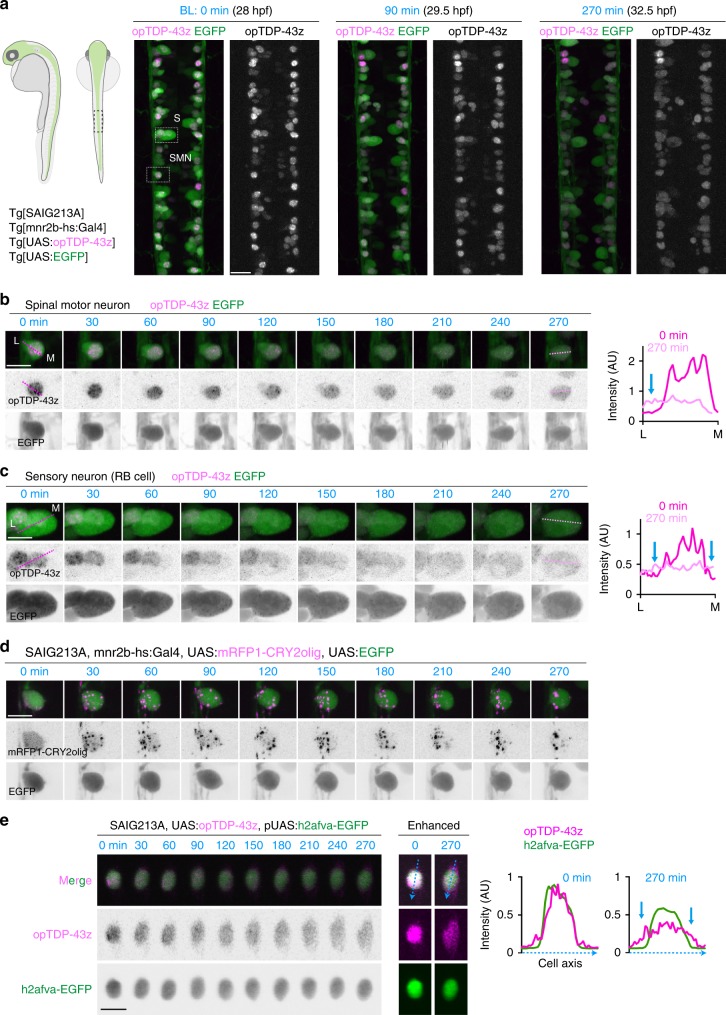
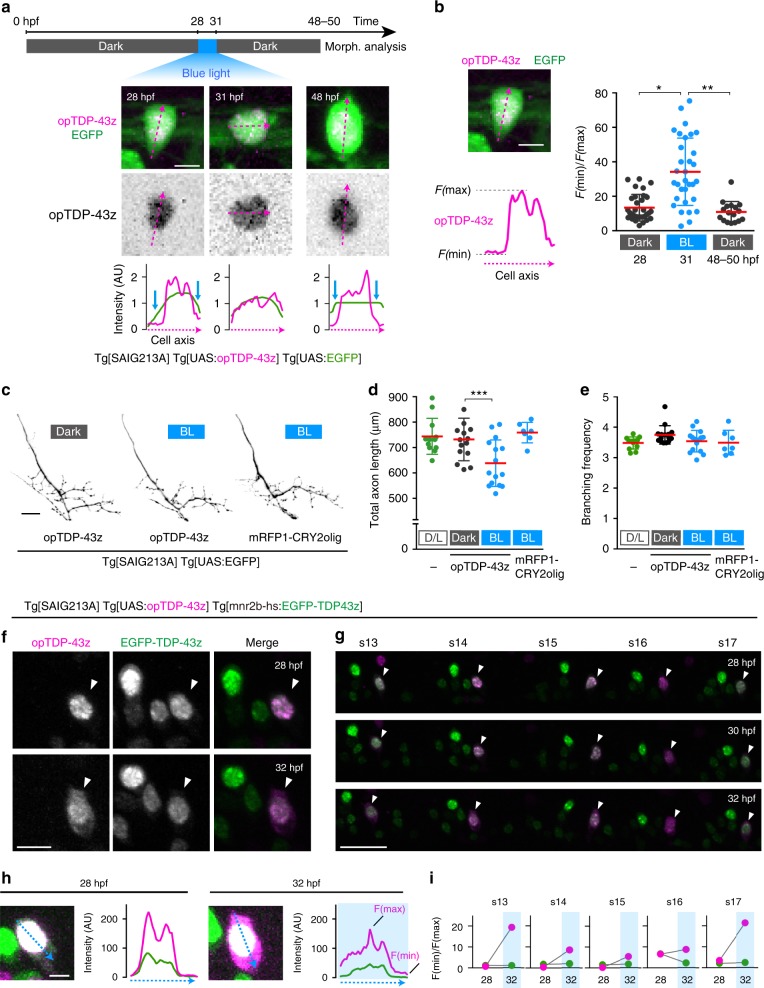
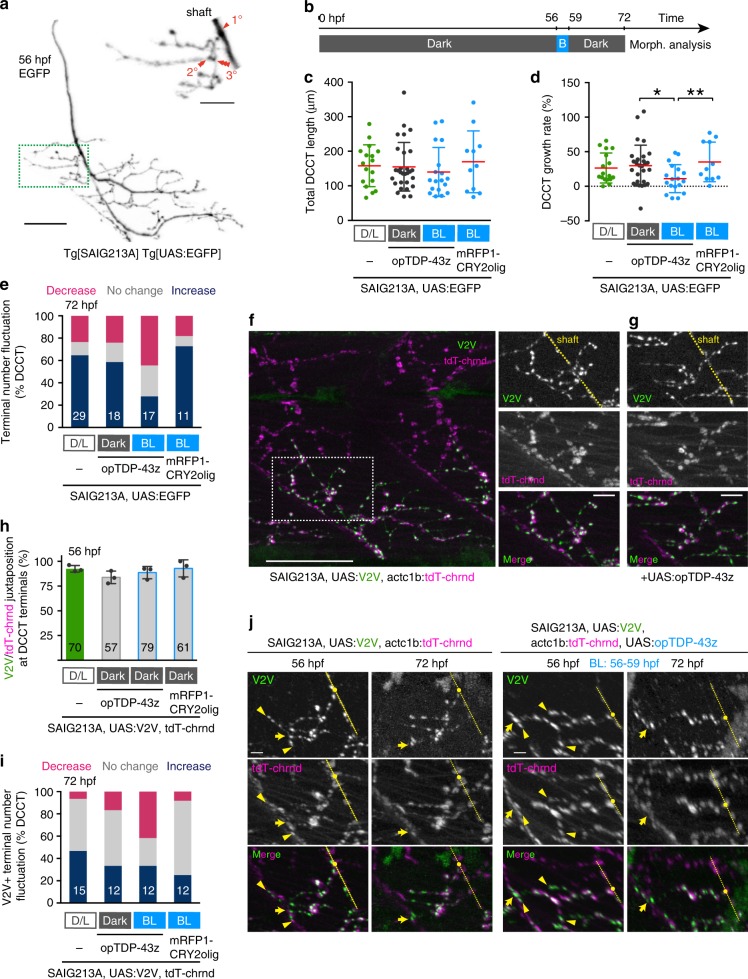
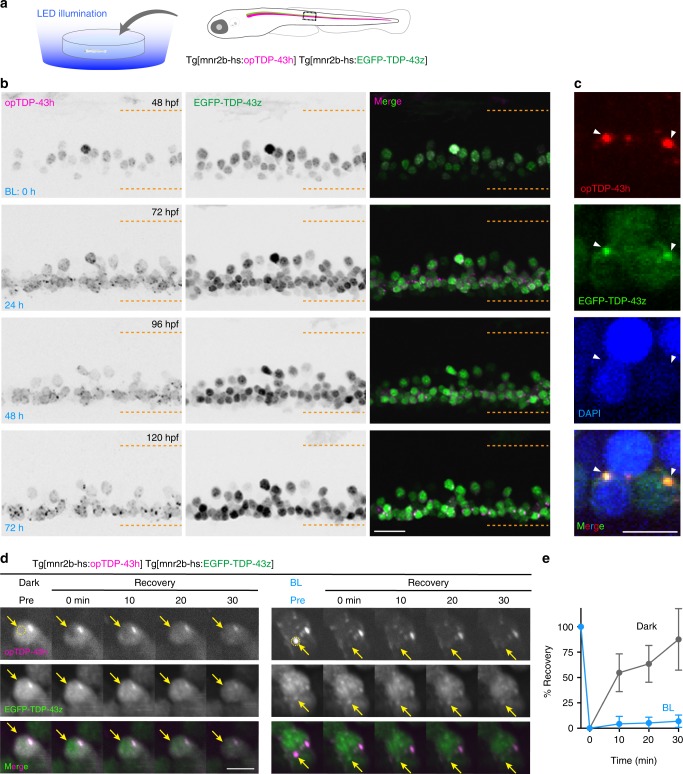
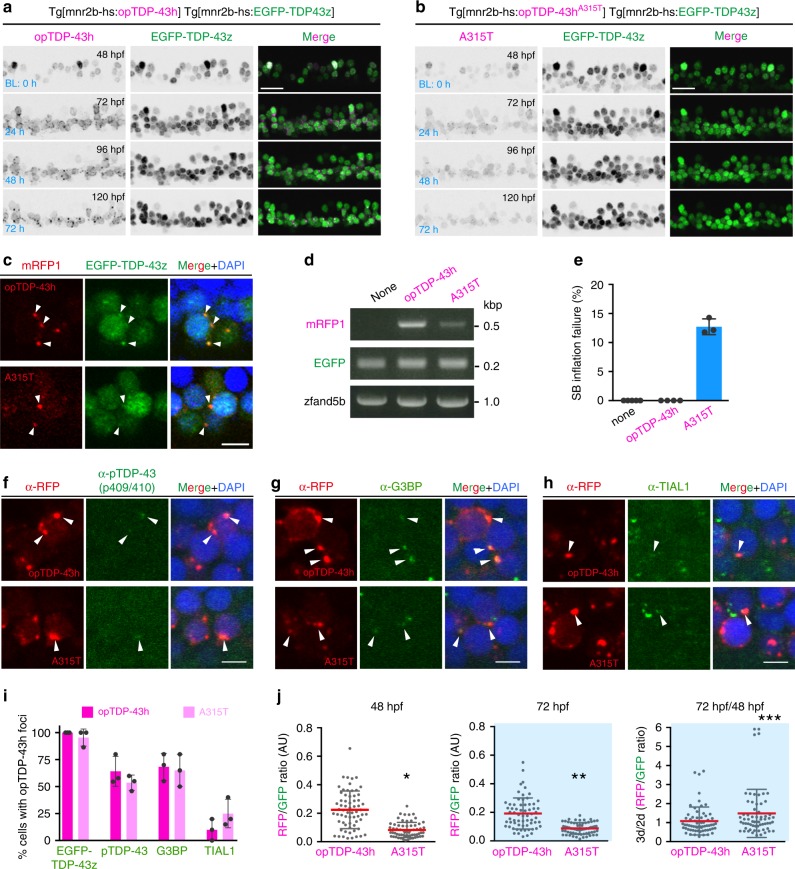
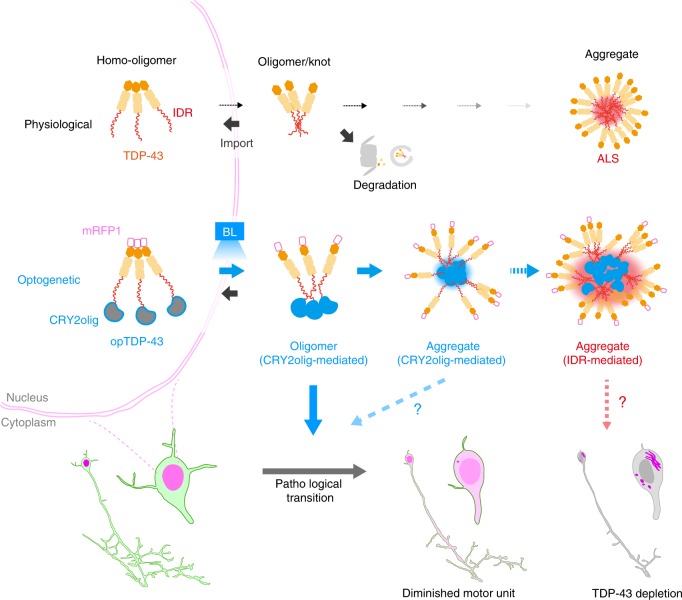
Cytoplasmic aggregation of TDP-43 characterizes degenerating neurons in most cases of amyotrophic lateral sclerosis (ALS). Here, we develop an optogenetic TDP-43 variant (opTDP-43), whose multimerization status can be modulated in vivo through external light illumination. Using the translucent zebrafish neuromuscular system, we demonstrate that short-term light stimulation reversibly induces cytoplasmic opTDP-43 mislocalization, but not aggregation, in the spinal motor neuron, leading to an axon outgrowth defect associated with myofiber denervation. In contrast, opTDP-43 forms pathological aggregates in the cytoplasm after longer-term illumination and seeds non-optogenetic TDP-43 aggregation. Furthermore, we find that an ALS-linked mutation in the intrinsically disordered region (IDR) exacerbates the light-dependent opTDP-43 toxicity on locomotor behavior. Together, our results propose that IDR-mediated TDP-43 oligomerization triggers both acute and long-term pathologies of motor neurons, which may be relevant to the pathogenesis and progression of ALS.


Conflict of interest statement

A patent application covering this work (application no. JP2018-186569, PCT/JP2019/037829) has been filed in which Inter-University Research Institute Corporation Research Organization of Information and Systems, and K.A. and K.K. are the inventors.

Figures

Fig. 1
Fig. 1. TDP-43 overexpression halts axon outgrowth independently of cytoplasmic aggregation.
a, b CaPs (arrows) in Tg[SAIG213A] Tg[UAS:EGFP] fish. Orange, black and gray arrowheads indicate dorsal and ventral limits of the spinal cord, and ventral myotomal borders, respectively. c The structure of Tg[UAS:mRFP1-TDP-43z. d CaPs in Tg[SAIG213A] Tg[UAS:EGFP] (left) and Tg[SAIG213A] Tg[UAS:EGFP] Tg[UAS:mRFP1-TDP-43z] (right) larvae at 48 hpf. Arrows indicate CaPs expressing mRFP1-TDP-43z. e The lateral and frontal views of skeletonized CaP axons of Tg[SAIG213A] Tg[UAS:EGFP] (left) and Tg[SAIG213A] Tg[UAS:EGFP] Tg[UAS:mRFP1-TDP-43z] (right). The axon branch points and terminals are indicated by red and green, respectively. (See also Supplementary Movie 1). f, g Total length and branching frequency of CaP axons at the spinal segment 14–17 of Tg[SAIG213A] Tg[UAS:EGFP] (green, 12 cells, 5 animals) and Tg[SAIG213A] Tg[UAS:EGFP] Tg[UAS:mRFP1-TDP-43z] (magenta, 12 cells, 6 animals). *p < 0.0001 (unpaired t-test, two-tailed). NS, not statistically significant (p = 0.66). h Localization of mRFP1-TDP-43z in a CaP of Tg[SAIG213A] Tg[UAS:Gtuba2] Tg[UAS:mRFP1-TDP-43z] at 48 hpf. EGFP-tagged α-tubulin expressed from Tg[UAS:Gtuba2] serves as a marker for the cytoplasm. The bars indicate 20 µm (a, b, d), 40 µm (e), and 2 µm (h). Error bars show standard deviation (SD).
Fig. 2
Fig. 2. A photo-switchable TDP-43: opTDP-43.
a The structures of Tg[UAS:mRFP1-CRY2olig] and Tg[UAS:opTDP-43z]. b, c Skeletal muscle of Tg[SAGFF73A] Tg[UAS:mRFP1-CRY2olig] and Tg[SAGFF73A] Tg[UAS:opTDP-43] fish from 28 hpf (0 min) to 31.5 hpf (210 hpf). The blue light was illuminated from 0 to 210 min. Montages of single skeletal muscle cells expressing mRFP1-CRY2olig and opTDP-43z (dashed boxes) are shown on the right. d, e The averaged change of opTDP-43z intensity in the cytoplasm (d) and nucleus (e) of skeletal muscle cells in Tg[SAGFF73A] Tg[UAS:opTDP-43z] fish during the illumination (N = 8 cells from the same animal). Error bars show SD, and the center of the error bars is the mean. The asterisks indicate the statistically significant change in opTDP-43z fluorescence intensity at each time point in comparison to the opTDP-43z level at t = 0, and adjustments were not made for multiple comparisons. In d p = 0.0125, 0.010, 0.0234 at 150, 180, 210 min, respectively (unpaired t-test, two-tailed). In e p = 0.0092, 0.0128, 0.0114, 0.0311 at 120, 150, 180, 210 min, respectively. f Immunofluorescence of the skeletal muscle of fish illuminated for 3.5 h, using anti-RFP (for opTDP-43z) and anti-ubiquitin antibodies. Arrows indicate the representative of opTDP-43z foci that are partially ubiquitinated. The bars indicate 500 bp (a), 20 µm (b, c), and 5 µm (f).
Fig. 3
Fig. 3. Light illumination-dependent cytoplasmic mislocalization of opTDP-43 in neuronal cells.
a The dorsal view of the spinal cord at the segment 14–17 levels of a Tg[SAIG213A] Tg[mnr2b-hs:Gal4] Tg[UAS:opTDP-43z] Tg[UAS:EGFP] quadruple transgenic fish. A spinal motor neurons (SMN) and a Rohon-Beard sensory neuron (RB cell, S) were highlighted with dashed boxes and analyzed in detail in (b, c). b, c Montages of the spinal motor neurons and the RB cell during the light illumination. The graphs show the fluorescent intensities of opTDP-43z along the dotted line drawn from the lateral (L) to medial edges (M) of the EGFP signal. The blue arrows indicate the cytoplasmic increase of opTDP-43z. The unit for y-axes are the same between 0 and 270 min. d Montage of the spinal motor neuron expressing mRFP1-CRY2olig in the same illumination condition as in (a). e Cytoplasmic mislocalization of opTDP-43z in Tg[SAIG213A] Tg[UAS:opTDP-43z] fish injected with a plasmid harboring UAS regulated EGFP-tagged histone H2A variant H2afva. The graphs show the fluorescent intensities of opTDP-43z and EGFP-H2afva along blue dotted line drawn across the cell axes. The blue arrows indicate the cytoplasmic increase of opTDP-43z. The bars indicate 20 µm (a), 10 µm (be).
Fig. 4
Fig. 4. Cytoplasmic opTDP-43z mislocalization is accompanied by diminished axon outgrowth.
a The light-illumination paradigm of CaPs. The spinal cord of Tg[SAIG213A] Tg[UAS:opTDP-43z] Tg[UAS:EGFP] fish at the segment 13–18 level were illuminated with a blue laser, and CaPs were subjected to morphological analysis at 48–50 hpf. A single CaP was analyzed from dorsal (28, 31 hpf) and lateral (48 hpf) views. The fluorescence intensity along the longest inner diameter (dashed magenta arrow) is plotted at each time point. Blue arrows indicate the presumptive cytoplasmic area, where the opTDP-43z signal is faint. b Cytoplasmic shift of opTDP-43 is evaluated as a relative value of minimal (F(min), cytoplasm) and maximal (F(max), nuclear) fluorescence intensity along the longest inner diameter (dashed magenta line). The results were obtained from 32 cells (28, 31 hpf) and 17 cells (48 hpf) in three independent fish. *p < 0.0001, **p < 0.0001 (unpaired t-test, two-tailed). c Axons of CaPs expressing opTDP-43z with (BL, middle) or without (Dark, left) blue light stimulation and mRFP1-CRY2olig with blue light stimulation (right). d, e The total axon length and branching frequency of CaP axons in Tg[SAIG213A] Tg[UAS:EGFP] fish raised under normal laboratory light-dark cycle (L/D, the same data sets in Fig. 1e, f), Tg[SAIG213A] Tg[UAS:opTDP-43z] Tg[UAS:EGFP] fish with (BL, 15 cells, 4 animals) or without (Dark, 15 cells, 4 animals) blue light stimulation, and Tg[SAIG213A] Tg[UAS:mRFP1-CRY2olig] Tg[UAS:EGFP] fish with the stimulation (7 cells, 2 animals). ***p = 0.0068. f, g CaPs (arrowhead) and other mnr2b-positive motor neurons in the segment 14 (f) and 13–17 (g) of Tg[SAIG213A] Tg[UAS:opTDP-43z] Tg[mnr2b-hs:EGFP-TDP43z] fish that was illuminated with a blue light during 28–32 hpf. h, i Cytoplasmic shift of opTDP-43z and EGFP-TDP-43z in the CaP in (f). The fluorescence intensities of opTDP-43z (magenta) and EGFP-TDP-43z (green) were plotted along the blue dashed arrows (h). Images shown are enhanced to identify soma outline. i The relative intensity of cytoplasmic signal (F(min)/F(max)) for opTDP-43z (magenta) and EGFP-TDP-43z (green) in each spinal segment. The bars indicate 5 µm (a, b), 10 µm (f, h), 20 µm (c), and 30 µm (g). Error bars show SD.
Fig. 5
Fig. 5. Axonal shrinkage and myofiber denervation caused by opTDP-43z.
a A CaP motor axon of Tg[SAIG213A] Tg[UAS:EGFP] fish. DCCT (green box) was magnified on the right. Primary, secondary and tertial branchings were indicated in red. b Light-illumination paradigm. ce Total length (c), growth rate (d) and fluctuation of axon terminal number (e) of DCCTs. Results were obtained from 5 independent animals in opTDP-43z/Dark condition and otherwise from 3 animals. The numbers in the histograms are total numbers of the cells examined. *p = 0.0224, **p = 0.0128 (unpaired t-test, two-tailed). f The lateral view of the trunk of Tg[SAIG213A] Tg[UAS:V2V] Tg[actc1b:tdT-chrnd] fish (left) and neuromuscular synapses of the DCCT (right) at 56 hpf. The dashed yellow lines indicate the CaP axon shaft. g Neuromuscular synapses of a DCCT in Tg[SAIG213A] Tg[UAS:opTDP-43z] Tg[UAS:V2V] Tg[actc1b:tdT-chrnd] fish at 56 hpf. h, i Occurrence of Vamp2-Venus/ tdT-chrnd juxtaposition prior to illumination at 56 hpf (h) and fluctuation of terminal number with Vamp2-Venus/tdT-chrnd juxtaposition at 72 hpf (i). The numbers in the histograms show the total numbers of axon terminals (h) and DCCTs (i) that were examined. Results were obtained from 4 independent animals in D/L condition and otherwise from 3 animals. j Live imaging of DCCT neuromuscular synapses. Yellow arrowheads indicate the neuromuscular synapses that were not present at 72 hpf. The yellow dashed lines, dots, arrows indicate axon shafts, primary branching points, and contact sites with the myotomal boundaries of CaPs, respectively. Z-stacks are produced from 3D-rotated images made by Imaris, to make the denervation events (arrowhead) clearly visible (j, right). The bars indicate 10 µm (a top, f right, g), 25 µm (a bottom, f left), 5 µm (j). Error bars show SD.
Fig. 6
Fig. 6. Long-term illumination induces opTDP-43h aggregation that seeds non-optogenetic TDP-43 aggregation.
a Chronic field illumination of unrestrained Tg[mnr2b-hs:EGFP-TDP43z] Tg[mnr2b-hs:opTDP-43h] fish by blue LED light. b Live imaging of the spinal motor column from 48 to 120 hpf. Horizontal dashed lines demarcate approximate positions of dorsal and ventral limits of the spinal cord. c Cytoplasmic opTDP-43h foci colocalize with EGFP-TDP-43z. d FRAP analyses of nuclear opTDP43h that had not been exposed to blue light (left, Dark Pre) and cytoplasmic opTDP43h foci that had been induced by a 72-h blue light illumination (right, BL Pre). Bleaching was performed at 120 hpf. Yellow dashed circles (Pre) include photobleached area and arrows indicate the bleached position. e Quantification of fluorescent recovery. The results were obtained from 6 cells in independent 6 animals for each condition. Error bars show SD, and the center of the error bars is the average value. The bars indicate 20 µm (b), 5 µm (c, d). Error bars show SD.
Fig. 7
Fig. 7. The IDR mutation A315T enhances protein stability and oligomerization-dependent toxicity.
a, b Live imaging of the spinal motor column from 48 to 120 hpf. c Chronically light-stimulated opTDP-43h (top) and opTDP-43hA315T (bottom) aggregate in the cytoplasm and seed EGFP-TDP-43z aggregation. Arrowheads indicate opTDP-43 and opTDP-43hA315T aggregates that contain EGFP-TDP-43z. d RT-PCR analysis for opTDP-43h and opTDP-43hA315T transcripts at 72 hpf. e Failure rate of swimming bladder (SB) inflation of Tg[mnr2b-hs:EGFP-TDP43z] (none), Tg[mnr2b-hs:EGFP-TDP43z] Tg[mnr2b-hs:opTDP-43h], and Tg[mnr2b-hs:EGFP-TDP43z] Tg[mnr2b-hs:opTDP-43hA315T] (A315T) larvae at 120–144 hpf. The average failure rates were defined from at least three independent assays where six or more fish were illuminated (Source data are provided as a Source Data file). SB inflation failure was not observed when fish were raised under normal dark light cycles (N > 100 for each). fi Immunofluorescence analyses of phospo-TDP-43 (f), G3BP (g), TIAL1 (h) against cytoplasmic opTDP-43h and opTDP-43hA315T aggregates at 120 hpf. At least, twenty cells with distinct opTDP-43h or opTDP-43hA315T aggregates were examined for each of three independent fish. j Stability of opTDP-43h or opTDP-43hA315T. Fluorescence intensities of opTDP-43h or opTDP-43hA315T (RFP) relative to EGFP-TDP-43z (GFP) were examined at 48 hpf and 72 hpf, in the same set of 64 cells from three independent animals. *p < 0.0001, **p < 0.0001, ***p = 0.03 (unpaired t-test, two-tailed). The bars indicate 20 µm (a, b) and 5 µm (c, fh). Error bars show SD.
Fig. 8
Fig. 8. Sequentially regulated illumination-triggered TDP-43 knot and aggregate formation.
In physiological conditions, TDP-43 forms oligomers via its N-terminus and is primarily localized in the nucleus. Spinal motor neurons keep the cytoplasmic concentration of TDP-43 oligomers at a low level to prevent them from turning into toxic irreversible oligomers mediated by the C-terminus IDRs (toxic “knots”), which possess competence for developing into pathological TDP-43 aggregates, a hallmark of ALS. CRY2olig-driven opTDP-43 oligomerization promotes pathological change of the motor neurons, such as axon retraction associated with myofiber denervation, prior to accumulation of distinct cytoplasmic aggregates. Whether CRY2olig-diriven opTDP-43 aggregates are toxic to motor neurons and whether CRY2olig-diriven aggregates eventually deplete endogenous nuclear TDP-43 pools are unknown.

Similar articles

Cited by

References

    1. Arai T, et al. TDP-43 is a component of ubiquitin-positive tau-negative inclusions in frontotemporal lobar degeneration and amyotrophic lateral sclerosis. Biochem. Biophys. Res. Commun. 2006;351:602–611. doi: 10.1016/j.bbrc.2006.10.093. - DOI - PubMed
    1. Neumann M, et al. Ubiquitinated TDP-43 in frontotemporal lobar degeneration and amyotrophic lateral sclerosis. Science. 2006;314:130–133. doi: 10.1126/science.1134108. - DOI - PubMed
    1. Mackenzie IR, et al. Pathological TDP-43 distinguishes sporadic amyotrophic lateral sclerosis from amyotrophic lateral sclerosis with SOD1 mutations. Ann. Neurol. 2007;61:427–434. doi: 10.1002/ana.21147. - DOI - PubMed
    1. Tan CF, et al. TDP-43 immunoreactivity in neuronal inclusions in familial amyotrophic lateral sclerosis with or without SOD1 gene mutation. Acta Neuropathol. 2007;113:535–542. doi: 10.1007/s00401-007-0206-9. - DOI - PubMed
    1. Lagier-Tourenne C, Polymenidou M, Cleveland DW. TDP-43 and FUS/TLS: emerging roles in RNA processing and neurodegeneration. Hum. Mol. Genet. 2010;19:R46–R64. doi: 10.1093/hmg/ddq137. - DOI - PMC - PubMed

Publication types

MeSH terms

Substances