

doi: 10.1038/s41467-020-14614-4.
MEN1 deficiency leads to neuroendocrine differentiation of lung cancer and disrupts the DNA damage response
Affiliations
- PMID: 32081882
- PMCID: PMC7035285
- DOI: 10.1038/s41467-020-14614-4
Item in Clipboard
MEN1 deficiency leads to neuroendocrine differentiation of lung cancer and disrupts the DNA damage response
Nat Commun.
.
Abstract
The MEN1 gene, a tumor suppressor gene that encodes the protein menin, is mutated at high frequencies in neuroendocrine (NE) tumors; however, the biological importance of this gene in NE-type lung cancer in vivo remains unclear. Here, we established an ATII-specific KrasG12D/+/Men1-/- driven genetically engineered mouse model and show that deficiency of menin results in the accumulation of DNA damage and antagonizes oncogenic Kras-induced senescence and the epithelial-to-mesenchymal transition during lung tumorigenesis. The loss of menin expression in certain human primary lung cancers correlates with elevated NE profiles and reduced overall survival.
Conflict of interest statement
The authors declare no competing interests.
Figures
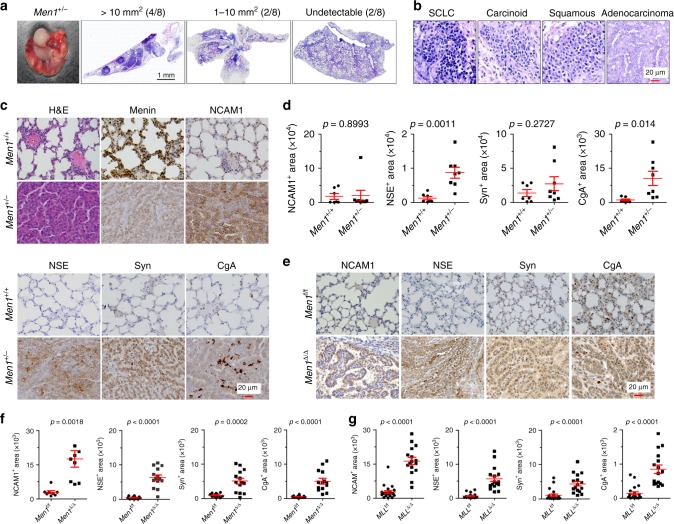
a Representative brightfield image and H&E images of lungs dissected from Men1+/− mice at 12–18 months (n = 8). The mice are grouped by tumor area: >10 mm2 (4/8), 1–10 mm2 (2/8), or undetectable (2/8). Scale bars, 1 mm. b H&E staining of multiple pathological types of lung cancers from Men1+/− mice, including SCLC, carcinoid cancer, squamous cell carcinoma, and adenocarcinoma. The samples were blindly classified by three independent pathologists. Scale bars, 20 μm. c H&E and IHC staining of the indicated antibodies in the lungs of Men1+/+ and Men1+/− mice. n = 8; Scale bars, 20 μm. d Automatic quantification of NCAM1, NSE, Syn, CgA IHC staining in Men1+/+ and Men1+/− 12–18 months mice lung tissues. e IHC staining of the indicated antibodies in Men1f/f (n = 12) and Men1Δ/Δ (n = 14) mice at 12 months post intraperitoneal (i.p.) injections of 100 mg/kg TAM. Scale bars, 20 μm. f Automatic quantification of NCAM1, NSE, Syn, CgA IHC staining in Men1f/f (n = 12) and Men1Δ/Δ (n = 14) 12 months mice lung tissues. g Automatic quantification of NCAM1, NSE, Syn, CgA IHC staining in MLLf/f (n = 21) and MLLΔ/Δ (n = 16) 4 months mice lung tissues, related to Supplementary Fig. 1a. Data are represented as mean ± SEM in d, f and g. Dots in d, f, and g depict individual samples. Significance determined by two-tailed unpaired t tests in d, f, and g are indicated. Source Data are provided as a Source Data file.

a IHC staining was performed with the indicated specific markers in lung tumors from Men1+/− and Men1Δ/Δ mice (from Fig. 1). CGRP, NE cells; Sftpc, ATII cells; CC10, Clara cells. Scale bars, 20 μm. b Representative axial thoracic microCT images from mice of the indicated genotypes at 3 and 9 weeks after i.p. injection of TAM. The red line marks the location of the pericardium. The brightfield images show lung tissues from mice of the indicated genotypes at 9 weeks. c Kaplan-Meier survival analysis of mice of the indicated genotypes (WT: n = 17; MS: n = 15; KS: n = 14; KMS: n = 16). d Scatter plot of lung weight and lung weight/body weight of the indicated mice at 9 weeks (WT: n = 17; MS: n = 15; KS: n = 14; KMS: n = 15). e IHC staining for the indicated proteins in the lung tumors of KS and KMS mice at 9 weeks. Scale bars, 20 μm. Data are represented as mean ± SEM in d. Dots in d depict individual samples. The hazard ratios (HR) and p values by log-rank (Mantel-Cox) test are indicated in c. KS mice compared with KMS mice, p < 0.0001. Significance determined by two-tailed unpaired t tests are indicated in d. Source Data are provided as a Source Data file.

a, b IHC staining was performed with specific p53 and p-RbSer780 antibodies in lung sections from mice of the indicated genotypes at 18 months a and 9 weeks b, respectively (from Figs. 1 and 2). The Men1+/+, WT, and MS were normal lung tissues, the KS and KMS were lung tumors. Scale bars, 20 μm. c Western blotting was used to detect the indicated proteins in A549 and MEF cells. d Co-IP with an anti-p53 antibody and ubi-p53 detection with an anti-ubiquitin antibody were performed via western blotting of samples from Men1f/f and Men1Δ/Δ MEF cells treated with 25 µg/ml MG132 for 6 h. e
Men1f/f and Men1Δ/Δ MEF cells were treated with 50 µg/ml cyclohexamide (CHX), and the expression of menin, MDM2, and p53 was determined by western blotting (top). The relative expression of p53 or MDM2 was quantified by gray scanning, and the protein levels at the indicated time points are presented relative to those at 0 min (bottom). f RT-qPCR was used to detect the mRNA expression of βTrCP in Men1f/f and Men1Δ/Δ MEF cells 1 hour after exposure to 10 Gy of IR. g Western blotting was used to detect the expression of the indicated proteins in Men1f/f and Men1Δ/Δ MEF cells 1 hour after exposure to 10 Gy of IR. h Cell lysates were immunoprecipitated with anti-MDM2, and western blotting with MDM2, MDMX, βTrCP, and p53 antibodies was performed for Men1f/f and Men1Δ/Δ MEF cells. IgG served as the negative control. i Western blotting was used to detect the expression of MDM2, βTrCP, and p53 in the lung tissues/tumors of Men1f/f and Men1Δ/Δ mice (n = 3 per group). j Schematic representation of the βTrCP gene promoter regions and primer pairs used for ChIP assays. ChIP-qPCR was performed with an anti-menin antibody on samples from Men1f/f and Men1Δ/Δ MEF cells, and IgG served as the negative control. Data are represented as mean ± SD in f, e and as mean ± SEM in j. Dots in f and j depict one repeat. Significance determined by two-tailed unpaired t tests in f and j are indicated. Results in c–i, and j are representative of three independent experiments. Source Data are provided as a Source Data file.

a, b IHC staining for γH2AX was performed in lung tissue/tumor sections from mice of the indicated genotypes. a The WT, MS, KS, and KMS 11 weeks mice lung tissues. bThe Men1+/− 18 months mice lung tissues and the Men1Δ/Δ 12 months mice lung tissues. Scale bars, 20 μm. c Representative images of DAPI staining showing NBUDs, NPBs, and MNi (red arrows) in Men1f/f and Men1Δ/Δ MEF cells 1 hour after exposure to 10 Gy of IR. The statistical results were obtained from analysis of mitotic cells(n = 100 per group), and repeat the count three times. Scale bars, 10 μm. d IF staining for γH2AX (red), menin (green), and DAPI (blue) in p53f/f and p53Δ/Δ MEF cells 1 hour after exposure to the indicated IR dose. Colocalization of menin and γH2AX is shown in gray. Scale bars, 10 μm. e Western blotting was used to detect the expression of the indicated proteins in A549 and MEF cells 1 hour after exposure to 10 Gy of IR. Data are represented as mean ± SD in c. Significance determined by two-tailed unpaired t tests in c are indicated. Results in c, d, and e are representative of three independent experiments. Source Data are provided as a Source Data file.
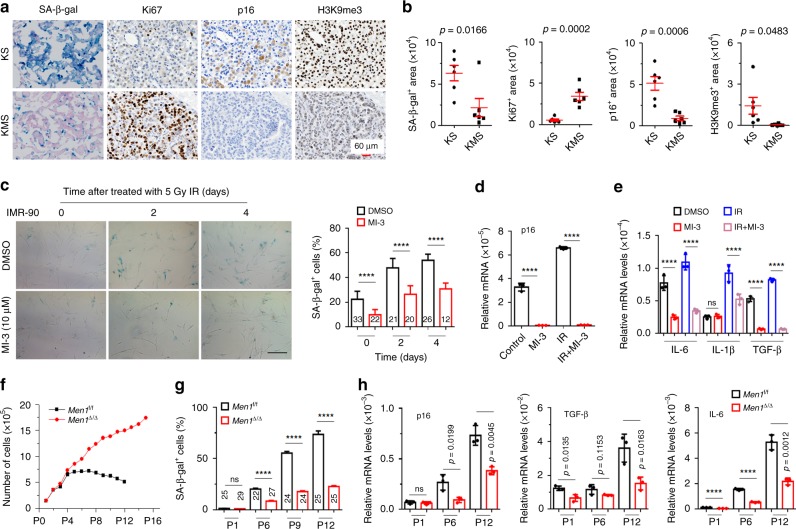
a Representative images of SA-β-gal staining and IHC staining of Ki67, p16, and H3K9me3 in lung consecutive sections from 11 weeks KS or KMS mice. Scale bars, 60 μm. b Quantification of SA-β-gal staining, Ki67, p16, and H3K9me3 staining in a, n = 6 per group. c Images of SA-β-gal staining and quantification of SA-β-gal-positive cells. The cells were treated with 10 μm MI-3 for 2 days before receiving 5 Gy of IR, and SA-β-gal staining was performed at the indicated time points after IR exposure. Scale bars, 100 μm. d, e IMR-90 cells were treated with 10 μm MI-3 for 2 days before IR and were collected 2 days after exposure to 5 Gy of IR. RT-qPCR was used to detect the mRNA levels of p16, IL-6, IL-1β, and TGF-β. f Growth curve of primary Men1f/f and Men1∆/∆ MEF cells during serial passages. Isolation and culture of primary MEF cells were performed as described in the Methods. The cells were treated with 1 μm TAM and seeded in 6 cm dishes every 3 days. n = 3 for Men1f/f and Men1Δ/Δ, respectively. g Quantification of the SA-β-gal-positive cells shown in Supplementary Fig. 6i. h The mRNA expression of p16, TGF-β, and IL-6 was measured by RT-qPCR in primary Men1f/f and Men1∆/∆ MEF cells at the indicated passages. Data are represented as mean ± SEM in b, g and as mean ± SD in c, d, e, and h. Dots in d depict individual samples and in d, e, and h depict no repeat. Significance determined by two-tailed unpaired t tests in b, c, d, e, g, and h are indicated. ****p < 0.0001. Results in c–g, and h are representative of three independent experiments. Source Data are provided as a Source Data file.

a Automatic quantification of menin, NCAM1, vimentin in human NSCLC (n = 157) and SCLC (n = 34) specimens IHC staining. b H&E and IHC staining for the indicated proteins in clinical lung cancer samples. High or low indicates that the expression of menin in the tumor was similar to or lower than that in tumor-adjacent tissues, respectively. High, menin+ area ≥ 1000; low, menin+ area < 1000. Scale bars, 20 μm. c Venn diagrams show the number of samples with NCAM1 and/or NSE high expression in menin-low and menin-high NSCLC samples. d Correlation analysis between menin and NCAM1 expression, and menin and NSE expression in 157 NSCLC samples. e Kaplan-Meier survival analysis for NSCLC according to menin expression (low, n = 42; high, n = 115; adenocarcinoma: n = 144; adenosquamous carcinoma: n = 13). Data are represented as mean ± SEM in a. Dots in a, d depict individual samples. Significance determined by two-tailed unpaired t tests in a are indicated. The Spearman correlation and p value by Spearman’s test are indicated in d. The Hazard Ratios (HR) and p values by log-rank (Mantel-Cox) test are indicated in e. Source Data are provided as a Source Data file.

a Heatmap of median GI50 values for A549-shLuc and A549-shMEN1 cells treated with 96 small molecule inhibitor compounds for 3 days. The results were ranked according to the difference in sensitivity between A549-shLuc and A549-shMEN1 cells as determined by the GI50 ratios (GI50 A549-shLuc/A549-shMEN1). b
Men1f/f and Men1Δ/Δ MEF cells were treated with SP2509 for 24 h, and the levels of H3K4me3, H3K4me2, H3K4me1, and H3K9me3 modifications in histone extracts were determined via western blotting. c Quantification of the SA-β-gal-positive IMR-90 cells shown in Supplementary Fig. 7b. Cells were transfected with siRNA for 48 h and then treated with 1 μm SP2509 for 4 h. SA-β-gal staining was performed 2 days after exposure to 5 Gy of IR. d Axial microCT images in the indicated planes from WT, KS, KMS, and SP2509-treated (25 mg/kg i.p. injection) KMS mice at 1, 2, and 4 weeks. e Quantification of lung and body weight for KMS-vehicle and SP2509-treated KMS mice at 51 days (WT con: n = 3; WT SP2509: n = 3; KMS con: n = 6; KMS SP2509: n = 6). f Brightfield images of lung tissue from KMS and SP2509-treated KMS mice at 51 days. g Representative images of SA-β-gal staining and IHC staining in consecutive lung sections from KMS-vehicle, and SP2509-treated KMS mice at 51 days. Scale bars, 60 μm. h H&E images (left) and IHC staining for the indicated proteins in lung sections from KMS-vehicle and SP2509-treated KMS mice at 51 days (n = 7 per group). Scale bars, 1 mm (H&E) and 20 μm (IHC). Data are represented as mean ± SD in c and as mean ± SEM in e. Dots in e depict individual samples. Significance determined by Two-tailed unpaired t tests in c and e are indicated. ****p < 0.0001. Results in b are representative of three independent experiments. Source Data are provided as a Source Data file.
References
-
- II W, AF G, JD M. Molecular genetics of small cell lung carcinoma. Semin Oncol. 2001;28:3–13. - PubMed
Publication types
MeSH terms
Substances
LinkOut - more resources
Full Text Sources
Medical
Molecular Biology Databases
Miscellaneous
