. 2020 Feb 21;11(1):996.
doi: 10.1038/s41467-020-14793-0.

Serial protein crystallography in an electron microscope

Affiliations

Serial protein crystallography in an electron microscope

Robert Bücker et al. Nat Commun. .

Abstract

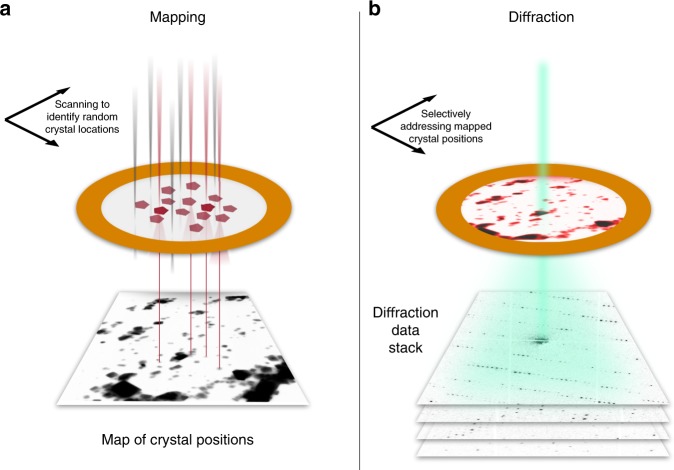
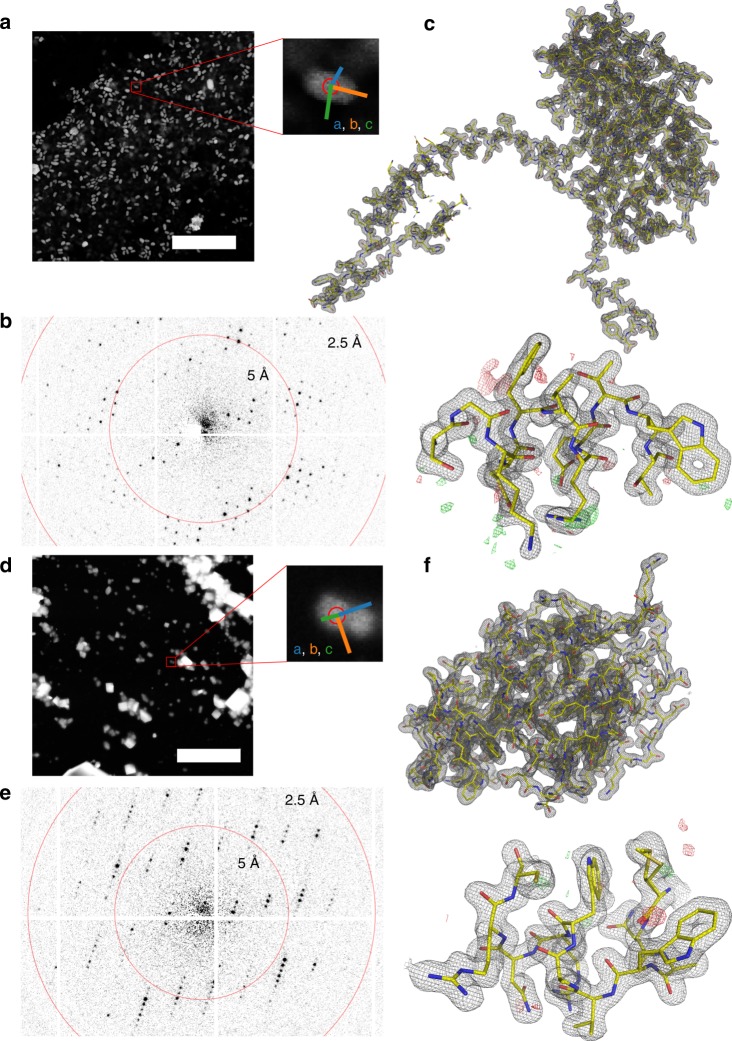
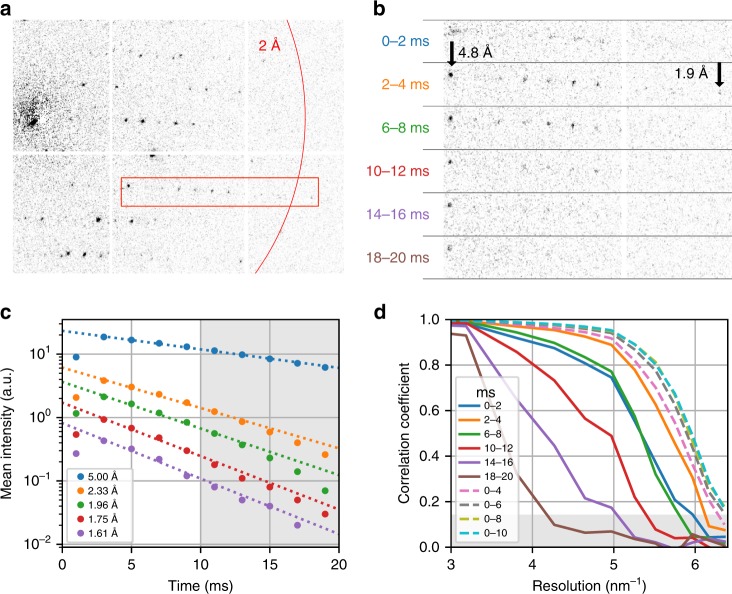
Serial X-ray crystallography at free-electron lasers allows to solve biomolecular structures from sub-micron-sized crystals. However, beam time at these facilities is scarce, and involved sample delivery techniques are required. On the other hand, rotation electron diffraction (MicroED) has shown great potential as an alternative means for protein nano-crystallography. Here, we present a method for serial electron diffraction of protein nanocrystals combining the benefits of both approaches. In a scanning transmission electron microscope, crystals randomly dispersed on a sample grid are automatically mapped, and a diffraction pattern at fixed orientation is recorded from each at a high acquisition rate. Dose fractionation ensures minimal radiation damage effects. We demonstrate the method by solving the structure of granulovirus occlusion bodies and lysozyme to resolutions of 1.55 Å and 1.80 Å, respectively. Our method promises to provide rapid structure determination for many classes of materials with minimal sample consumption, using readily available instrumentation.


Conflict of interest statement

The authors declare no competing interests.

Figures

Fig. 1
Fig. 1. Serial nanobeam electron diffraction scheme.
a The sample is first mapped in low-dose STEM mode over a large region (typically ≈20 µm edge length), yielding a real-space image. Crystals show up as clear features and can be identified automatically. b The beam of ≈100 nm diameter is sequentially steered to each found crystal position, and diffraction patterns are acquired at a rate of up to 1 kHz.
Fig. 2
Fig. 2. SerialED results for granulovirus occlusion bodies and lysozyme.
a STEM mapping image of a grid section containing granuloviruses, visible as bright features (scale bar is 5 μm). A zoomed view of a representative virus is shown, where the red circle corresponds to the diffraction nanobeam diameter of ≈110 nm. Colored lines indicate the lattice vectors found after indexing of the diffraction pattern. b Diffraction pattern acquired from the features shown in a. c Obtained structures of granulin; 2Fo−Fc map of the entire structure, and zoom into a randomly chosen region, with Fo−Fc map overlaid. The maps are at 1.55 Å resolution and contoured at ±1σ and ±3σ, respectively. df Analogous for lysozyme nanocrystals; maps are at 1.8 Å resolution.
Fig. 3
Fig. 3. Radiation damage during dose-fractionated acquisition.
a Typical diffraction pattern from a granulovirus occlusion body. The red box indicates the enlarged region in b. b Enlarged diffraction pattern section for several single frames from the dose-fractionated movie stack, each of 2 ms duration. The integration time of each frame relative to the beam first hitting the crystal is specified. Note the fading of the diffraction spots, especially at high resolutions. The first shot is affected by residual beam motion and hence has a shorter effective integration time and shows blurring artefacts. c Mean intensity of Bragg reflections for different resolution shells as a function of delay time, and exponential fit lines, where the first time point has been excluded from the fit. The shaded area corresponds to delay times beyond 10 ms, which have been excluded from our data analysis. d Resolution-dependent correlation coefficients CC1/2 shown from 3.33 to 1.55 Å resolution. Solid lines correspond to single movie frames as in b. Dashed lines correspond to images that were cumulatively summed over several frames. The shaded area corresponds to values CC1/2 <0.143, where data falls below the resolution cut-off at CC* = 0.5.
Fig. 4
Fig. 4. Ray path diagrams for mapping (focused) and diffraction (collimated) condenser configuration.
Red and blue lines correspond to on-axis and one exemplary off-axis positions of the beam. Dotted lines correspond to a Bragg reflection. Optical planes and electron-optical elements are shown in black and gray, respectively. a In the mapping configuration, the beam is collimated by the lower condenser lens (CL 2) and focused on the sample using the objective lens pre-field (OL pre). Scattered beams from the illuminated sample position are imaged on the high-angle annular dark field (HAADF) detector using the objective lens post-field (OL post) and the intermediate and projection lenses (IL/PL). b In the diffraction configuration, on the other hand, the condenser focuses the beam on the front-focal plane (FFP) of the objective. Diffraction orders now appear as discrete spots on the diffraction detector (CAM). Note that switching between these configurations involves changing of the CL 2 excitation only, as the detectors always remain in a plane conjugate with the back and front-focal planes of the objective lens (diffraction mode). SPOT—first condenser lens (spot) crossover; DEF1/2—upper and lower beam deflector pair; IMG—intermediate image plane.

References

    1. Henderson R. The potential and limitations of neutrons, electrons and X-rays for atomic resolution microscopy of unstained biological molecules. Q. Rev. Biophys. 1995;28:171–193. doi: 10.1017/S003358350000305X. - DOI - PubMed
    1. Glaeser RM. How good can single-particle cryo-EM become? What remains before it approaches its physical limits? Annu. Rev. Biophys. 2019;48:45–61. doi: 10.1146/annurev-biophys-070317-032828. - DOI - PubMed
    1. Schönherr R, Rudolph JM, Redecke L. Protein crystallization in living cells. Biol. Chem. 2018;399:751–772. doi: 10.1515/hsz-2018-0158. - DOI - PubMed
    1. Owen RL, Rudino-Pinera E, Garman EF. Experimental determination of the radiation dose limit for cryocooled protein crystals. Proc. Natl Acad. Sci. USA. 2006;103:4912–4917. doi: 10.1073/pnas.0600973103. - DOI - PMC - PubMed
    1. Chapman HN, et al. Femtosecond X-ray protein nanocrystallography. Nature. 2011;470:73–77. doi: 10.1038/nature09750. - DOI - PMC - PubMed

Publication types

MeSH terms