

New insights into cheddar cheese microbiota-metabolome relationships revealed by integrative analysis of multi-omics data
- PMID: 32081987
- PMCID: PMC7035325
- DOI: 10.1038/s41598-020-59617-9
New insights into cheddar cheese microbiota-metabolome relationships revealed by integrative analysis of multi-omics data
Erratum in
-
Author Correction: New insights into cheddar cheese microbiota-metabolome relationships revealed by integrative analysis of multi-omics data.Sci Rep. 2021 Jan 25;11(1):2680. doi: 10.1038/s41598-021-82097-4. Sci Rep. 2021. PMID: 33495487 Free PMC article. No abstract available.
Abstract
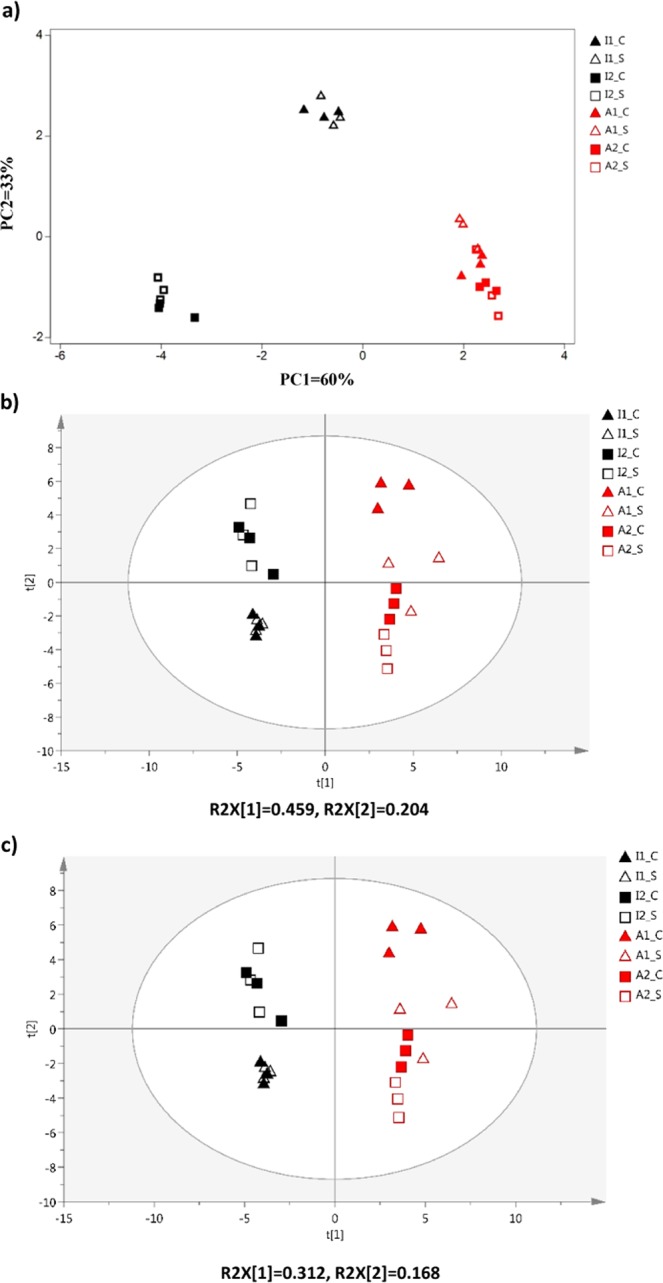
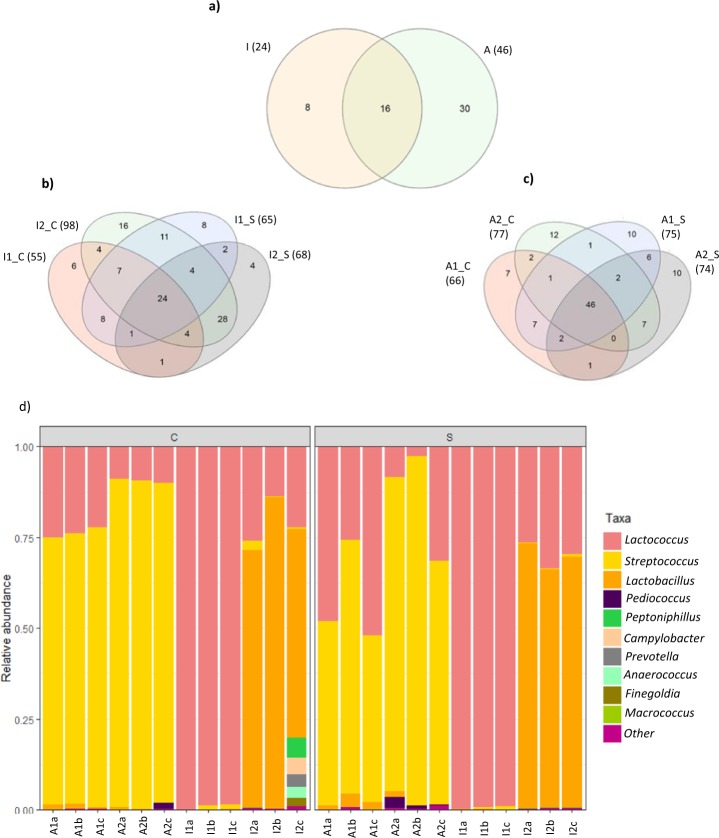
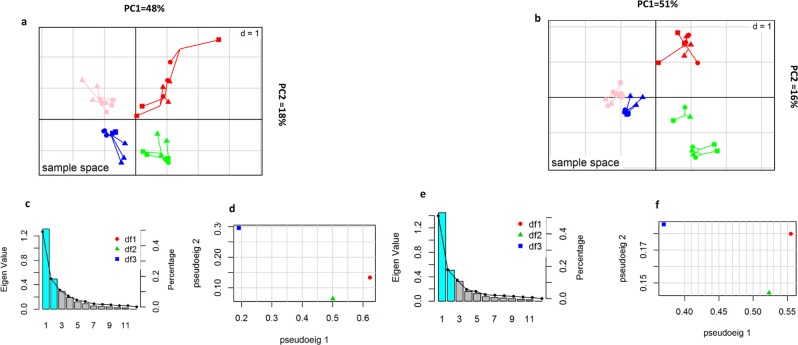
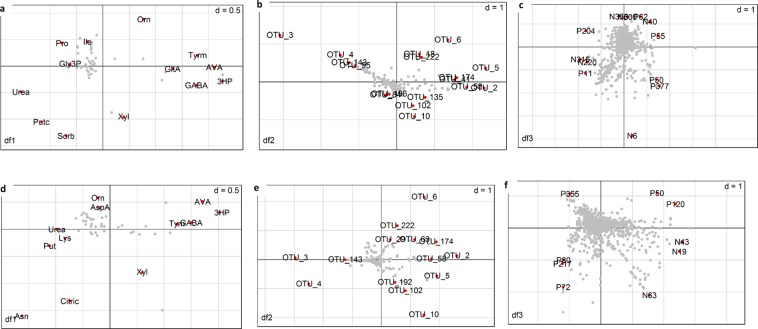
Cheese microbiota and metabolites and their inter-relationships that underpin specific cheese quality attributes remain poorly understood. Here we report that multi-omics and integrative data analysis (multiple co-inertia analysis, MCIA) can be used to gain deeper insights into these relationships and identify microbiota and metabolite fingerprints that could be used to monitor product quality and authenticity. Our study into different brands of artisanal and industrial cheddar cheeses showed that Streptococcus, Lactococcus and Lactobacillus were the dominant taxa with overall microbial community structures differing not only between industrial and artisanal cheeses but also among different cheese brands. Metabolome analysis also revealed qualitative and semi-quantitative differences in metabolites between different cheeses. This also included the presence of two compounds (3-hydroxy propanoic acid and O-methoxycatechol-O-sulphate) in artisanal cheese that have not been previously reported in any type of cheese. Integrative analysis of multi-omics datasets revealed that highly similar cheeses, identical in age and appearance, could be distinctively clustered according to cheese type and brand. Furthermore, the analysis detected strong relationships, some previously unknown, which existed between the cheese microbiota and metabolome, and uncovered specific taxa and metabolites that contributed to these relationships. These results highlight the potential of this approach for identifying product specific microbe/metabolite signatures that could be used to monitor and control cheese quality and product authenticity.
Conflict of interest statement
The authors declare no competing interests.
Figures
Similar articles
-
Bacterial microbiota of Kazakhstan cheese revealed by single molecule real time (SMRT) sequencing and its comparison with Belgian, Kalmykian and Italian artisanal cheeses.BMC Microbiol. 2017 Jan 9;17(1):13. doi: 10.1186/s12866-016-0911-4. BMC Microbiol. 2017. PMID: 28068902 Free PMC article.
-
Large-scale mapping of microbial diversity in artisanal Brazilian cheeses.Food Microbiol. 2019 Jun;80:40-49. doi: 10.1016/j.fm.2018.12.014. Epub 2018 Dec 26. Food Microbiol. 2019. PMID: 30704595
-
Bacterial ecology of artisanal Minas cheeses assessed by culture-dependent and -independent methods.Food Microbiol. 2017 Aug;65:160-169. doi: 10.1016/j.fm.2017.02.005. Epub 2017 Feb 12. Food Microbiol. 2017. PMID: 28399998
-
Traditional cheeses: rich and diverse microbiota with associated benefits.Int J Food Microbiol. 2014 May 2;177:136-54. doi: 10.1016/j.ijfoodmicro.2014.02.019. Epub 2014 Mar 3. Int J Food Microbiol. 2014. PMID: 24642348 Review.
-
Microbiological quality and native lactic acid bacteria diversity of artisanal Mexican cheeses: A review.Food Res Int. 2024 Oct;194:114876. doi: 10.1016/j.foodres.2024.114876. Epub 2024 Aug 6. Food Res Int. 2024. PMID: 39232514 Review.
Cited by
-
Tryptophan regulates bile and nitrogen metabolism in two pig gut lactobacilli species in vitro based on metabolomics study.Amino Acids. 2022 Oct;54(10):1421-1435. doi: 10.1007/s00726-022-03179-9. Epub 2022 Jul 15. Amino Acids. 2022. PMID: 35838843
-
Advances in fermented foods revealed by multi-omics: A new direction toward precisely clarifying the roles of microorganisms.Front Microbiol. 2022 Dec 14;13:1044820. doi: 10.3389/fmicb.2022.1044820. eCollection 2022. Front Microbiol. 2022. PMID: 36590428 Free PMC article. Review.
-
Qualitative and Quantitative Metabolite Comparison of Grain, Persimmon, and Apple Vinegars with Antioxidant Activities.Antioxidants (Basel). 2025 Aug 21;14(8):1029. doi: 10.3390/antiox14081029. Antioxidants (Basel). 2025. PMID: 40867925 Free PMC article.
-
Nitrogen use efficiency, rhizosphere bacterial community, and root metabolome reprogramming due to maize seed treatment with microbial biostimulants.Physiol Plant. 2022 Mar;174(2):e13679. doi: 10.1111/ppl.13679. Physiol Plant. 2022. PMID: 35362106 Free PMC article.
-
Microbiome profiling of Grana Padano and Parmigiano Reggiano cheeses reveals cheese-specific biomarkers, psychobiotic potential, and bioprotective activities.NPJ Biofilms Microbiomes. 2025 Aug 27;11(1):177. doi: 10.1038/s41522-025-00815-6. NPJ Biofilms Microbiomes. 2025. PMID: 40858622 Free PMC article.
References
-
- Fox, P. F., McSweeney, P. L., Cogan, T. M. & Guinee, T. P. Cheese: Chemistry, Physics and Microbiology: General Aspects. Vol. 1, London, UK: Elsevier Academic Press, (2004).
Publication types
MeSH terms
Substances
LinkOut - more resources
Full Text Sources
