. 2020 Jan 31:10:1606.
doi: 10.3389/fphys.2019.01606. eCollection 2019.

Caveolin-1 Impacts on TGF-β Regulation of Metabolic Gene Signatures in Hepatocytes

Affiliations

Caveolin-1 Impacts on TGF-β Regulation of Metabolic Gene Signatures in Hepatocytes

Mei Han et al. Front Physiol. .

Abstract

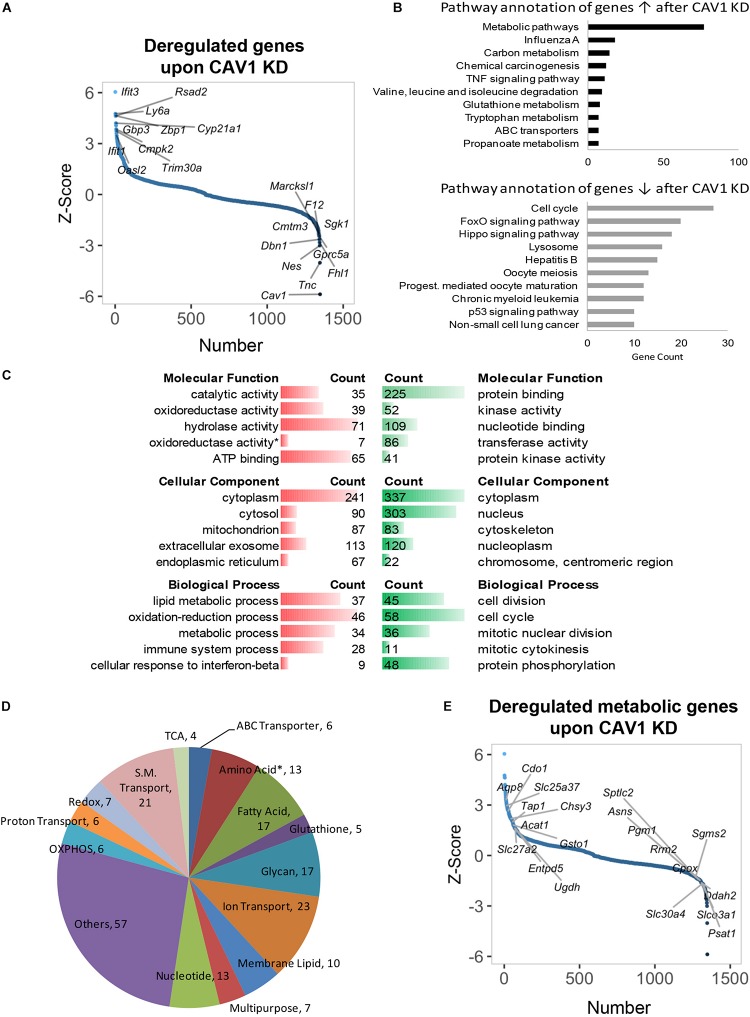
Caveolin-1 (CAV1) is a membrane protein associated with metabolism in various cell types. The transforming growth factor beta (TGF-β) is a pro-fibrogenic cytokine in the liver, but its metabolic gene signatures remain unclear to date. We have previously shown that CAV1 alters TGF-β signaling and blocks its pro-apoptotic function. Here, we defined TGF-β-induced metabolic gene signatures in hepatocytes and assessed whether CAV1 abundance affects TGF-β control of those metabolic genes. Microarray analyses of primary hepatocytes after TGF-β stimulation (48 h) showed differential expression of 4224 genes, of which 721 are metabolic genes (adjusted p < 0.001). Functional annotation analysis revealed that TGF-β mainly suppresses metabolic gene network, including genes involved in glutathione, cholesterol, fatty acid, and amino acid metabolism. TGF-β also upregulated several genes related to glycan metabolism and ion transport. In contrast to TGF-β effects, CAV1 knockdown triggered the upregulation of metabolic genes. Immortalized mouse hepatocytes (AML12 cells) were used to validate the gene changes induced by TGF-β stimulation and CAV1 knockdown. Noteworthy, of the TGF-β metabolic target genes, CAV1 modulated the expression of 228 (27%). In conclusion, we present several novel metabolic gene signatures of TGF-β in hepatocytes and show that CAV1 abundance alters almost a third of these genes. These findings could enable a better understanding of TGF-β function in normal and diseased liver especially where differential CAV1 level is implicated.

Keywords: caveolin-1; liver diseases; metabolism; microarray; transforming growth factor beta.


Figures

FIGURE 1
FIGURE 1
Gene expression profiling and deregulated metabolic genes upon CAV1 knockdown in primary hepatocytes after 48 h. (A) Distribution of altered genes by Z-score (N = 1348, highlighted top 10 upregulated and top 10 downregulated genes). (B) KEGG pathway annotation of total deregulated genes indicated that CAV1 knockdown caused upregulation of metabolic processes. (C) Molecular functions, biological processes, and cellular component analyses of total deregulated genes. (D) Classification of 229 deregulated metabolic genes in biochemical metabolic processes. (E) Distribution of deregulated genes by Z-score (N = 1348, highlighted metabolic top 10 upregulated and top 10 downregulated genes). Data from each analyzed group was from a mixture of three mice. ↑, upregulated; ↓, downregulated; red, upregulated; green, downregulated. , all amino acids besides glutamine and serine.
FIGURE 2
FIGURE 2
Gene expression profile and deregulated metabolic genes of primary hepatocytes treated with TGF-β for 48 h. (A) Distribution of altered genes by Z-score (N = 4224, highlighted top 10 up- and top 10 downregulated genes). (B) KEGG pathway annotation of total upregulated or downregulated genes indicated that TGF-β stimulation suppressed metabolic genes. (C) Molecular functions, biological processes, and cellular component analyses of total deregulated genes. (D) Distribution of deregulated genes by Z-score (N = 4224, highlighted metabolic top 10 upregulated and top 10 downregulated genes). (E) Classification of 721 deregulated metabolic genes in biochemical metabolic processes. ↑, upregulated; ↓, downregulated; red, upregulated; green, downregulated. , all amino acids besides glutamine and serine.
FIGURE 3
FIGURE 3
TGF-β control of metabolic gene signatures was influenced by CAV1. (A) Venn diagram of TGF-β modulated metabolic genes in normal CAV1 expression and after CAV1 knockdown. (B) CAV1-dependent TGF-β regulated genes: Left – 32 genes altered in normal CAV1 expression dataset, *p < 0.05, others p < 0.01. Right – genes altered in CAV1 knockdown dataset (34 genes with a threshold of Z-score > ±0.5). (C) Potentially CAV1-dependent TGF-β regulated genes: 19 upregulated genes with a threshold of ΔZ-score > 0.5 between siCon and siCAV1 datasets; 42 downregulated genes with a threshold of ΔZ-score < –0.5 between siCon and siCAV1 datasets. (D) CAV1-independent TGF-β regulated genes: 19 upregulated genes regulated by TGF-β in both normal CAV1 expression and knockdown datasets with a threshold of average Z-score > 2.0; 25 downregulated genes in both normal CAV1 expression and knockdown datasets, with a threshold of average Z-score < –2.0. siCon, control siRNA; siCAV1, siRNA targeting CAV1.
FIGURE 4
FIGURE 4
Validation of TGF-β regulated genes in AML12 cells. (A) Western blot (CAV1 and pSmad3 expression) and mRNA expression analyses for Cav1 (for validating knockdown) and TGF-β target gene Smad7 (for verifying TGF-β signaling activity), respectively. (B) Clustering scheme of the analyzed 16 metabolic candidate genes altered by TGF-β stimulation in the context of CAV1 abundance (N = 3). (C) mRNA expression of the 16 metabolic genes in AML12 upon CAV1 knockdown and TGF-β stimulation for 24 h. Statistical analysis was done by two-way ANOVA followed by Tukey’s post hoc test. siCon, control siRNA; siCAV1, siRNA targeting CAV1. *p < 0.05; **p < 0.01; ***p < 0.001; ****p < 0.0001.

Similar articles

Cited by

References

    1. Asterholm I. W., Mundy D. I., Weng J., Anderson R. G., Scherer P. E. (2012). Altered mitochondrial function and metabolic inflexibility associated with loss of caveolin-1. Cell Metab. 15 171–185. 10.1016/j.cmet.2012.01.004 - DOI - PMC - PubMed
    1. Attisano L., Wrana J. L. (2002). Signal transduction by the TGF-beta superfamily. Science 296 1646–1647. 10.1126/science.1071809 - DOI - PubMed
    1. Cabrera S., Maciel M., Herrera I., Nava T., Vergara F., Gaxiola M., et al. (2015). Essential role for the ATG4B protease and autophagy in bleomycin-induced pulmonary fibrosis. Autophagy 11 670–684. 10.1080/15548627.2015.1034409 - DOI - PMC - PubMed
    1. Coulouarn C., Factor V. M., Thorgeirsson S. S. (2008). Transforming growth factor-beta gene expression signature in mouse hepatocytes predicts clinical outcome in human cancer. Hepatology 47 2059–2067. 10.1002/hep.22283 - DOI - PMC - PubMed
    1. Dooley S., Ten Dijke P. (2012). TGF-beta in progression of liver disease. Cell Tissue Res. 347 245–256. 10.1007/s00441-011-1246-y - DOI - PMC - PubMed