. 2020 Jan 29:10:1710.
doi: 10.3389/fpls.2019.01710. eCollection 2019.

A Small RNA-Mediated Regulatory Network in Arabidopsis thaliana Demonstrates Connectivity Between phasiRNA Regulatory Modules and Extensive Co-Regulation of Transcription by miRNAs and phasiRNAs

Affiliations

A Small RNA-Mediated Regulatory Network in Arabidopsis thaliana Demonstrates Connectivity Between phasiRNA Regulatory Modules and Extensive Co-Regulation of Transcription by miRNAs and phasiRNAs

Jose A Vargas-Asencio et al. Front Plant Sci. .

Abstract

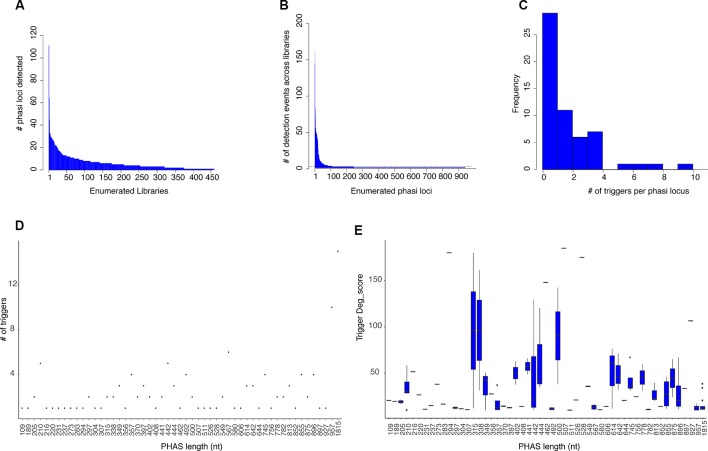
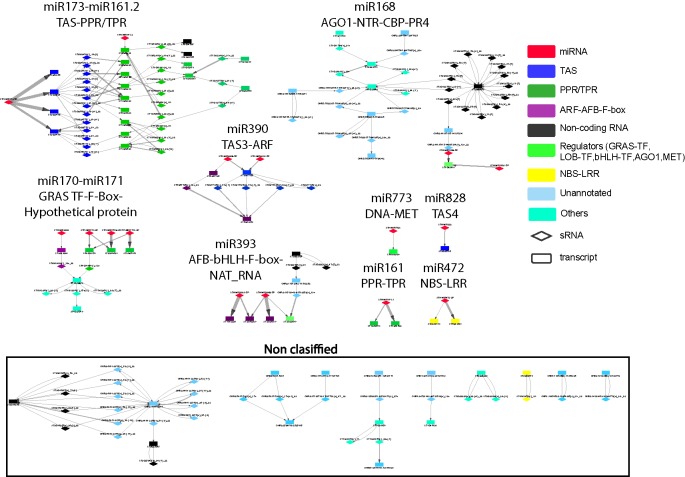
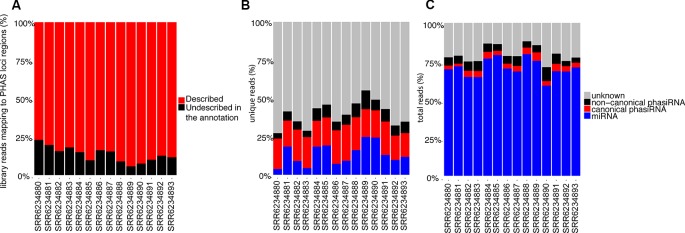
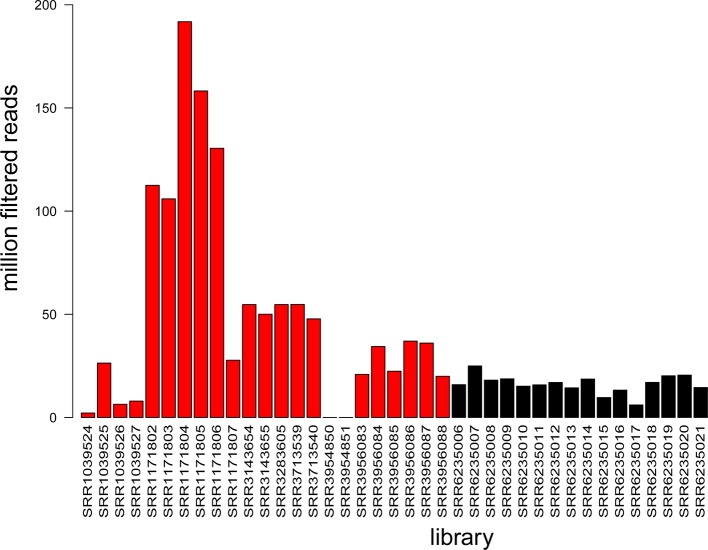
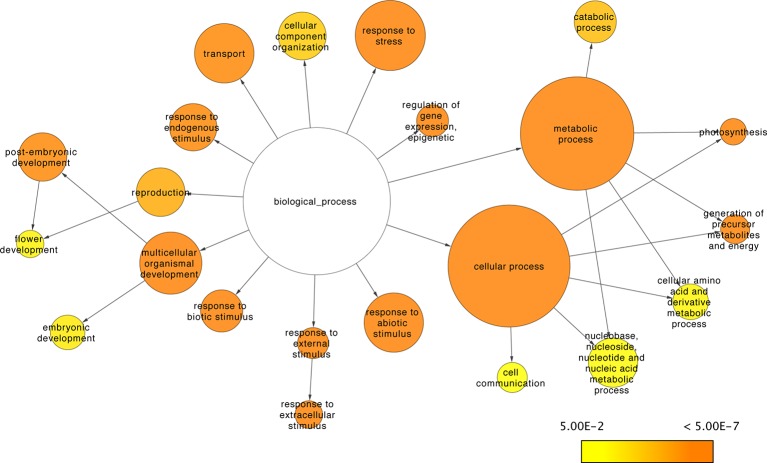
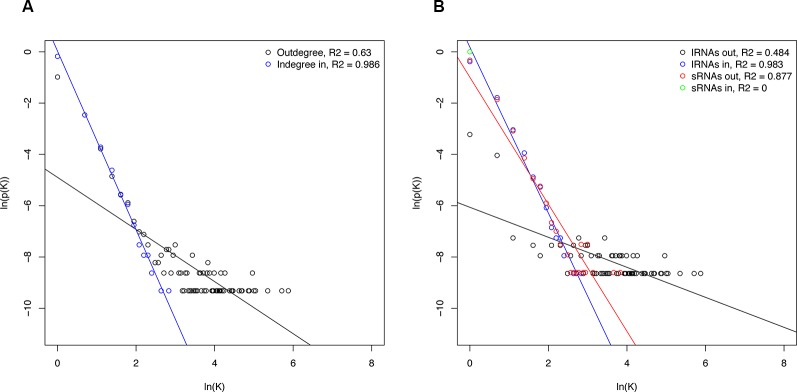
Gene regulation involves the orchestrated action of multiple regulators to fine-tune the expression of genes. Hierarchical interactions and co-regulation among regulators are commonly observed in biological systems, leading to complex regulatory networks. Small RNA (sRNAs) have been shown to be important regulators of gene expression due to their involvement in multiple cellular processes. In plants, microRNA (miRNAs) and phased small interfering RNAs (phasiRNAs) correspond to two well-characterized types of sRNAs involved in the regulation of posttranscriptional gene expression, although information about their targets and interactions with other gene expression regulators is limited. We describe an extended sRNA-mediated regulatory network in Arabidopsis thaliana that provides a reference frame to understand sRNA biogenesis and activity at the genome-wide level. This regulatory network combines a comprehensive evaluation of phasiRNA production and sRNA targets supported by degradome data. The network includes ~17% of genes in the A. thaliana genome, representing ~50% annotated gene ontology (GO) functional categories. Approximately 14% of genes with GO annotations corresponding to regulation of gene expression were found to be under sRNA control. The unbiased bioinformatic approach used to produce the network was able to detect 107 PHAS loci (regions of phasiRNA production), 5,047 active phasiRNAs (~70% of which were non-canonical), and reconstruct 17 regulatory modules resulting from complex regulatory interactions between different sRNA-regulatory pathways. Known regulatory modules like miR173-TAS-PPR/TPR and miR390-TAS3-ARF/F-box were faithfully reconstructed and expanded, illustrating the accuracy and sensitivity of the methods and providing confidence for the validity of findings of previously unrecognized modules. The network presented here includes a 2X increase in the number of identified PHAS loci, a large complement (~70%) of non-canonical phasiRNAs, and the most comprehensive evaluation of sRNA cleavage activity in A. thaliana to date. Structural analysis showed similarities to networks of other biological systems and demonstrated connectivity between phasiRNA regulatory modules with extensive co-regulation of transcripts by miRNAs and phasiRNAs. The described regulatory network provides a reference that will facilitate global analyses of individual plant regulatory programs such as those that control homeostasis, development, and responses to biotic and abiotic environmental changes.

Keywords: Arabidopsis; degradome; miRNA; network; phasiRNA; regulation.


Figures

Figure 1
Figure 1
PHAS loci and phasiRNA triggers. (A) Histogram showing the number of PHAS loci detected per sRNA library across all libraries. Libraries are enumerated in the x axis; 902 libraries were evaluated and only those in which PHAS loci were found (n=426) are shown. The y axis shows the number of PHAS loci detected per library. (B) Histogram summarizing of recognition events (detection) of bona fide PHAS loci across all libraries. PHAS loci are enumerated in the x axis. The y axis shows the number of libraries in which a given PHAS locus was detected. Dotted line indicates the three detection events threshold utilized. (C) Distribution of number of phasiRNA production triggers in PHAS loci. (D) Degradome supported sRNA triggers. A Dot plot representation of the relationship between the number of degradome supported sRNA triggers and the length in nucleotides of the PHAS loci. (E) Boxplot representation of the degradome scores (deg_score) of identified sRNA triggers per PHAS loci length.
Figure 2
Figure 2
Network representation of interactions between phased interfering small RNA producing loci (PHAS) and small RNA (sRNA). PHAS loci connected by sRNA triggers were grouped into modules. Gene families previously reported as associated to PHAS loci and sRNA derived from these loci were colored as follows: miRNA (micro RNA) = red; TAS (Trans-acting small interfering RNAs) = dark blue, PPR/TPR (Pentatricopeptide/Tetratricopeptide repeat-like superfamily) = dark green; ARF-AFB-F-box (Auxin response factor/F-box containing protein) = purple, Non-coding RNA=black, Regulators=light green, NBS-LRR (Nucleotide binding leucine rich repeat protein) = yellow, genes/regions not previously associated to phasiRNA production or unannotated = light blue, Others=cyan. Diamonds represent sRNAs; rectangles represent PHAS loci. Non-coding RNAs include novel transcribed regions, natural antisense RNA, and long non-coding RNAs. Other acronyms are: GRAS TF=GRAS family transcription factor, AGO1=Argonaute 1 protein, MET= DNA (cytosine-5-)-methyltransferase family protein, LOB-TF= LOB domain-containing transcription factor, bHLH-TF= Basic helix-loop-helix (bHLH) DNA-binding superfamily protein transcription factor, CBP=chlorophyll A/B binding protein, NTR=novel transcribed region. The edge thickness between sRNAs and PHAS loci represents the degradome support for each interaction. Details for all of the node names in very small font can be in found in Additional file 5: Table S5 , where they are listed individually within each of the 17 regulatory modules; alternatively they can be read within the (enlarged) online version.
Figure 3
Figure 3
(A) Relative abundance of reads (>50 copies) mapping to PHAS loci that matched annotated phased registers. The category “Described in the annotation” indicates percentage of all reads mapping to regions where PHAS loci were detected that belong to the registers indicated in the annotation. (B) Relative abundance of unique 21 and 22 nt long sRNAs (>50 copies) based on their type, showing the relative proportion of sRNA types among unique reads. (C) Relative abundance of total 21 and 22 nt long sRNAs (>50 copies) based on their type, showing the sRNA types among all reads.
Figure 4
Figure 4
Summary of information available in degradome libraries. The histogram shows library yield as the number of million filtered reads for each of the 39 libraries. Colors: black refers to data produced in this study (16 libraries) and red refers to NCBI SRA data (23 libraries).
Figure 5
Figure 5
Empirical cumulative distribution function of degradome detection events per sRNA-transcript pair across all degradome libraries (n=39). Gray dashed line indicates the location for the degradome score (deg_score) value of 15; black dashed line indicates the corresponding 99% threshold.
Figure 6
Figure 6
Pie chart representation of the relative abundance of sRNA target sites within different regions of their target's genes. The number in parenthesis indicates the total number of target counts for the respective region. CDS, coding sequence; UTR, untranslated region; ncRNA, non-coding RNA; lncRNA, long non-coding RNA; uORF, upstream open reading frame; snoRNA, small nucleolar RNA; snRNA, small nuclear RNA.
Figure 7
Figure 7
Pie chart representation of the relative abundance of phasiRNAs based on their size and phased register.
Figure 8
Figure 8
Representation of the resulting sRNA-mediated regulatory network. sRNA nodes are colored in light blue, transcripts are colored green, and edges are gray. The type and abundance are mentioned for each class of nodes. The network has been manually organized to reflect the biogenesis of sRNAs. Two sets of miRNAs (and numbers) are diagrammed: the miRNAs (412) that do not induce phasiRNA production, and those that induce phasiRNA production (15).
Figure 9
Figure 9
sRNA-mediated network functional analysis. Network representation of GO Slim categories showing enrichment for genes under sRNA regulation. Size of the nodes is proportional to the total amount of genes in the category; color scale indicates the corrected p-values for the enrichment test as described in Maere et al. (2005). Non-colored nodes are not significantly enriched (corrected p-value > 0.05).
Figure 10
Figure 10
Degree distributions of sRNA-mediated network components. (A) Total degree distribution. (B) Degree distribution of the individual sRNA-mediated network components. Degree is represented by K and p(K) and is the number of nodes with degree K divided by total nodes. Regression lines for statistically significant correlations are shown. lRNA, long RNA (=transcripts).

Similar articles

Cited by

References

    1. Addo-Quaye C., Eshoo T. W., Bartel D. P., Axtell M. J. (2008). Endogenous siRNA and miRNA targets identified by sequencing of the Arabidopsis degradome. Curr. Biol. 18, 758–762. 10.1016/j.cub.2008.04.042 - DOI - PMC - PubMed
    1. Addo-Quaye C., Miller W., Axtell M. J. (2009). CleaveLand: a pipeline for using degradome data to find cleaved small RNA targets. Bioinformatics 25, 130–131. 10.1093/bioinformatics/btn604 - DOI - PMC - PubMed
    1. Albert R. (2005). Scale-free networks in cell biology. J. Cell Sci. 118, 4947–4957. Available at: http://jcs.biologists.org/content/118/21/4947.abstract. 10.1242/jcs.02714 - DOI - PubMed
    1. Allen E., Xie Z., Gustafson A. M., Carrington J. C. (2005). microRNA-directed phasing during trans-acting siRNA biogenesis in plants. Cell 121, 207–221. 10.1016/j.cell.2005.04.004 - DOI - PubMed
    1. Boccara M., Sarazin A., Thiébeauld O., Jay F., Voinnet O., Navarro L., et al. (2014). The Arabidopsis miR472-RDR6 silencing pathway modulates PAMP- and effector-triggered immunity through the post-transcriptional control of disease resistance genes. PloS Pathog. 10, e1003883. 10.1371/journal.ppat.1003883 - DOI - PMC - PubMed

LinkOut - more resources