. 2020 Feb 13;9(2):e1110.
doi: 10.1002/cti2.1110. eCollection 2020.

Risk stratification biomarkers for Staphylococcus aureus bacteraemia

Affiliations

Risk stratification biomarkers for Staphylococcus aureus bacteraemia

Yi Cao et al. Clin Transl Immunology. .

Abstract

Objectives: To identify risk stratification biomarkers to enrich for the subset of Staphylococcus aureus bacteraemia patients who develop deep-seated tissue infections with high morbidity and mortality to guide clinical trial enrolment and clinical management.

Methods: We evaluated the prognostic value of eight biomarkers for persistent bacteraemia, mortality and endovascular infection foci in a validation cohort of 160 patients with S. aureus bacteraemia enrolled consecutively over 3 years.

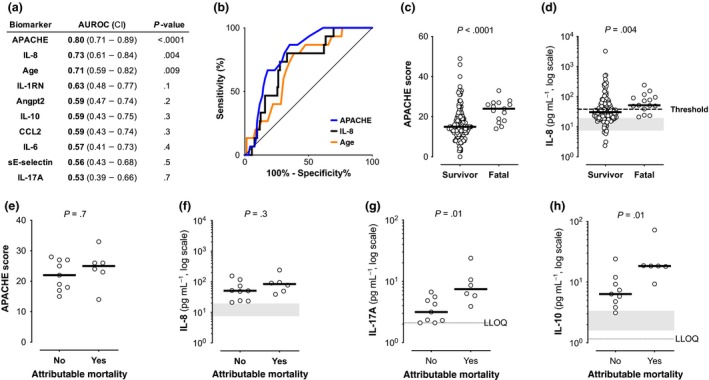
Results: High levels of IL-17A, IL-10 or soluble E-selectin at bacteraemia diagnosis correlated with the duration of positive blood cultures. When thresholds defined in an independent cohort were applied, these biomarkers were robust predictors of persistent bacteraemia or endovascular infection. High serum levels of IL-17A and IL-10 often preceded the radiographic diagnosis of infective endocarditis, suggesting potential utility for prioritising diagnostic radiographic imaging. High IL-8 was prognostic for all-cause mortality, while IL-17A and IL-10 were superior to clinical metrics in discriminating between attributable mortality and non-attributable mortality. High IL-17A and IL-10 identified more patients who developed microbiological failure or mortality than were identified by infective endocarditis diagnosis.

Conclusion: These biomarkers offer potential utility to identify patients at risk of persistent bacteraemia to guide diagnostic imaging and clinical management. Low biomarker levels could be used to rule out the need for more invasive TEE imaging in patients at lower risk of infective endocarditis. These biomarkers could enable clinical trials by enriching for patients with the greatest need for novel therapies.

Keywords: Staphylococcus aureus; bacteraemia; endocarditis; prognostic biomarkers.


Conflict of interest statement

YC, AOG, MCP, OM, KH, MC‐T and CMR were employees of Genentech, Inc. during the execution of this study. VGF served as Chair of V710 Scientific Advisory Committee (Merck); has received grant support from Cerexa/Actavis/Allergan, Pfizer, Advanced Liquid Logics, NIH, MedImmune, Basilea, Karius, ContraFect, Regeneron and Genentech; has NIH STTR/SBIR grants pending with Affinergy, Locus and Medical Surface, Inc; has been a paid consultant for Achaogen, Astellas, Arsanis, Affinergy, Basilea, Bayer, Cerexa, ContraFect, Cubist, Debiopharm, Durata, Grifols, Genentech, MedImmune, Merck, Medicines Co., Pfizer, Novartis, NovaDigm, Theravance and xBiotech; has received honoraria from Theravance and Green Cross; and has a patent pending in sepsis diagnostics. Other authors have no competing interests.

Figures

Figure 1
Figure 1
Biomarkers prognostic for persistent bacteraemia. (a) Baseline biomarker area under the receiver operating characteristic curve with 95% confidence intervals [AUROC (CI)] and unadjusted Mann–Whitney U‐test P‐values between persistent and non‐persistent bacteraemia. (b) ROC curves for biomarkers significantly prognostic for persistence identified in a (P < 0.05). (c–e) Significantly higher IL‐17A, IL‐10 and sE‐selectin levels at presentation in patients with persistent vs. non‐persistent bacteraemia. Median values as black bars, P = unadjusted Mann–Whitney U‐test. (f–h) Spearman correlations (rho and P‐values) between duration of positive blood culture (BC) and higher IL‐17A, IL‐10 or sE‐selectin. n = 156 subjects with available blood culture data. Dotted lines indicate lower limit of quantification (LLOQ) (2.1 pg mL−1 for IL‐17A, 1.2 pg mL−1 for IL‐10 and 5.1 pg mL−1 for sE‐selectin) or upper limit of quantification (ULOQ) (48 920 pg mL−1 for sE‐selectin). Grey shaded area represents the range of the healthy control values for IL‐10 and sE‐selectin, with healthy IL‐17A levels below LLOQ (n = 16). The ULOQ for sE‐selectin (48 920 pg mL−1) was assigned for 25% (28/112) of non‐persistent and 34% (15/44) of persistent patients when levels were above this value. Biomarker values shown are the average of technical triplicate measurements.
Figure 2
Figure 2
IL‐17A, IL‐10 and sE‐selectin identify patients with infective endocarditis and endovascular infections. (a) Baseline biomarker area under the receiver operating characteristic curve with 95% confidence intervals [AUROC (CI)] and unadjusted Mann–Whitney U‐test P‐values between infectious endocarditis (IE) vs. all other foci. (b) ROC curves for biomarkers associated with IE identified in a (P < 0.05). (c–e) Patients with endovascular infection (white circles) have higher median IL‐17A, IL‐10 and sE‐selectin levels (black bars) than patients with extravascular infections (grey circles). IE, n = 43; non‐endocarditis endovascular (non‐IE), n = 37; and extravascular (osteoarticular, soft tissue and other foci) infection foci, n = 80. Unadjusted Mann–Whitney U‐test P‐values (P), LLOQs and healthy control range as described in Figure 1. Biomarker values shown are the average of technical triplicate measurements.
Figure 3
Figure 3
High biomarker levels precede infective endocarditis diagnosis. Serum levels of (a) IL‐17A or (b) IL‐10 measured within the first 3 days (indicated by vertical line) were plotted against the day of endocarditis diagnosis. Horizontal dotted line indicates biomarker threshold for classifying IE defined using previous cohort to maximise sensitivity and specificity. Thresholds for IL‐17A and IL‐10 identified 71% and 65%, respectively, of IE patients diagnosed after day 3 (to the right of the vertical line). Black circles denote persistent bacteraemia, n = 34, with available timing of TEE imaging. LLOQs and healthy control range as described in Figure 1. Biomarker values shown are the average of technical triplicate measurements.
Figure 4
Figure 4
Biomarkers prognostic for mortality. (a) Biomarker area under the receiver operating characteristic curve with 95% confidence intervals [AUROC (CI)] and P‐values between all‐cause 90‐day mortality vs. survival for baseline serum proteins levels, age and APACHE II score (the only clinical parameters at presentation that were significantly different between fatal cases and survivors), n = 160. (b) ROC curves comparing prognostic power for all‐cause 90‐day mortality for significant metrics identified in a. (c, d) Increased baseline median APACHE II score and serum IL‐8 in fatal cases vs. survivors. Dotted line indicates 38 pg mL−1 IL‐8 threshold. (e–h) Median APACHE II score or IL‐8 levels did not distinguish between attributable vs. non‐attributable mortality, while IL‐17A and IL‐10 levels were significantly higher in cases of attributable mortality. n = 15 fatal cases; unadjusted Mann–Whitney U‐test P‐values (P), LLOQs and healthy control range as described in Figure 1. Biomarker values shown are the average of technical triplicate measurements.
Figure 5
Figure 5
Biomarker‐guided patient selection enriches for potential clinical trial endpoints. This is a graphical representation of Table 2 data, illustrating patient number and frequency of meeting a composite endpoint of mortality ± persistent bacteraemia ± recurrence of bacteraemia within 90 days. The event rate was increased when patients were selected by IL‐17A biomarker‐high patients (≥ 4 pg mL−1) or by infective endocarditis diagnosis. Biomarker‐guided enrichment selected twice as many subjects as enriched by clinical IE diagnosis, increasing the feasibility of clinical trial enrolment.

References

    1. Guimaraes AO, Cao Y, Hong K et al A prognostic model of persistent bacteremia and mortality in complicated Staphylococcus aureus bloodstream infection. Clin Infect Dis 2019; 68: 1502–1511. - PMC - PubMed
    1. Scott WK, Medie FM, Ruffin F et al Human genetic variation in GLS2 is associated with development of complicated Staphylococcus aureus bacteremia. PLoS Genet 2018; 14: e1007667. - PMC - PubMed
    1. Turner NA, Sharma‐Kuinkel BK, Maskarinec SA et al Methicillin‐resistant Staphylococcus aureus: an overview of basic and clinical research. Nat Rev Microbiol 2019; 17: 203–218. - PMC - PubMed
    1. McNicholas S, Talento AF, O'Gorman J et al Cytokine responses to Staphylococcus aureus bloodstream infection differ between patient cohorts that have different clinical courses of infection. BMC Infect Dis 2014; 14: 580. - PMC - PubMed
    1. Rose WE, Eickhoff JC, Shukla SK et al Elevated serum interleukin‐10 at time of hospital admission is predictive of mortality in patients with Staphylococcus aureus bacteremia. J Infect Dis 2012; 206: 1604–1611. - PMC - PubMed

LinkOut - more resources