Review
. 2020 Jan 30:7:487.
doi: 10.3389/fbioe.2019.00487. eCollection 2019.

Recent Progress in NIR-II Contrast Agent for Biological Imaging

Affiliations
Review

Recent Progress in NIR-II Contrast Agent for Biological Imaging

Jie Cao et al. Front Bioeng Biotechnol. .

Abstract

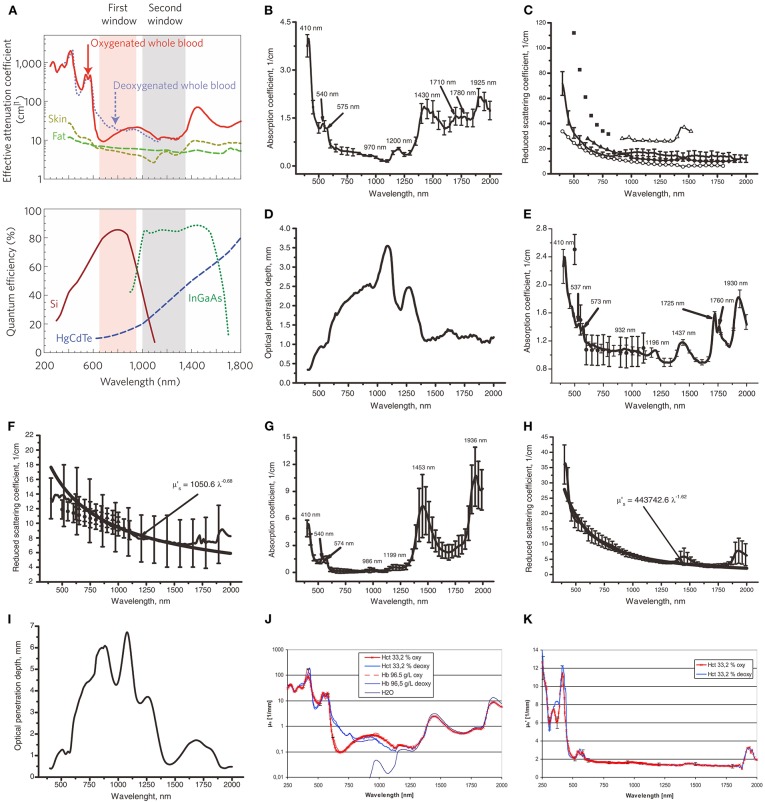
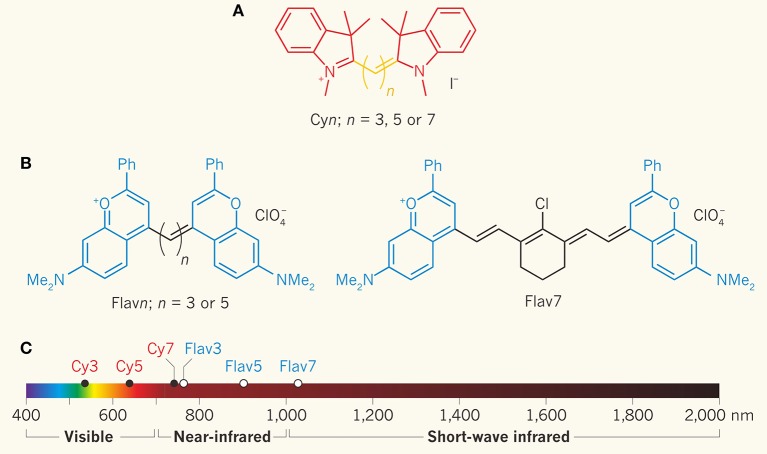
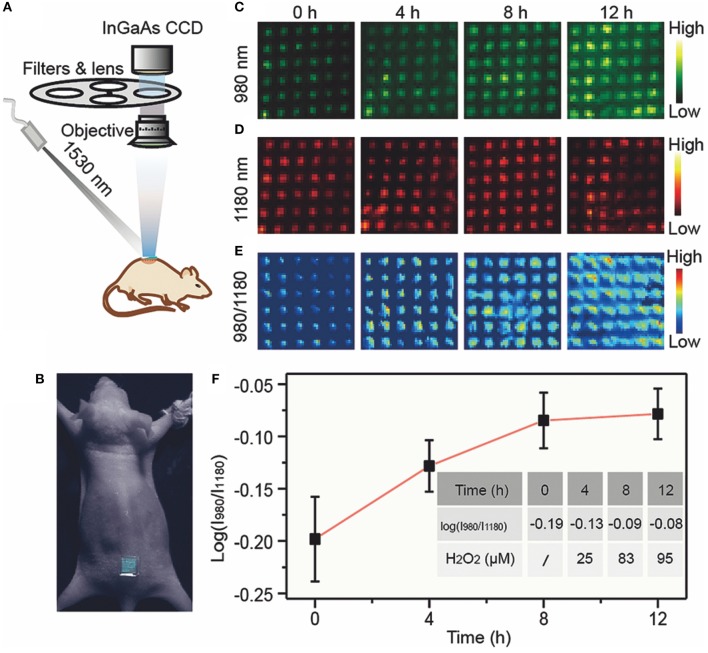
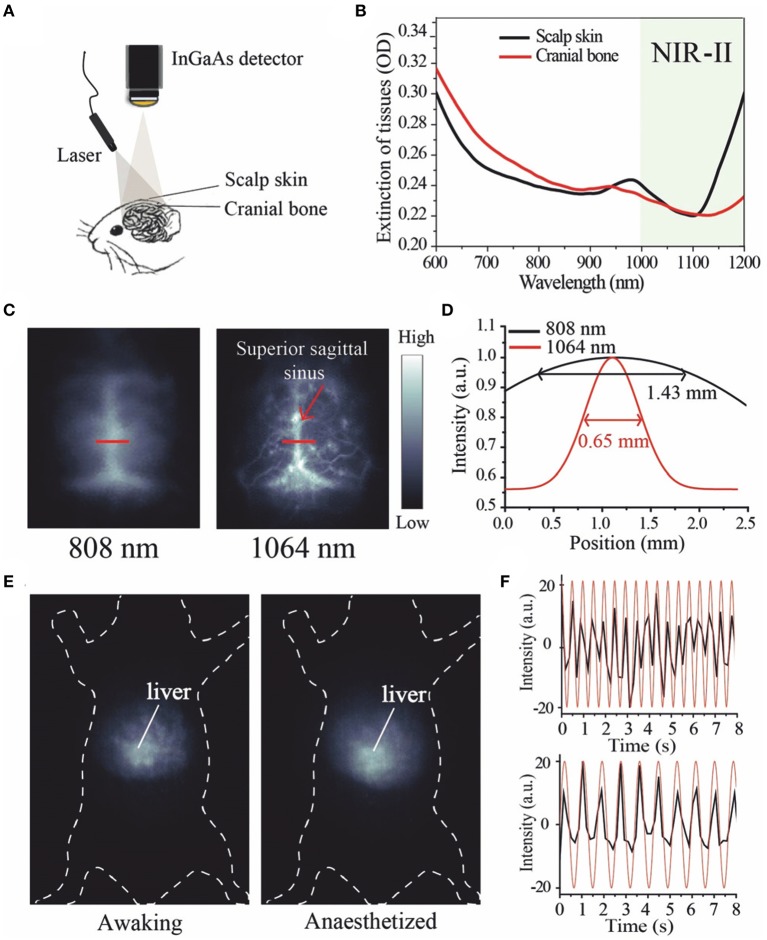
Fluorescence imaging technology has gradually become a new and promising tool for in vivo visualization detection. Because it can provide real-time sub-cellular resolution imaging results, it can be widely used in the field of biological detection and medical detection and treatment. However, due to the limited imaging depth (1-2 mm) and self-fluorescence background of tissue emitted in the visible region (400-700 nm), it fails to reveal biological complexity in deep tissues. The traditional near infrared wavelength (NIR-I, 650-950 nm) is considered as the first biological window, because it reduces the NIR absorption and scattering from blood and water in organisms. NIR fluorescence bioimaging's penetration is larger than that of visible light. In fact, NIR-I fluorescence bioimaging is still interfered by tissue autofluorescence (background noise), and the existence of photon scattering, which limits the depth of tissue penetration. Recent experimental and simulation results show that the signal-to-noise ratio (SNR) of bioimaging can be significantly improved at the second region near infrared (NIR-II, 1,000-1,700 nm), also known as the second biological window. NIR-II bioimaging is able to explore deep-tissues information in the range of centimeter, and to obtain micron-level resolution at the millimeter depth, which surpass the performance of NIR-I fluorescence imaging. The key of fluorescence bioimaging is to achieve highly selective imaging thanks to the functional/targeting contrast agent (probe). However, the progress of NIR-II probes is very limited. To date, there are a few reports about NIR-II fluorescence probes, such as carbon nanotubes, Ag2S quantum dots, and organic small molecular dyes. In this paper, we surveyed the development of NIR-II imaging contrast agents and their application in cancer imaging, medical detection, vascular bioimaging, and cancer diagnosis. In addition, the hotspots and challenges of NIR-II bioimaging are discussed. It is expected that our findings will lay a foundation for further theoretical research and practical application of NIR-II bioimaging, as well as the inspiration of new ideas in this field.

Keywords: biological imaging; biomedical applications; contrast agents; fluorescence imaging technology; the second region near infrared (NIR-II).


Figures

Figure 1
Figure 1
Prahl et al. (1993) reported the inverse double increase (IAD) method and the power law approximation are used to process experimental data and determine the optical properties of tissues. In this figure, μ's is calculated as μ's = μs (1-g), where μs is the scattering coefficient and g is the anisotropic coefficient of scattering. The solid line corresponds to the average experimental data, and the vertical line shows the SD value. (A Top) NIR-I (first window) and NIR-II (second window) imaging windows (Smith et al., 2009). The effective attenuation coefficient represents the how easily a volume of material can be penetrated by a beam of light. (A Bottom) The sensitivity curves of the sensor in the signal detector camera with silicon (Si), indium gallium arsenic (InGaAs), and mercury telluride cadmium (HgCdTe). Unlike the charge coupled device (CCD) camera using silicon sensor, the core component of near infrared camera is semiconductor alloy sensor, including InGaAs and HgCdTe, which has a narrower band gap. In particular, InGaAs cameras exhibit high quantum efficiency when used in the NIR-II window, i.e., high sensitivity. Adapted from Smith et al. (2009) written by Smith, A.M., etc. with permission. (B,C) Show the relationship between the incident light wavelength and absorption coefficient (μa) or the reduced light scattering coefficient (μ's) in human skin in vitro, respectively. (B) Adapted from Bashkatov et al. (2005) with permission. In (C), except for the solid line, the remaining data marker points correspond to the experimental data obtained in reference (Chan et al., ; Simpson et al., ; Du et al., ; Troy and Thennadil, ; Bashkatov et al., 2005). Adapted from Chan et al. (1996), Simpson et al. (1998), Du et al. (2001), Troy and Thennadil (2001), and Bashkatov et al. (2005) with permission. (D,I) Show the penetration depth (δ) of light to skin and human mucosal tissue in the range of incident light wavelength from 400 to 2,000 nm, respectively. Adapted from Bashkatov et al. (2005) with permission. (E,F) Show the relationship between wavelength and μa or μ's in subcutaneous adipose tissue, respectively. In (E), all the data markers except the solid line correspond to the experimental data obtained in Peters et al. (1990). Adapted from Peters et al. (1990) with permission. In (F), all the data markers except the solid line correspond to the experimental data obtained in Peters et al. (1990) and Simpson et al. (1998). Adapted from Peters et al. (1990) and Simpson et al. (1998). with permission. (G,H) Show the relationship between wavelength and μa or μ's in human mucosa, respectively. Adapted from Bashkatov et al. (2005) with permission. (J) Shows the relationship between wavelength and μa for red blood cells (RBC) with or without saturated oxygen in the 33.2% hematocrit (HCT) brine solution, as well as the relationship between wavelength and μa for hemoglobin with or without saturated oxygen in the 96.5 g/dl hemoglobin solution. Adapted from Friebel et al. (2009) with permission. (J) Shows the relationship between wavelength and μ's for RBC with or without saturated oxygen in the 33.2% HCT brine solution. Adapted from Friebel et al. (2009) with permission.
Figure 2
Figure 2
Increasing the length of polymethine chain was proved to result in the red shift of cyanine dye's emission. Cosco et al. developed new methods of heterocyclic conjugation and added new electron donor groups (Cosco et al., ; Zhu et al., 2018). (A) Molecular structure of cyanine dye series of compounds for optical fluorescence imaging. (B) The blue structure is the compound of dimethyl-flavylium heterocycles, which can be used to replace the indolenines to prepare flavylium polymethine fluorophores. (C) The emission and absorption of Flav7, the modified organic small molecule fluorescent dye, was in the NIR-II window. Adapted from Cosco et al. (2017) and Schnermann (2017) with permission.
Figure 3
Figure 3
Construction of NIR-II nanoprobe schematic diagram in surgery for metastatic ovarian cancer guided by NIR-II bioimaging (Wang et al., 2018). The diagram above shows the preparation of DCNPs (DCNPs-L1-FSHβ) modified by DNA and FSHβ. The schematic diagram below shows the further assembly of the NIR-II nanoprobe in vivo by a two-step sequential injection of DCNPs-L1-FSHβ (the first injection) and DCNPs-L2-FSHβ (the second injection), which is beneficial to improve tumor targeting and rapid liver and kidney clearance. Under the guidance of NIR-II imaging, metastatic ovarian tumors can be clearly observed and accurately removed. Adapted from Wang et al. (2018) written by Fan Zhang etc. with permission.
Figure 4
Figure 4
Operational diagram of ratiometer fluorescence sensor (Liu et al., 2018). (A) In vivo bioimaging experimental apparatus. (B) Pictures of mice treated with microneedle patches. After lipopolysaccharide was used to induce inflammation in mice, the upconversion luminescent images of microneedle patch at 980 nm (C), 1,180 nm (D), and ratio (I980/I1180) (E) channels were detected at different times. (F) Ratiometric fluorescence (I980/I1180) of microneedle patches at different time and corresponding H2O2 concentration. Adapted from Liu et al. (2018) written by Fan Zhang etc. with permission.
Figure 5
Figure 5
Fluorescence imaging of rat brain vascular system and breathing rate of mice using NIR-II fluorescence probe FD-1080 (Li et al., 2018). (A) Schematic diagram of NIR-II optical imaging through brain tissue scalp and cranial bone. (B) Extinction spectra of scalp skin and skull. The black curve represents the scalp skin and the red curve represents the skull. (C) Fluorescence images of FD-1080-FBS complex were compared under different excitation conditions as indicated. (D) The fluorescence intensity profile fitted by gaussian was distributed on a red line of interest, with excitation wavelengths of 808 and 1,064 nm, respectively. (E) The distinct emission of the FD-1080-FBS complex made the awake and anesthetized mice imaged, and under the excitation of 1,064 nm detected the signal fluctuations generated by the liver movement. (F) Respiratory rates in awake (upper) and anesthetized (lower) mice. Adapted from Li et al. (2018) written by Fan Zhang etc. with permission.
Figure 6
Figure 6
IVM technique of time-resolved imaging for tumor biomarkers (Fan et al., 2018). (A) A diagram showing the procedure of an animal experiment. Three groups of Er nanoparticles with different lifespans were combined with three antibodies (anti-ER, anti-PR, and anti-HER2) and were transplanted into mice via the caudal vessel. Lifespan distinguished imaging was then accomplished with IVM to quantitatively analyze biomarker expression on the tumor. (B) The lifespan distinguished images of McF-7 and bt-474 tumors were decomposed into three lifespan paths, which were red, green and blue monochromatic images. The pattern of biomarker expression was determined by integrating the intensities of each component and standardizing the overall intensity of the whole tumor area. Using the results of in vitro western blot (C) and in vitro immunohistochemistry assay (D), the biomarker expression modes of IVM in two tumor hypotypes were calculated. Adapted from Fan et al. (2018) written by Fan Zhang etc. with permission.
Figure 7
Figure 7
Ag2S quantum dots of NIR-II emitting were used to track the transplanted MSCs (Chen et al., 2018b). (A) Representative TEM pictures and fluorescence emission spectra of Ag2S QDs with diverse sizes. Adapted from Zhang et al. (2014) written by Qiangbin Wang etc. with permission. (B) Ag2S QDs labeled MSCs were injected into mice by vein, and NIR-II fluorescence imaging was accomplished on the mice with 100 ms exposure. When excited at 808 nm, the InGaAs/SWIR camera was used to obtain the NIR-II image. NIR-II fluorescence signal value in liver and lung of mice at diverse time points was quantitatively analyzed. Adapted from Chen et al. (2018a) written by Qiangbin Wang etc. with permission. (C) MSCs were tracked in mice with acute liver failure and labeled by Ag2S quantum dots. MSCs were injected into mice in combination with or without heparin and imaged. Adapted from Chen et al. (2013) written by Qiangbin Wang etc. with permission. Homing of MSCs was studied by (D) in vivo imaging and (E) fluorescence quantification. The MSCs were transplanted intravenously into a mouse model with skin trauma. The left trauma was cured with a collagen scaffold loaded with SDF1-α. The right trauma was cured with collagen scaffold. The data are shown as mean ± SD values from n = 3, *p < 0.05, **p < 0.01. Adapted from Chen et al. (2015) written by Qiangbin Wang etc. with permission.

References

    1. Andolina C. M., Dewar A. C., Smith A. M., Marbella L. E., Hartmann M. J., Millstone J. E. (2013). Photoluminescent gold-copper nanoparticle alloys with composition-tunable near-infrared emission. J. Am. Chem. Soc. 135, 5266–5269. 10.1021/ja400569u - DOI - PubMed
    1. Antaris A. L., Chen H., Cheng K., Sun Y., Hong G. S., Qu C. R., et al. (2016). A small-molecule dye for NIR-II imaging. Nat. Mater. 15, 235–242. 10.1038/nmat4476 - DOI - PubMed
    1. Bashkatov A. N., Genina E. A., Kochubey V. I., Tuchin V. V. (2005). Optical properties of human skin, subcutaneous and mucous tissues in the wavelength range from 400 to 2000 nm. J. Phys. D Appl. Phys. 38:2543–2555. 10.1088/0022-3727/38/15/004 - DOI
    1. Bhavane R., Starosolski Z., Stupin I., Ghaghada K. B., Annapragada A. (2018). NIR-II fluorescence imaging using indocyanine green nanoparticles. Sci. Rep. 8:14455. 10.1038/s41598-018-32754-y - DOI - PMC - PubMed
    1. Chan E. K., Sorg B., Protsenko D., O'Neil M., Motamedi M., Welch A. J. (1996). Effects of compression on soft tissue optical properties. IEEE J. Sel. Top. Quantum Electron. 2, 943–950. 10.1109/2944.577320 - DOI