

Study of the Relationship between Microbiome and Colorectal Cancer Susceptibility Using 16SrRNA Sequencing
- PMID: 32083132
- PMCID: PMC7011317
- DOI: 10.1155/2020/7828392
Study of the Relationship between Microbiome and Colorectal Cancer Susceptibility Using 16SrRNA Sequencing
Abstract
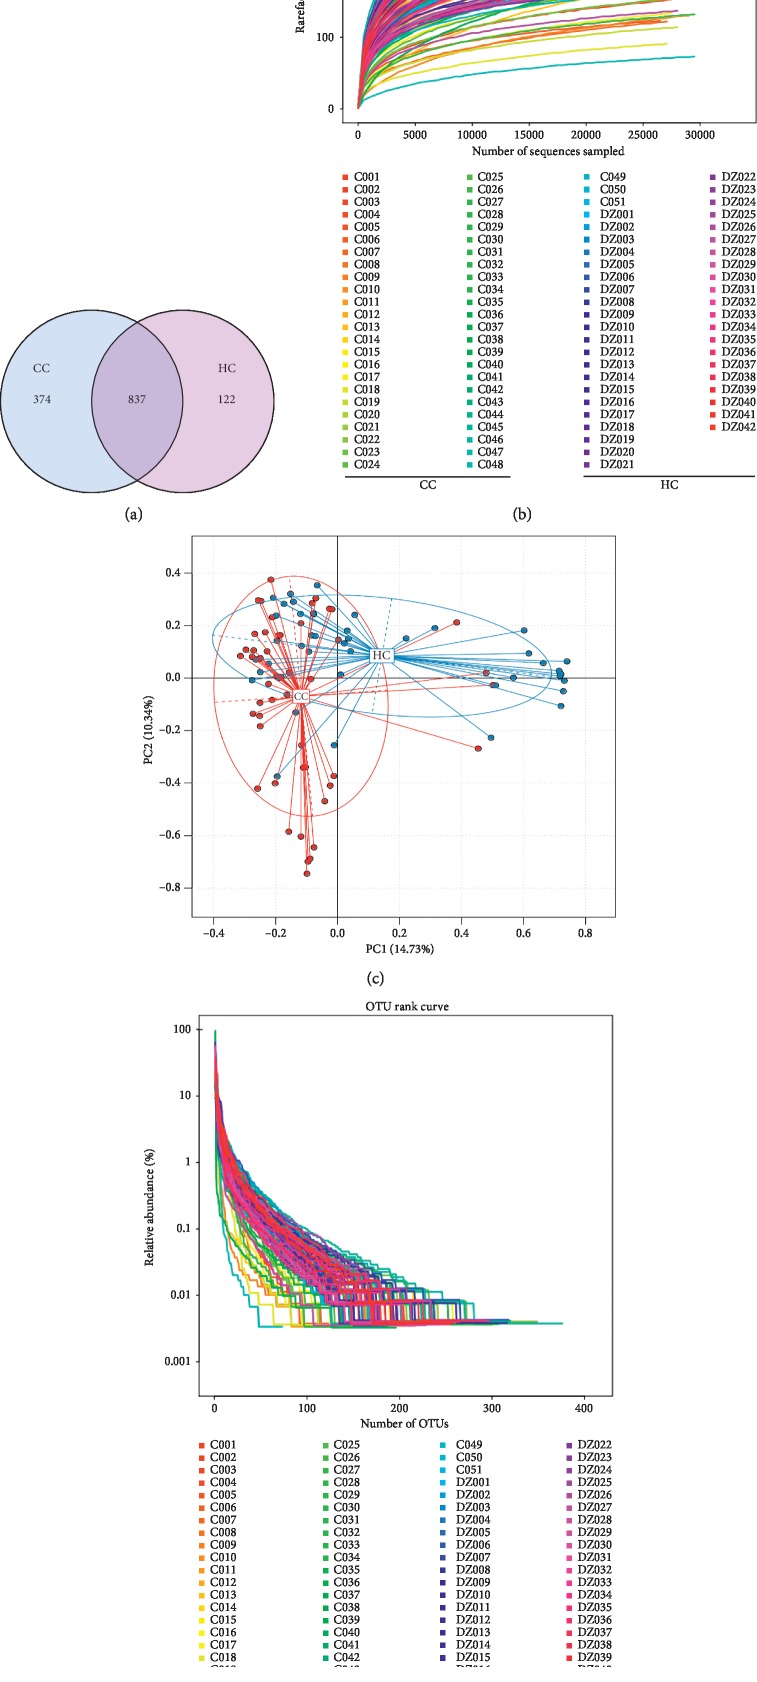
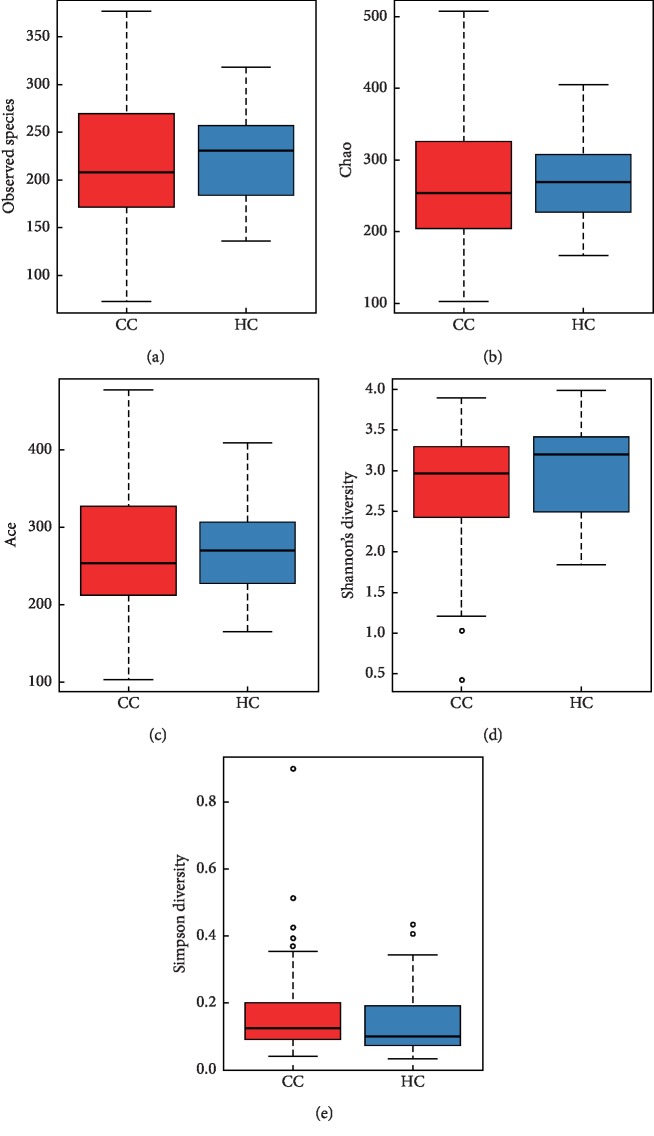
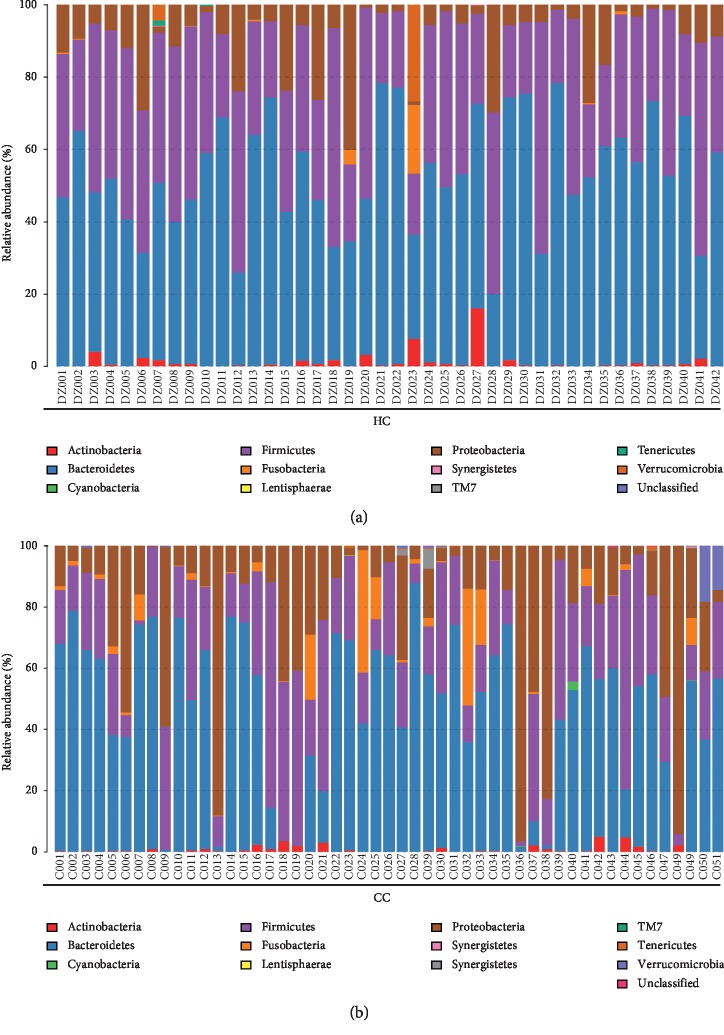
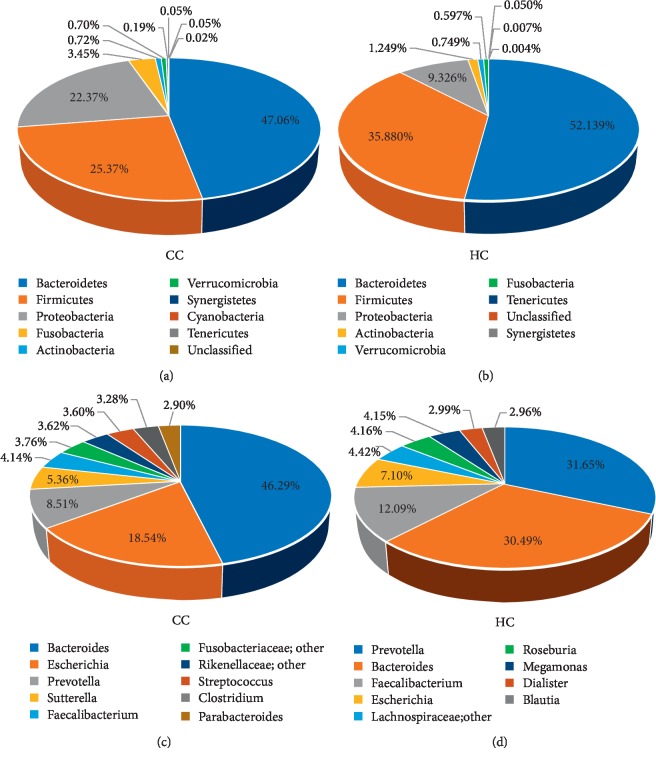
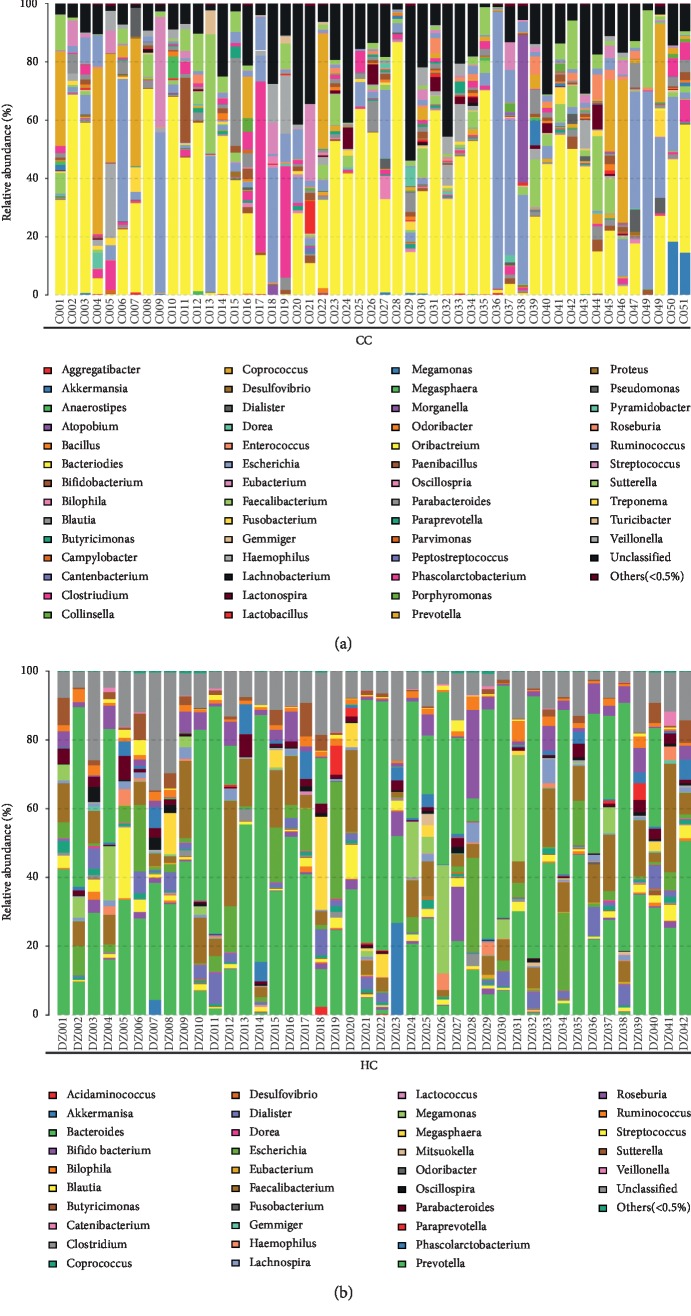
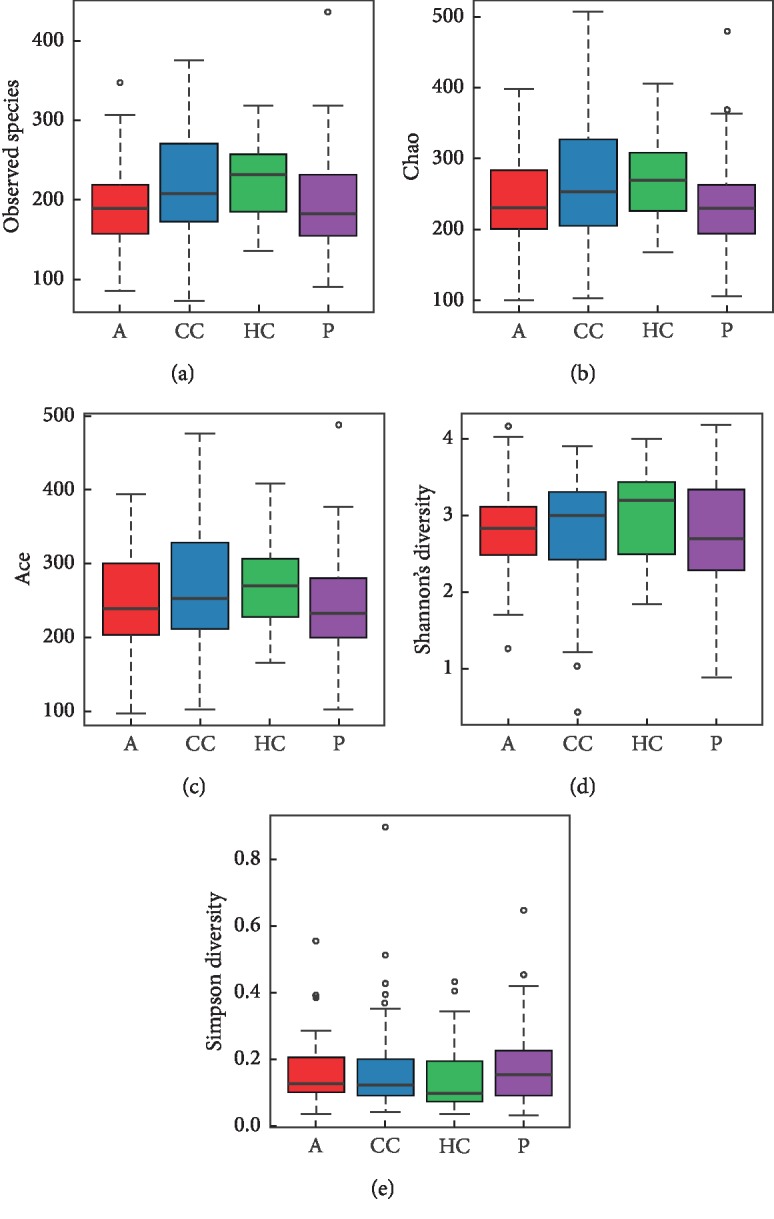
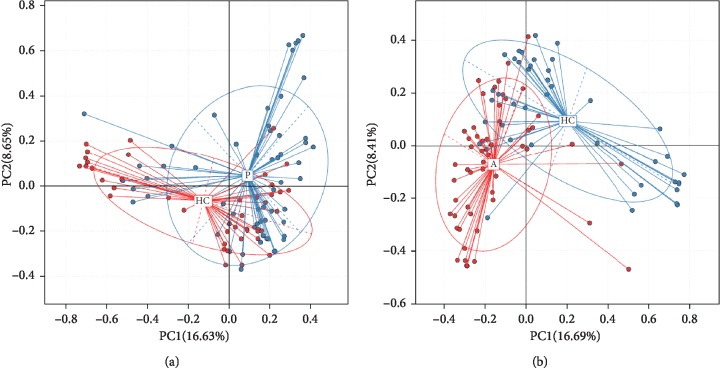
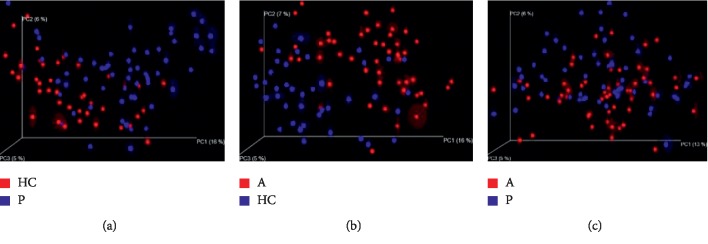
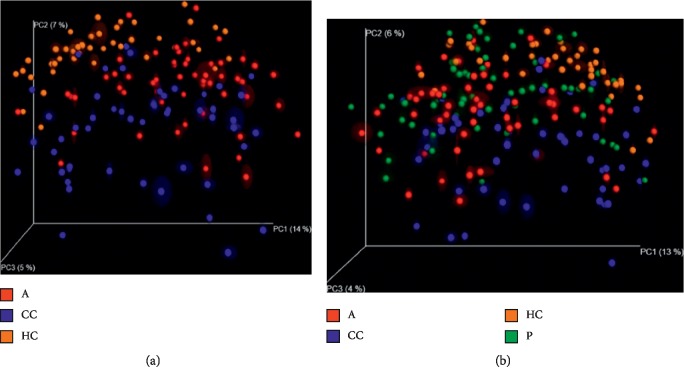
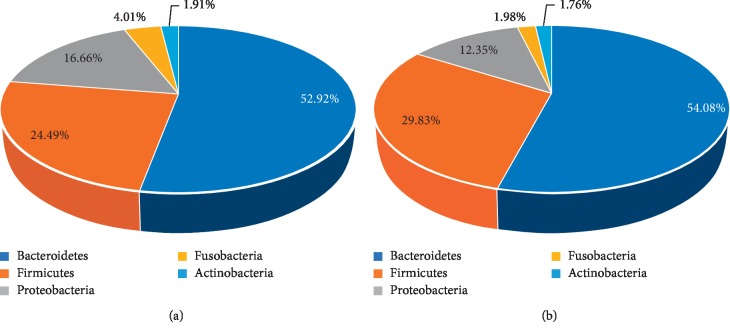
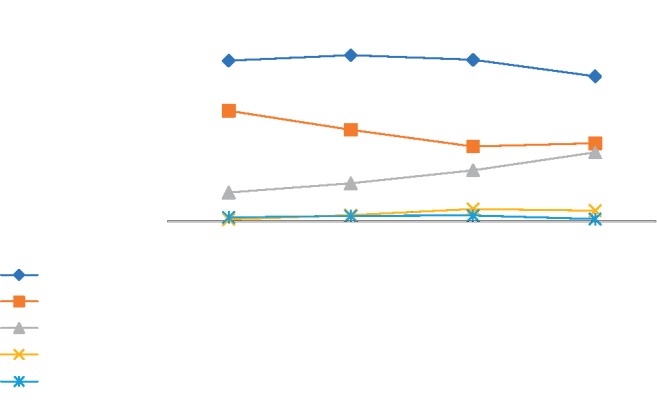
A lot of previous studies have recently reported that the gut microbiota influences the development of colorectal cancer (CRC) in Western countries, but the role of the gut microbiota in Chinese population must be investigated fully. The goal of this study was to determine the role of the gut microbiome in the initiation and development of CRC. We collected fecal samples of 206 Chinese individuals: 59 with polyp (group P), 54 with adenoma (group A), 51 with colorectal cancer (group CC), and 42 healthy controls (group HC).16S ribosomal RNA (rRNA) was used to compare the microbiota community structures among healthy controls, patients with polyp, and those with adenoma or colorectal cancer. Our study proved that intestinal flora, as a specific indicator, showed significant differences in its diversity and composition. Sobs, Chao, and Ace indexes of group CC were significantly lower than those of the healthy control group (CC group: Sobs, Chao, and Ace indexes were 217.3 ± 69, 4265.1 ± 80.7, and 268.6 ± 78.1, respectively; HC group: Sobs, Chao, and Ace indexes were 228.8 ± 44.4, 272.9 ± 58.6, and 271.9 ± 57.2, respectively). When compared with the healthy individuals, the species richness and diversity of intestinal flora in patients with colorectal cancer were significantly reduced: PCA and PCoA both revealed that a significant separation in bacterial community composition between the CC group and HC group (with PCA using the first two principal component scores of PC1 14.73% and PC2 10.34% of the explained variance, respectively; PCoA : PC1 = 14%, PC2 = 9%, PC3 = 6%). Wilcox tests was used to analyze differences between the two groups, it reveals that Firmicutes (P=0.000356), Fusobacteria (P=0.000001), Proteobacteria (P=0.000796), Spirochaetes (P=0.013421), Synergistetes (P=0.005642) were phyla with significantly different distributions between cases and controls. The proportion of microorganism composition is varying at different stages of colon cancer development: Bacteroidetes (52.14%) and Firmicutes (35.88%) were enriched in the healthy individuals; on the phylum level, the abundance of Bacteroidetes (52.14%-53.92%-52.46%-47.06%) and Firmicutes (35.88%-29.73%-24.27%-25.36%) is decreasing with the development of health-polyp-adenomas-CRC, and the abundance of Proteobacteria (9.33%-12.31%-16.51%-22.37%) is increasing. PCA and PCOA analysis showed there was no significant (P < 0.05) difference in species similarity between precancerous and carcinogenic states. However, the composition of the microflora in patients with precancerous lesions (including patients with adenoma and polyp) was proved to have no significant disparity (P < 0.05). Our study provides insights into new angles to dig out potential biomarkers in diagnosis and treatment of colorectal cancer and to provide scientific advice for a healthy lifestyle for the sake of gut microbiota.
Copyright © 2020 Wanxin Liu et al.
Conflict of interest statement
The authors declare that they have no conflicts of interest.
Figures

Similar articles
-
Gut microbiota alterations in colorectal adenoma-carcinoma sequence based on 16S rRNA gene sequencing: A systematic review and meta-analysis.Microb Pathog. 2024 Oct;195:106889. doi: 10.1016/j.micpath.2024.106889. Epub 2024 Aug 26. Microb Pathog. 2024. PMID: 39197689
-
Characterizing the composition of intestinal microflora by 16S rRNA gene sequencing.World J Gastroenterol. 2020 Feb 14;26(6):614-626. doi: 10.3748/wjg.v26.i6.614. World J Gastroenterol. 2020. PMID: 32103871 Free PMC article.
-
A comprehensive analysis of the microbiota composition and gene expression in colorectal cancer.BMC Microbiol. 2020 Oct 13;20(1):308. doi: 10.1186/s12866-020-01938-w. BMC Microbiol. 2020. PMID: 33050883 Free PMC article.
-
Changes in gut microbiota and plasma inflammatory factors across the stages of colorectal tumorigenesis: a case-control study.BMC Microbiol. 2018 Aug 29;18(1):92. doi: 10.1186/s12866-018-1232-6. BMC Microbiol. 2018. PMID: 30157754 Free PMC article.
-
Systematic review: Gut microbiota in fecal samples and detection of colorectal neoplasms.Gut Microbes. 2018 Jul 4;9(4):293-307. doi: 10.1080/19490976.2018.1445957. Epub 2018 May 15. Gut Microbes. 2018. PMID: 29543545 Free PMC article.
Cited by
-
Gut microbiota modulation: a tool for the management of colorectal cancer.J Transl Med. 2022 Apr 21;20(1):178. doi: 10.1186/s12967-022-03378-8. J Transl Med. 2022. PMID: 35449107 Free PMC article. Review.
-
Associations between the Gut Microbiota, Race, and Ethnicity of Patients with Colorectal Cancer: A Pilot and Feasibility Study.Cancers (Basel). 2023 Sep 13;15(18):4546. doi: 10.3390/cancers15184546. Cancers (Basel). 2023. PMID: 37760515 Free PMC article.
-
Features of combined gut bacteria and fungi from a Chinese cohort of colorectal cancer, colorectal adenoma, and post-operative patients.Front Microbiol. 2023 Aug 8;14:1236583. doi: 10.3389/fmicb.2023.1236583. eCollection 2023. Front Microbiol. 2023. PMID: 37614602 Free PMC article.
-
The negative effect of Akkermansia muciniphila-mediated post-antibiotic reconstitution of the gut microbiota on the development of colitis-associated colorectal cancer in mice.Front Microbiol. 2022 Oct 14;13:932047. doi: 10.3389/fmicb.2022.932047. eCollection 2022. Front Microbiol. 2022. PMID: 36312913 Free PMC article.
-
Gut Microbiome and colorectal cancer: discovery of bacterial changes with metagenomics application in Turkısh population.Genes Genomics. 2024 Sep;46(9):1059-1070. doi: 10.1007/s13258-024-01538-2. Epub 2024 Jul 11. Genes Genomics. 2024. PMID: 38990271
References
MeSH terms
Substances
LinkOut - more resources
Full Text Sources
Medical
Research Materials
Miscellaneous
