. 2019 Dec 30;4(2):e10256.
doi: 10.1002/jbm4.10256. eCollection 2020 Feb.

Prostate Cancer Phenotype Influences Bone Mineralization at Metastasis: A Study Using an In Vitro Prostate Cancer Metastasis Testbed

Affiliations

Prostate Cancer Phenotype Influences Bone Mineralization at Metastasis: A Study Using an In Vitro Prostate Cancer Metastasis Testbed

Md Shahjahan Molla et al. JBMR Plus. .

Abstract

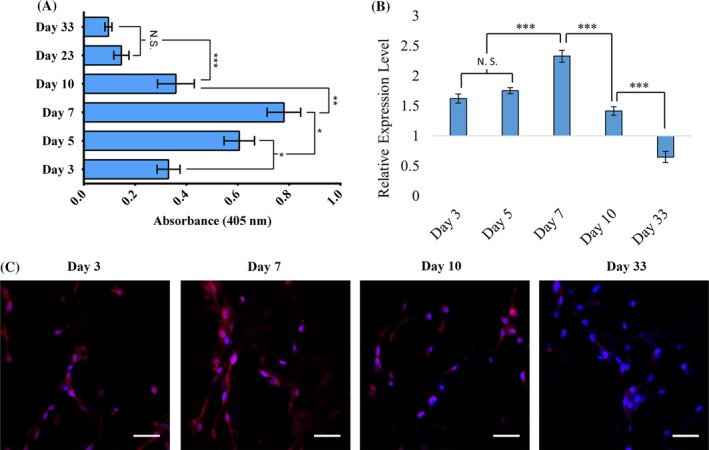
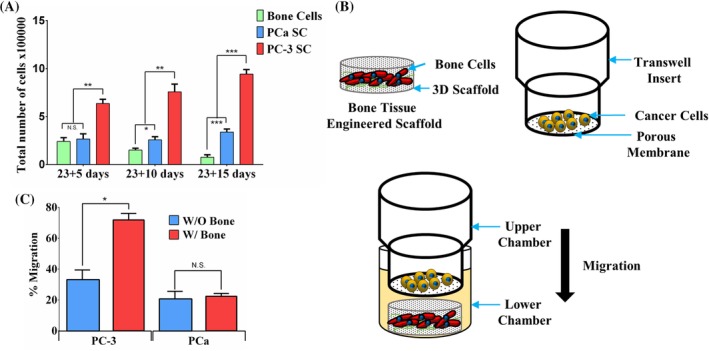
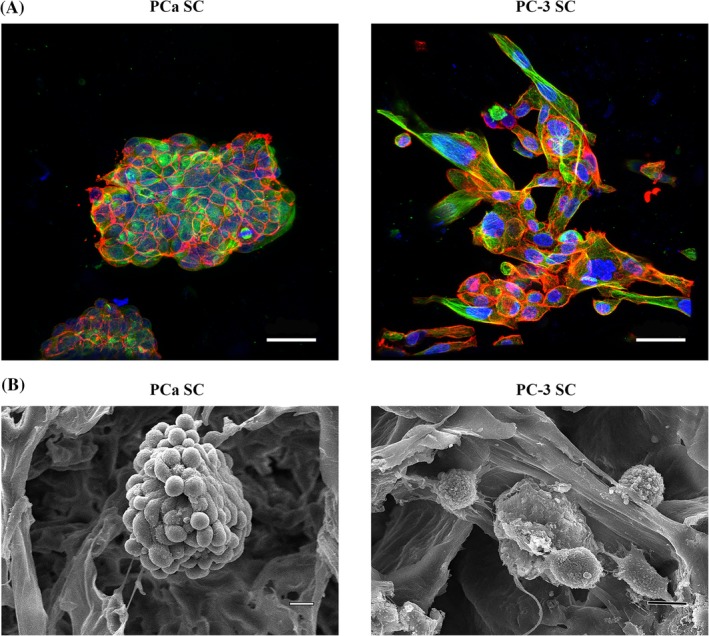
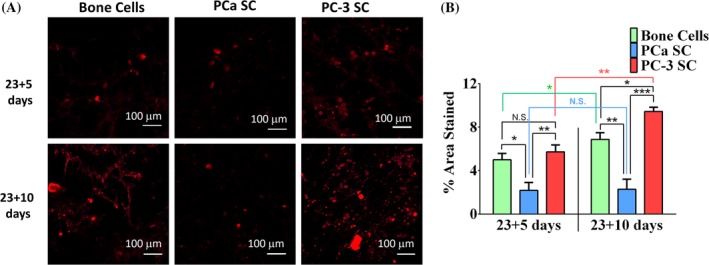
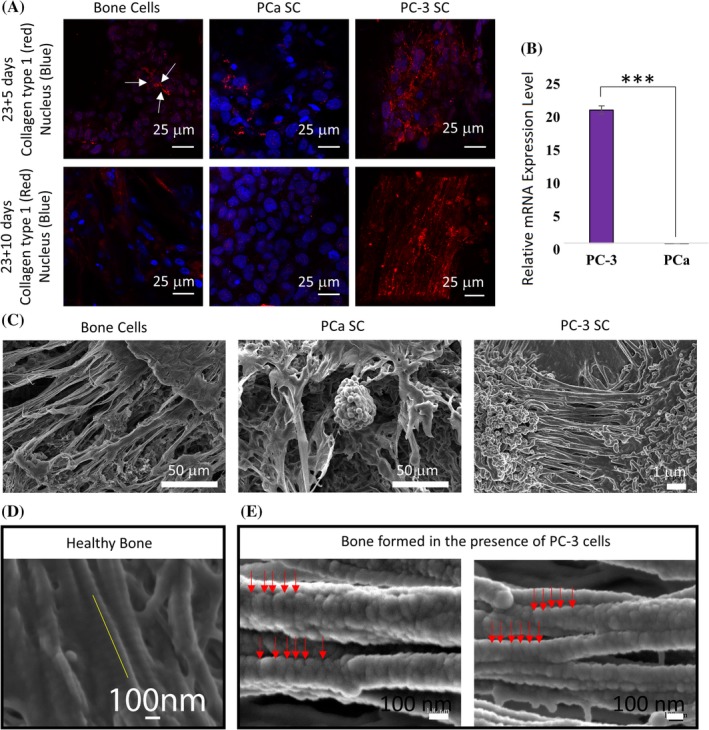
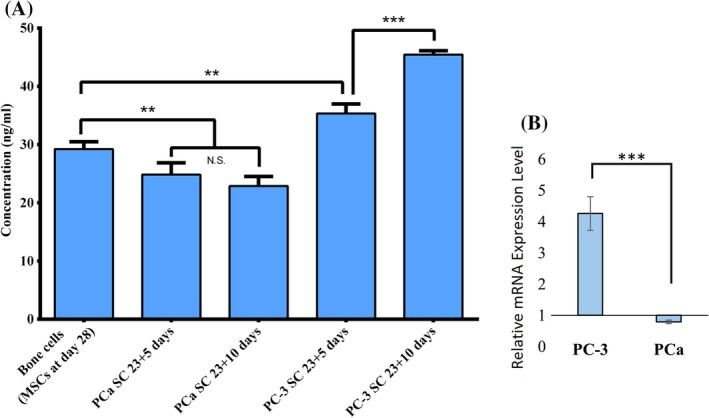
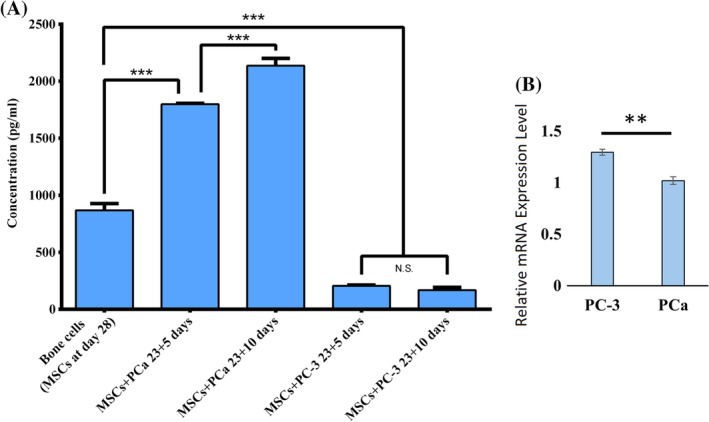
In this study, two types of prostate cancer cell lines, highly metastatic PC-3 and low metastatic MDA PCa 2b (PCa) were cultured on bone mimetic scaffolds to recapitulate metastasis to bone. A unique in vitro 3D tumor model that uses a sequential culture (SC) of human mesenchymal stem cells followed by seeding with cancer cells after bone formation was initiated to study the phenotype-specific interaction between prostate cancer cells and bone microenvironment. The PCa cells were observed to be less prolific and less metastatic, and to form multicellular tumoroids in the bone microenvironment, whereas PC-3 cells were more prolific and were highly metastatic, and did not form multicellular tumoroids in the bone microenvironment. The metastatic process exhibited by these two prostate cancer cell lines showed a significant and different effect on bone mineralization and extracellular matrix formation. Excessive bone formation in the presence of PC-3 and significant osteolysis in the presence of PCa were observed, which was also indicated by osteocalcin and MMP-9 expression as measured by ELISA and qRT-PCR. The field emission scanning electron microscopy images revealed that the structure of mineralized collagen in the presence of PC-3 is different than the one observed in healthy bone. All experimental results indicated that both osteolytic and osteoblastic bone lesions can be recapitulated in our tumor testbed model and that different cancer phenotypes have a very different influence on bone at metastasis. The 3D in vitro model presented in this study provides an improved, reproducible, and controllable system that is a useful tool to elucidate osteotropism of prostate cancer cells. © 2019 The Authors. JBMR Plus published by Wiley Periodicals, Inc. on behalf of American Society for Bone and Mineral Research.

Keywords: BONE CELLS; BONE MATRIXMATRIX MINERALIZATION; BONE MATRIXTUMOR‐INDUCED BONE DISEASE; CANCER; OSTEOBLASTS; PROSTATE CANCER; COLLAGEN.


Figures

Figure 1
Figure 1
Osteogenic differentiation of mesenchymal stem cells (MSCs). (A) Comparative results from alkaline phosphatase assay for sequential culture (SC) and MSCs. Results are shown as mean ± SD. Statistical significance is shown by *p < 0.05; n = 3. (B) Relative gene expression level of RUNX2, which is normalized to GAPDH and where undifferentiated cultured on 2D MSCs at day 2 served as control. (C) Immunocytochemical analysis of Runx2 (red) and nuclei (blue) stained in MSCs cultured in 3D scaffolds.
Figure 2
Figure 2
Growth and migration of prostate cancer cells. (A) Comparative results from WST‐1 cell viability assay for bone cells (differentiated from mesenchymal stem cells [MSCs]), PCa SC (sequential culture of MDA PCa 2b cells with MSCs), and PC‐3 SC (sequential culture of PC‐3 cells with MSCs). Results are shown as mean ± SD. Statistical significance is shown by ***p < 0.001, **p < 0.005, *p < 0.05; n = 3. (B) Schematic representation of migration assay setup. The cells were allowed to migrate towards the lower chamber (control) or bone tissue‐engineered construct (MSCs cultured in polycaprolactone/in situ hydroxyapatite‐nanoclay scaffolds for 23 days) in the lower chamber. (C) Percentage migration of PC‐3 cells with or without bone‐mimicking scaffolds. Results are shown as mean ± SD. Statistical significance is shown by *p < 0.05; n = 3.
Figure 3
Figure 3
Morphological analysis of PCa SC and PC‐3 SC. (A) Immunostained α‐tubulin (green), F‐actin (red), and nuclei (blue) in PCa SC and PC‐3 SC. Bar = 50 μm. (B) SEM micrographs of PCa SC and PC‐3 SC showing tumoroid and cluster of cells, respectively, formed in the polycaprolactone/in situ hydroxyapatite‐nanoclay scaffolds. Bar = 10 μm.
Figure 4
Figure 4
Effect on mineralization. (A) Alizarin Red S‐stained bone cells (differentiated from mesenchymal stem cells [MSCs]), PCa SC (sequential culture of MDA PCa 2b cells with MSCs), and PC‐3 SC (sequential culture of PC‐3 cells with MSCs) samples. Bar = 100 μm. (B) Calculated percentage of area stained in Alizarin Red S assay. Results are shown as mean ± SD. Statistical significance is shown by ***p < 0.001, **p < 0.005, *p < 0.05, n = 3.
Figure 5
Figure 5
Effect on mineralized collagen formation. (A) Immunostained type I collagen (red), and nuclei (blue) in the bone cell (differentiated from mesenchymal stem cells [MSCs]), PCa SC (sequential culture of MDA PCa 2b cells with MSCs), and PC‐3 SC (sequential culture of PC‐3 cells with MSCs) samples. (B) Relative type I collagen gene expression level at day 23 + 10 in PC‐3 SC and PCa SC, where bone cells (differentiated from MSCs) served as control (relative expression = 1). Results are shown as mean ± SD. Statistical significance is shown by ***p < 0.001, n = 3. (C) SEM images of extracellular spaces of bone cell, PCa SC, and PC‐3 SC samples. (D) The 67‐nm banding pattern in the collagen fibril structure observed in healthy bone (adopted from Gu and colleagues with permission34). (E) Field emission scanning electron micrographs of mineralized type I collagen fibrils formed in PC‐3 SC.
Figure 6
Figure 6
Osteocalcin (OCN) expression. (A) OCN protein secretion in bone cell, PC‐3 SC, and PCa SC samples measured by ELISA. Results are shown as mean ± SD. Statistical significance is shown by ***p < 0.001, **p < 0.005, *p < 0.05, n = 3. (B) Relative OCN gene expression level at day 23 + 10 in the PC‐3 SC and PCa SC samples, where bone cells (differentiated from mesenchymal stem cells) served as control (relative expression = 1). Results are shown as mean ± SD. Statistical significance is shown by ***p < 0.001, n = 3.
Figure 7
Figure 7
MMP‐9 expression. (A) MMP‐9 protein secretion in bone cell, PC‐3 SC, and PCa SC samples measured by ELISA. Results are shown as mean ± SD. Statistical significance is shown by ***p < 0.001, **p < 0.005, *p < 0.05, n = 3. (B) Relative MMP‐9 gene expression level at day 23 + 10 in PC‐3 SC and PCa SC, where bone cells (differentiated from mesenchymal stem cells) served as control (relative expression = 1). Results are shown as mean ± SD. Statistical significance is shown by **p < 0.005, n = 3.

References

    1. Bubendorf L, Schopfer A, Wagner U, et al. Metastatic patterns of prostate cancer: An autopsy study of 1,589 patients. Hum Pathol. 2000;31(5):578–83. - PubMed
    1. Melton LJ III, Lieber MM, Atkinson EJ, et al. Fracture risk in men with prostate cancer: a population‐based study. J Bone Miner Res. 2011;26(8):1808–15. - PMC - PubMed
    1. Howlader N, Noone AM, Krapcho M, et al. SEER Cancer Statistics Review, 1975–2014. Bethesda, MD: National Cancer Institute; 2017.
    1. Wang N, Docherty FE, Brown HK, et al. Prostate cancer cells preferentially home to osteoblast‐rich areas in the early stages of bone metastasis: evidence from in vivo models. J Bone Miner Res. 2014;29(12):2688–96. - PubMed
    1. Batson OV. The function of the vertebral veins and their role in the spread of metastases. Ann Surg. 1940;112(1):138. - PMC - PubMed

LinkOut - more resources