. 2020 May 7;48(8):4463-4479.
doi: 10.1093/nar/gkaa115.

Deletion of Endonuclease V suppresses chemically induced hepatocellular carcinoma

Affiliations

Deletion of Endonuclease V suppresses chemically induced hepatocellular carcinoma

Xiang Yi Kong et al. Nucleic Acids Res. .

Abstract

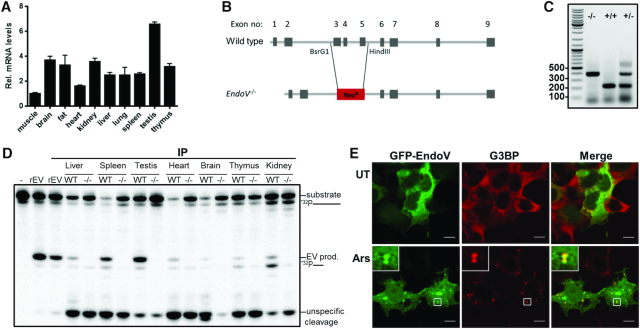
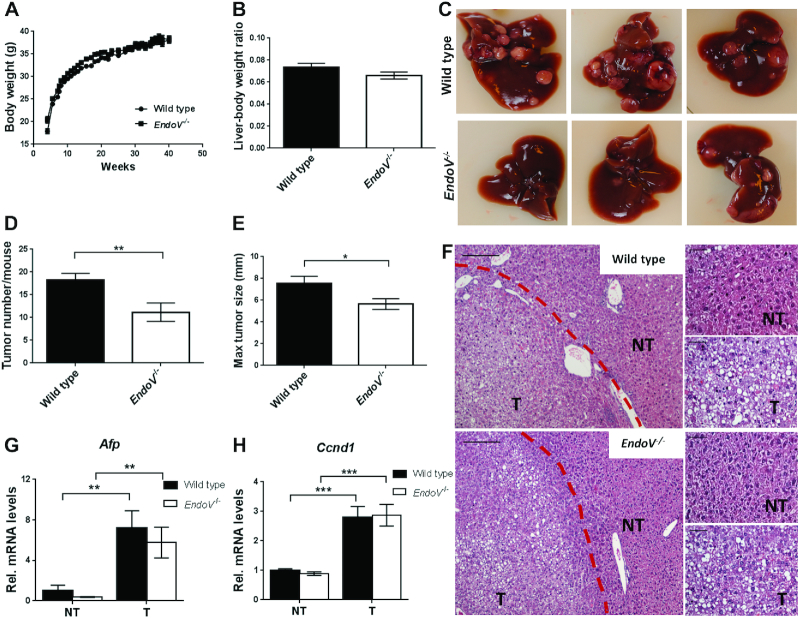
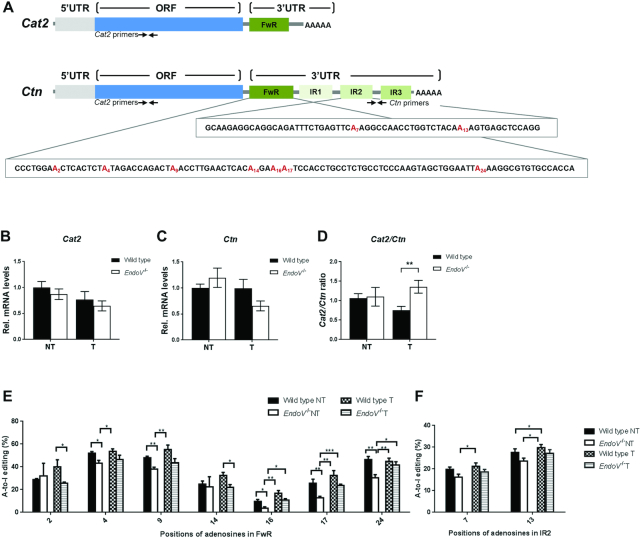
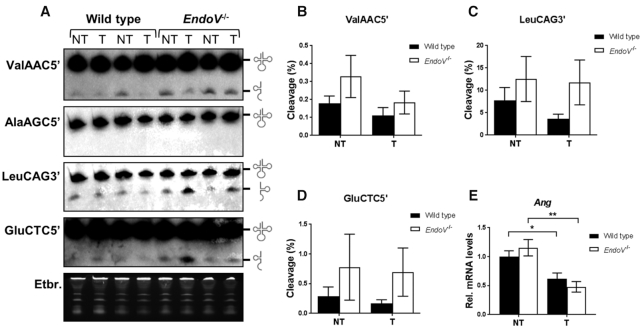
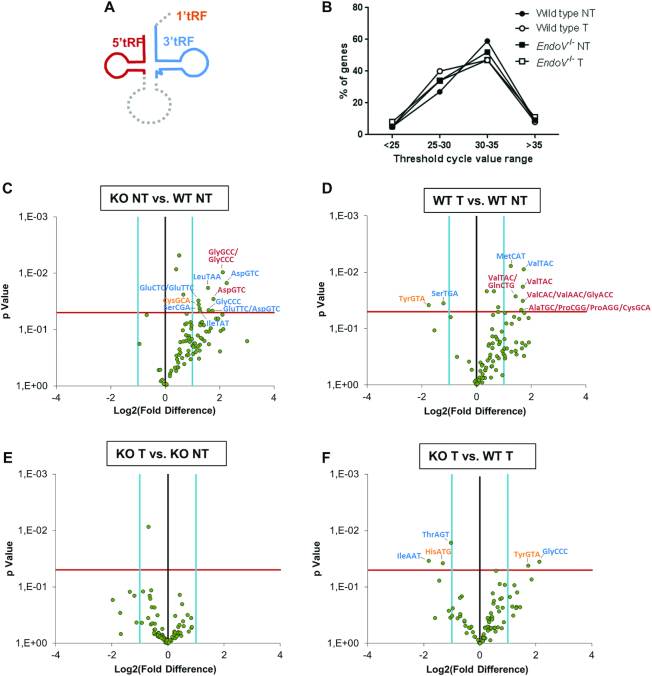
Endonuclease V (EndoV) is a conserved inosine-specific ribonuclease with unknown biological function. Here, we present the first mouse model lacking EndoV, which is viable without visible abnormalities. We show that endogenous murine EndoV cleaves inosine-containing RNA in vitro, nevertheless a series of experiments fails to link an in vivo function to processing of such transcripts. As inosine levels and adenosine-to-inosine editing often are dysregulated in hepatocellular carcinoma (HCC), we chemically induced HCC in mice. All mice developed liver cancer, however, EndoV-/- tumors were significantly fewer and smaller than wild type tumors. Opposed to human HCC, adenosine deaminase mRNA expression and site-specific editing were unaltered in our model. Loss of EndoV did not affect editing levels in liver tumors, however mRNA expression of a selection of cancer related genes were reduced. Inosines are also found in certain tRNAs and tRNAs are cleaved during stress to produce signaling entities. tRNA fragmentation was dysregulated in EndoV-/- livers and apparently, inosine-independent. We speculate that the inosine-ribonuclease activity of EndoV is disabled in vivo, but RNA binding allowed to promote stabilization of transcripts or recruitment of proteins to fine-tune gene expression. The EndoV-/- tumor suppressive phenotype calls for related studies in human HCC.


Figures

Figure 1.
Figure 1.
Endogenous and ectopic expression of mouse EndoV. (A) Expression of EndoV mRNA in various mouse tissues as quantified by RT-qPCR. The values are relative to muscle tissue which was set to 1. (B) Schematic presentation of wild type and EndoV−/− genomic loci. (C) Genotyping of EndoV mutant (−/−), wild type (+/+), and heterozygote (+/−) alleles (expected size are 400 bp for EndoV−/− and 216 for wild type). (D) Immunoprecipitated proteins from wild type (WT) and EndoV−/− (−/−) tissues were subjected to EndoV activity assay using a 32P-labeled single stranded inosine-containing RNA substrate. Cleaved fragments (EV products) were separated from intact substrate by polyacrylamide gel electrophoresis. Glyphs to the right of the gel picture indicate the full-length and cleaved RNA substrates. Recombinant human EndoV (rEV) was used as a positive control in the IP and activity assays. (E) HEK 293T cells transiently transfected with a plasmid expressing mouse EndoV fused to GFP were left untreated (UT) or exposed to arsenite (Ars; 0.5 mM, 30 min), fixed and processed for confocal microscopy. Cells were stained with G3BP (red) antibody to visualize stress granules. GFP-EndoV is shown in green. Localization of proteins was observed by confocal microscopy (Zeiss) using 63× oil objective. Scale bar, 10 μm.
Figure 2.
Figure 2.
Inosines in mouse RNAs. (A) Nucleic acids were isolated from liver, spleen or kidney from wild type and EndoV−/− mice (n = 5–8) and subjected to mass spectrometry for direct quantification of inosines. x = 104 for RNA, x = 106 for DNA, nt = nucleotides, tot = total. (B) Site-specific A-to-I editing in Cog3(I635V), Copa(I164V) and Flnb(Q2272R) liver mRNA from wild type and EndoV−/− mice (n = 3) was analyzed after reversed transcription of liver RNA, PCR amplification and direct DNA sequencing of the PCR products. A-to-G mutations were identified and the editing level determined by the relative peak height of G related to A+G at the specific position (in %). (C) Defined regions of the 3′UTRs of the Rpa1 and Tapbp mRNAs were analyzed for A-to-I hyper editing by DNA sequencing of individual clones (n = 24) obtained after reverse transcription, PCR amplification and subcloning starting with liver RNA. A-to-G mutations were identified as in (B). The average frequency of all A to G mutations per transcript (clone) is shown (in %). Graphs are shown as means ± SEM for A and B, and as means ± SD for C.
Figure 3.
Figure 3.
DEN-induced hepatocarcinogenesis is suppressed by the loss of EndoV. Two-weeks-old EndoV−/− and wild type mice were given a single dose of DEN and followed for 40 weeks. (A) Body weight was determined every week and (B) liver weight relative to body weight was determined at termination. (C) Representative pictures of liver tumors in DEN-treated mice. (D) Liver tumor numbers (>1 mm) per mouse and (E) maximal tumor size (diameter in mm) were determined in each DEN-treated mice group. Graphs are shown as means ± SEM (n = 28–30). (F) Representative images of hematoxylin and eosin (H&E) stained liver sections from DEN-treated wild type and EndoV−/− mice showing both tumor (T) and non-tumor (NT) tissue (42 weeks old). Red dotted line depicts the transition between tumor and non-tumor area. Magnification and scale bar: 10× objective/200 μm (left panel) and 40× objective/50 μm (right panels). (G–H) Level of Afp and Ccnd1 mRNA in non-tumor and tumor tissue in wild type and EndoV−/− mice as analyzed by RT-qPCR. The values are related to the average of wild type NT samples which was set as 1. Graphs are shown as means ± SEM (n = 10). *P < 0.05, **P < 0.01, ***P < 0.001 by Student's t-test.
Figure 4.
Figure 4.
mRNA expression in HCC livers Levels of (A) Ccl2, (B) Ccr2, (C) Gdf15, (D) Jkamp, (E) Mapk9, (F) Vegfc, (G) Total Xbp1 and (H) spliced Xbp1 (Xbp1s) mRNA in non-tumor (NT) and tumor (T) liver tissue in wild type and EndoV−/− mice as analyzed by RT-qPCR. The values are related to the average of wild type NT samples which was set as 1. Graphs are shown as means ± SEM (n = 10). *P < 0.05; **P < 0.01 by Student's t-test.
Figure 5.
Figure 5.
Quantification and editing of Cat2 and Ctn transcripts. (A) Schematic presentation of the mouse Cat2 and Ctn2 transcripts including open reading frames and 5′- and 3′ untranslated regions. Positions of the RT-qPCR primers for Cat2 and Ctn are shown as well as the DNA sequences of the FwR and IR2 repeats analyzed for A-to-I editing. Edited adenosines are colored in red and numbered. The drawing is not at scale. (B) Normalized levels of total Cat2+Ctn and (C) Ctn mRNAs as analyzed by RT-qPCR of liver RNA from the DEN-treated mice. (D) Levels of total Cat2 from RT-qPCR was directly related to Ctn mRNA. The values in RT-qPCR are related to the average of wild type non-tumor (NT) samples which was set as 1. Graphs are shown as means ± SEM (n = 10). DNA sequencing of PCR products amplified from Cat2/Ctn cDNA identified A-to-I editing in the (E) FwdR and (F) IR2 regions (n = 5). The peak heights of G related to A+G defined percentage of editing. *P < 0.05; **P < 0.01; ***P < 0.001 by Student's t-test.
Figure 6.
Figure 6.
tRNA halfs as analyzed by northern blot. (A) Representative images of northern blot analyses of total RNA from wild type (WT) and EndoV−/− mice, non-tumor (NT) and tumor tissue (T) using probes for ValAAC5′, AlaAGC5′, LeuCAG3′ and GluCTC5′. Equal loading is shown by ethidium bromide staining of the gel (lower panel). Glyphs to the right of the gel pictures indicate full-length and fragment tRNA species. Quantification of tRNA fragmentation is shown for (B) ValAAC5′, (C) LeuCAG3′and (D) GluCTC5′. Graphs are shown as means ± SEM (n = 6–8). (E) Levels of Ang mRNA as analyzed by RT-qPCR. The values are related to the average of wild type non-tumor (NT) samples which was set as 1. Graphs are shown as means ± SEM (n = 8–10). *P < 0.05; **P < 0.01 by Student's t-test.
Figure 7.
Figure 7.
Quantification of tRNA fragments in EndoV−/− liver RNA. (A) Shematic presentation of the different tRFs detected in the array. (B) Distribution of tRFs by abundance as determined by RT-qPCR in the various liver samples. Change in the amount of cellular tRFs presented by Volcano plot after comparison of (C) wild type non-tumor versus EndoV−/− non-tumor, (D) wild type tumor versus wild type non-tumor, (E) tumor versus non-tumor in EndoV−/−mice and (F) wild type tumor versus EndoV−/− tumor. Significant differently regulated tRFs were identified and labeled (1′tRFs = orange, 3′tRFs = blue and 5′tRFs = red), n = 3. The black vertical line indicates a fold-change value of 1. The light blue vertical lines indicate the threshold of fold-change, defined as 2. The red horizontal line indicates the P-value cutoff, defined as 0.05 (by Student's t-test).
Figure 8.
Figure 8.
Role of EndoV in apoptosis. (A) Response to sorafenib treatment in human Flp-In T-REx 293 cells overexpressing human Flag-EndoV (hEV; white bar) or human Flag-EndoV D52A (D52A; grey bar). Flp-In T-REx 293 cells are included as a control (Ctr; black bar). Apoptosis was assessed by fluorescently measuring the CASP3/7 activity for 24 h after sorafenib addition (4 μM). CASP3/7 positive cells were normalized to the total number of cells per well and related to the average of untreated sample for each cell line. Graphs are shown as means ± SEM (n = 4). (B) Western blot of Flp-In T-REx cells (Ctr) overexpressing either human Flag-EndoV (hEV) or Flag-EndoV D52A (D52A) probed with a hEndoV antibody (upper panel). Molecular weight marker (M) with sizes (in kDa) is shown to the left. Probing with α-Tubulin (α-Tub) was used as a loading control (lower panel).

References

    1. Gray M.W. Evolutionary origin of RNA editing. Biochemistry. 2012; 51:5235–5242. - PubMed
    1. Nishikura K. A-to-I editing of coding and non-coding RNAs by ADARs. Nat. Rev. Mol. Cell Bio. 2016; 17:83–96. - PMC - PubMed
    1. Bass B.L., Nishikura K., Keller W., Seeburg P.H., Emeson R.B., O’Connell M.A., Samuel C.E., Herbert A.. A standardized nomenclature for adenosine deaminases that act on RNA. RNA. 1997; 3:947–949. - PMC - PubMed
    1. Alseth I., Dalhus B., Bjoras M.. Inosine in DNA and RNA. Curr. Opin. Genet. Dev. 2014; 26:116–123. - PubMed
    1. Maas S., Rich A.. Changing genetic information through RNA editing. BioEssays: News Rev. Mol. Cell Dev. Biol. 2000; 22:790–802. - PubMed

Publication types

MeSH terms