

Trends in Alcohol-Induced Deaths in the United States, 2000-2016
- PMID: 32083687
- PMCID: PMC7043198
- DOI: 10.1001/jamanetworkopen.2019.21451
Trends in Alcohol-Induced Deaths in the United States, 2000-2016
Abstract
Importance: Notable increases in mortality from alcohol-induced causes over the past 2 decades in the United States have been reported. However, comprehensive assessments of trends in alcohol-induced mortality by sex, age, race/ethnicity, and social and geographic factors are lacking.
Objective: To examine trends in alcohol-induced mortality rates from 2000 to 2016, comparing results by demographic characteristics including sex, race/ethnicity, age, county-level socioeconomic status, and geographic location.
Design, setting, and participants: This serial cross-sectional study used US national vital statistics data for years 2000 to 2016 for all US residents older than 15 years. Data analysis was conducted from January to September 2019.
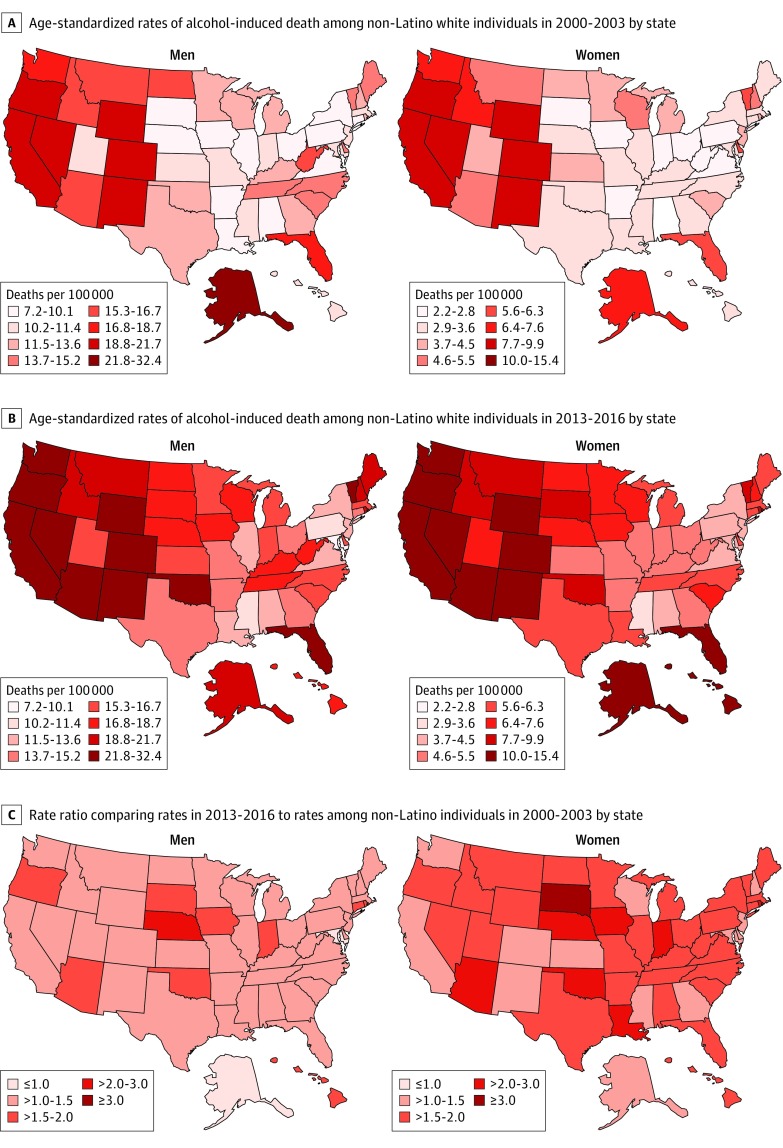
Exposures: Trends in alcohol-induced mortality by sex, race/ethnicity, age, county-level socioeconomic status (ie, median income, percentage of unemployed residents, percentage of residents with a bachelor's degree), rurality level, and US state.
Main outcomes and measures: Alcohol-induced mortality, ie, deaths for which alcohol holds a population-attributable fraction of 1. Deaths were expressed per 100 000 residents as absolute and age-standardized rates. Mortality trends were measured as average annual percentage changes (AAPCs) for the entire period (ie, 2000-2016) and annual percentage changes (APCs) for individual periods of change within the study period.
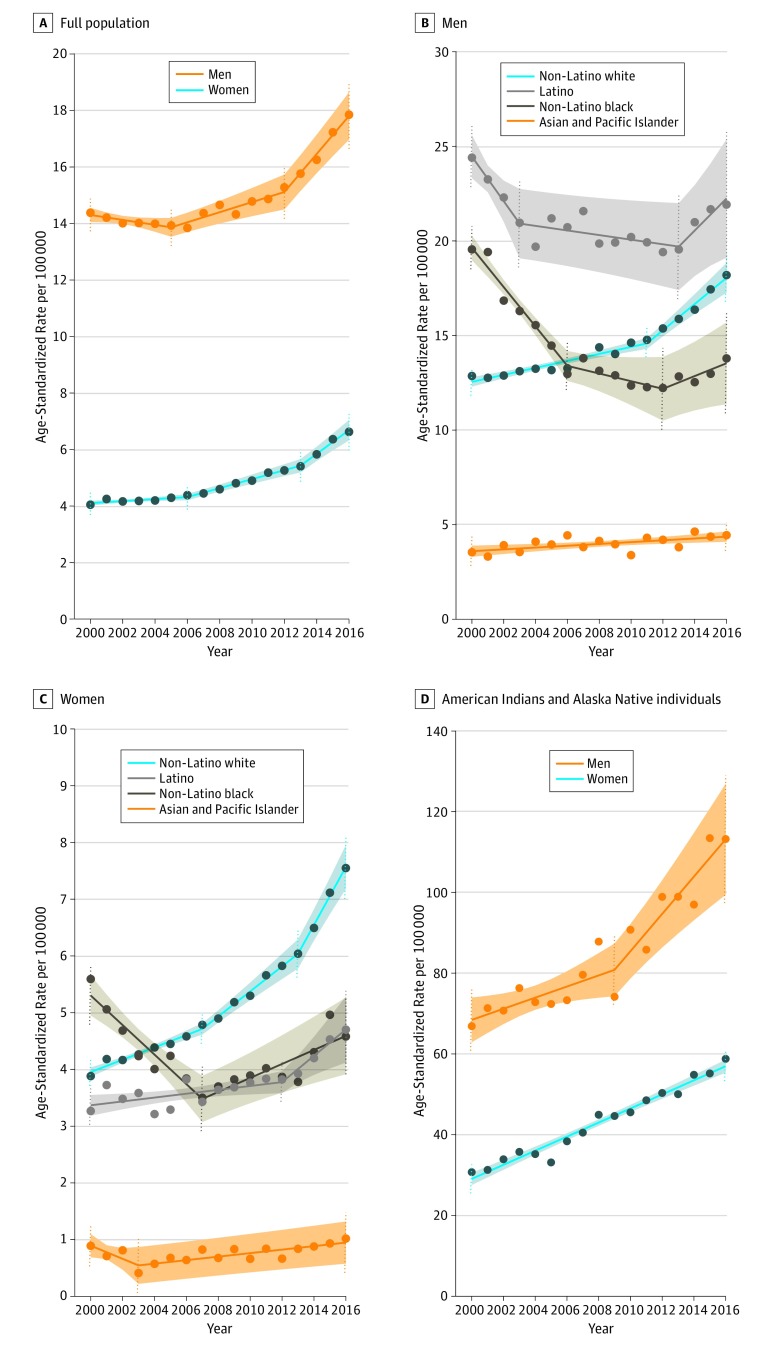
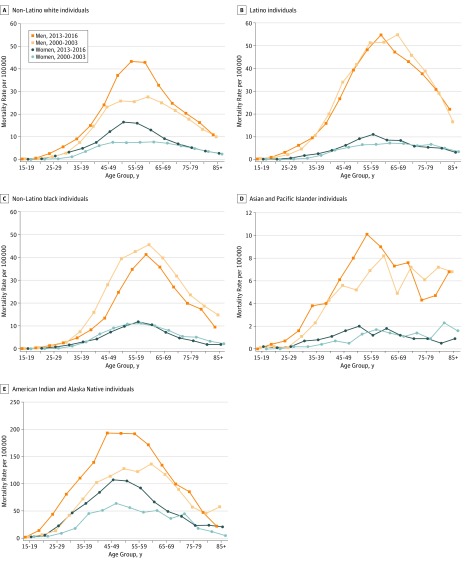
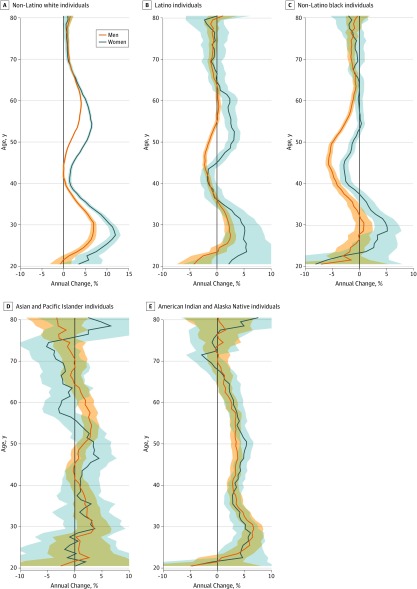
Results: A total of 425 045 alcohol-induced deaths were identified from 2000 to 2016 (2000: 19 627 deaths; 14 979 [76.3%] men; 2016: 34 857 deaths; 25 213 [73.3%] men). The rate of alcohol-induced deaths increased substantially among men (AAPC, 1.4%; 95% CI, 1.0% to 1.8%) and women (AAPC, 3.1%; 95% CI, 2.6% to 3.6%) and accelerated recently (men, 2012-2016: APC, 4.2%; 95% CI, 3.1% to 5.3%; women, 2013-2016: APC, 7.1%; 95% CI, 5.1% to 9.1%). The largest increases by race/ethnicity were observed among American Indian and Alaska Native men (AAPC, 3.3%; 95% CI, 2.6% to 4.0%), American Indian and Alaska Native women (AAPC, 4.2%; 95% CI, 3.8% to 4.6%), and white women (AAPC, 4.1%; 95% CI, 3.6% to 4.7%). Despite initial declines among black women, black men, and Latino men (eg, Latino men, 2000-2003: APC, -5.1%; 95% CI, -9.8% to -0.1%; 2003-2013: APC, -0.6%; 95% CI, -1.4% to 0.2%), increases occurred later in the study period (eg, Latino men, 2013-2016: APC, 4.1%; 95% CI, 0.3% to 8.1%). The rates of increase varied by age group and in turn by racial/ethnic group. Among white individuals, large absolute increases occurred in midlife (eg, men aged 55-59 years, 2000-2003: 25.5 deaths per 100 000 residents; 2013-2016: 43.3 deaths per 100 000 residents; women aged 50-54 years, 2000-2003: 7.4 deaths per 100 000 residents; 2013-2016: 16.5 deaths per 100 000 residents), although APCs were also large for ages 25 to 34 years, ranging from 4.6% to 6.9% per year among men and from 7.3% to 12.0% among women. Among American Indian and Alaska Native individuals, increases throughout the age range were observed, with the largest absolute increase occurring for ages 45 to 49 years among men (2000-2013: 113.6 deaths per 100 000 residents; 2013-2016: 193.1 deaths per 100 000 residents) and for ages 50 to 54 among women (2000-2013: from 56.1 deaths per 100 000 residents; 2013-2016: 105.1 deaths per 100 000 residents).
Conclusions and relevance: This study found large increases in alcohol-induced death rates across age and racial/ethnic subgroups of the US population, which have accelerated over recent years. Large increases in alcohol-induced deaths among younger age groups may be associated with future increases in alcohol-related disease.
Conflict of interest statement
Figures
Comment in
-
Alcohol-Induced Deaths Among American Indian and Alaska Native Individuals-"Drinking Was What I and Others Just Did".JAMA Netw Open. 2020 Feb 5;3(2):e1921391. doi: 10.1001/jamanetworkopen.2019.21391. JAMA Netw Open. 2020. PMID: 32083681 Free PMC article. No abstract available.
-
Social Determinants and Differences in Mortality by Race/Ethnicity.JAMA Netw Open. 2020 Feb 5;3(2):e1921392. doi: 10.1001/jamanetworkopen.2019.21392. JAMA Netw Open. 2020. PMID: 32083682 Free PMC article. No abstract available.
-
Trends in Alcohol-Induced Deaths in the United States by Sex, Age, and Ethnicity Suggest a Need for Targeted Health Interventions.Hepatology. 2021 Feb;73(2):856-857. doi: 10.1002/hep.31562. Hepatology. 2021. PMID: 32961602 No abstract available.
References
-
- Monnat S. Drugs, alcohol, and suicide represent growing share of U.S. mortality. The Carsey School of Public Policy at the Scholars’ Repository https://scholars.unh.edu/carsey/292. Accessed January 14, 2020.
Publication types
MeSH terms
LinkOut - more resources
Full Text Sources
Medical
Miscellaneous
