. 2020 Feb 21;16(2):e1007287.
doi: 10.1371/journal.pcbi.1007287. eCollection 2020 Feb.

DeepHiC: A generative adversarial network for enhancing Hi-C data resolution

Affiliations

DeepHiC: A generative adversarial network for enhancing Hi-C data resolution

Hao Hong et al. PLoS Comput Biol. .

Abstract

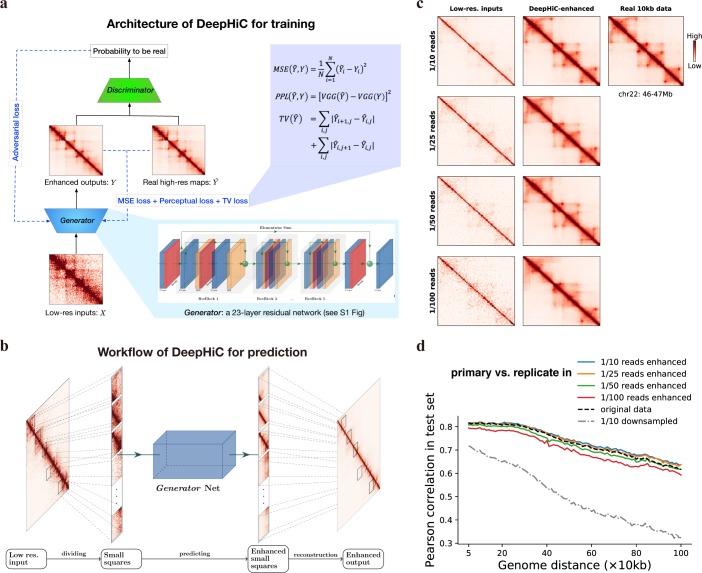
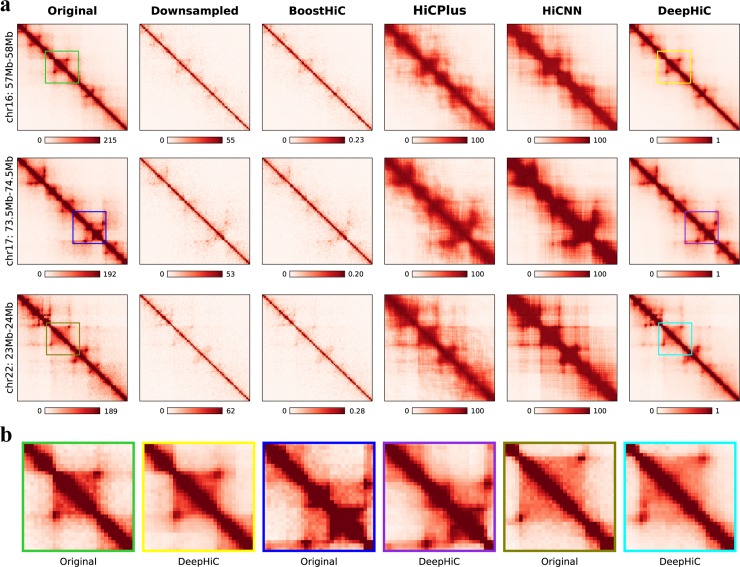
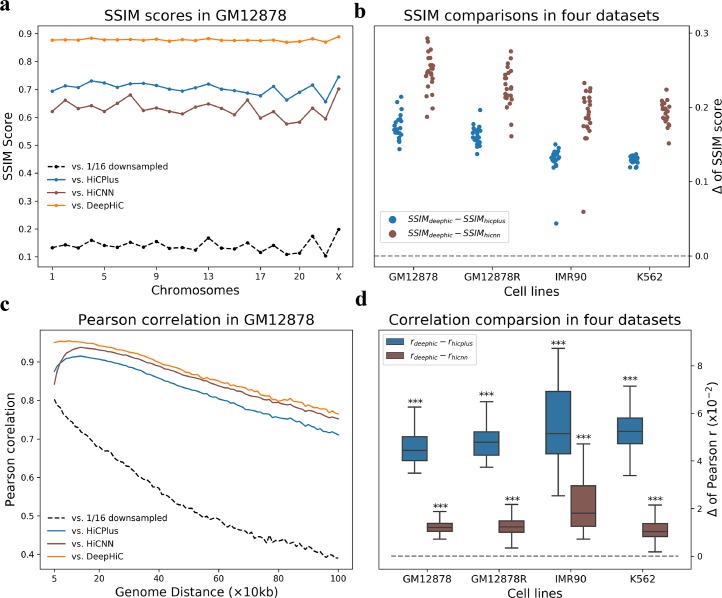
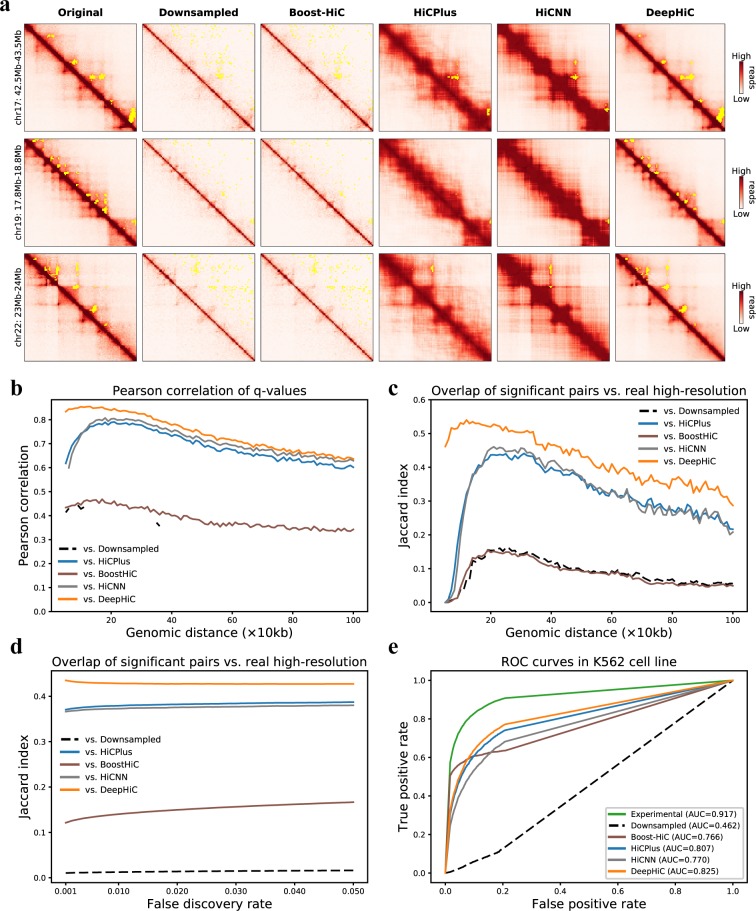
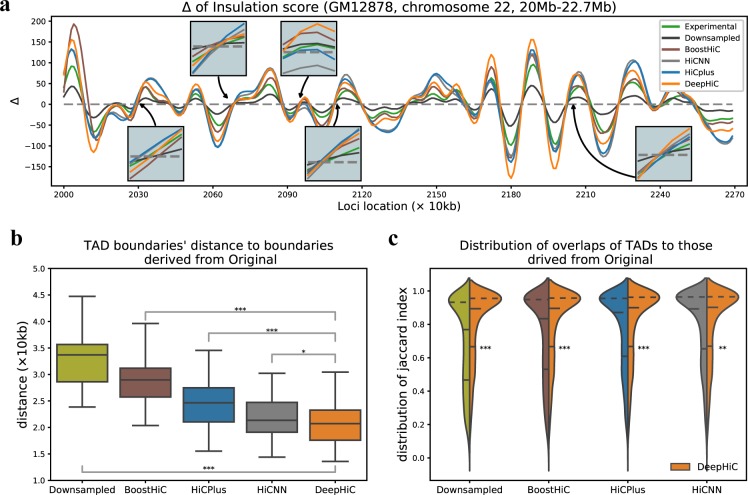
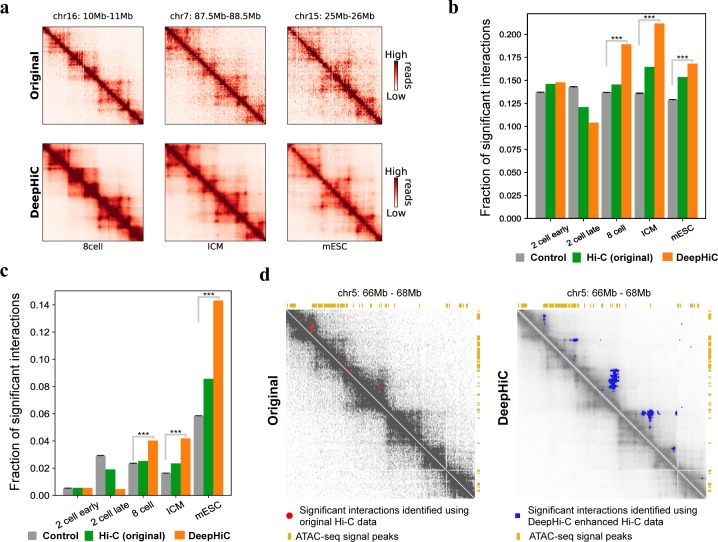
Hi-C is commonly used to study three-dimensional genome organization. However, due to the high sequencing cost and technical constraints, the resolution of most Hi-C datasets is coarse, resulting in a loss of information and biological interpretability. Here we develop DeepHiC, a generative adversarial network, to predict high-resolution Hi-C contact maps from low-coverage sequencing data. We demonstrated that DeepHiC is capable of reproducing high-resolution Hi-C data from as few as 1% downsampled reads. Empowered by adversarial training, our method can restore fine-grained details similar to those in high-resolution Hi-C matrices, boosting accuracy in chromatin loops identification and TADs detection, and outperforms the state-of-the-art methods in accuracy of prediction. Finally, application of DeepHiC to Hi-C data on mouse embryonic development can facilitate chromatin loop detection. We develop a web-based tool (DeepHiC, http://sysomics.com/deephic) that allows researchers to enhance their own Hi-C data with just a few clicks.


Conflict of interest statement

The authors have declared that no competing interests exist.

Figures

Fig 1
Fig 1. Overview of the DeepHiC.
(a) DeepHiC framework: low-resolution inputs are obtained by randomly downsampling original reads. It imputes enhanced contact maps using a 23-layer residual network called Generator. In the training process, the enhanced outputs are approaching real high-resolution matrices by minimizing mean square error (MSE) loss, perceptual loss (PPL), and total variation (TV) loss, meanwhile, a Discriminator network distinguishes enhanced outputs from the real ones and reports the probabilities of enhanced outputs to be real to the Generator through adversarial (AD) loss. The imputation and discrimination steps form the adversarial training process. (b) For prediction, a low-resolution Hi-C matrix is divided into small squares as inputs. Then enhanced small squares are predicted by the Generator. Finally, those squares are merged into a chromosome-wide contact map as the enhanced output. (c, d) We randomly downsampled the original reads (obtained from GEO GSE63525) to 1/10, 1/25, 1/50, and 1/100 reads to simulate low-resolution inputs. DeepHiC is trained on chromosomes 1–14 and tested on chromosomes 15–22 (i.e., test set), in GM12878 cell line. (c) The trained DeepHiC model can be used for enhancing low-coverage sequencing Hi-C data, as an example which shows a 1Mb-width sub-region on chromosome 22 and (d) obtain high correlations between DeepHiC-enhanced matrices and real high-resolution Hi-C at each genomic distance. Colorbar setting: see S1 Note.
Fig 2
Fig 2. DeepHiC enhances the interaction matrix, even in fine-grained textures, with low-sequence depth.
(a) Shown in the figures are real (first column), 1/16 downsampled (second column), Boost-HiC/HiCPlus/HiCNN-enhanced (third-fifth columns) and DeepHiC-enhanced (sixth column) interaction matrices in three different 1-Mb-width sub-regions from the GM12878 cell line at 10-kb resolution. (b) Enlarged heatmaps of smaller sub-regions (0.3Mb×0.3Mb, extracted from the matching coloured frames in (a) obtained from real high-resolution and DeepHiC-enhanced matrices.
Fig 3
Fig 3. Genome-wide comparative analyses of similarity and correlation in various cell types.
(a) High SSIM scores between DeepHiC-enhanced and real high-resolution matrices for all chromosomes in the GM12878 dataset. (b) In extending this analysis to other cell lines, we calculated the differences SSIM scores derived from DeepHiC and baseline models. Circle dots represent the Δ values on each chromosome. Dotted line represents the location of zero value. (c) Comparison of Pearson correlation coefficients between non-experimental data and real Hi-C data at each genomic distance of interest from 50kb to 1Mb. DeepHiC outperforms other methods at all genomic distances examined. (d) We calculated all differences (Δ) between correlations derived from DeepHiC and those derived from HiCPlus/HiCNN at each distance in four datasets. The results obtained are depicted with boxplots. All Δ values are significantly greater than zero (dotted line) (paired t-test, pair number = 96). The whiskers are 5 and 95 percentiles. ***: p-value < 1x10-20.
Fig 4
Fig 4. Analyses of significant chromatin interactions identified by Fit-Hi-C software.
(a) Three representative sub-regions (1 Mb × 1 Mb) from chromosomes 17 and 22 (GM12878 cell line), with significant loci-pairs (cut-off is the 0.5 percentile of q-values) being marked with yellow points in the upper triangle of the heatmaps. (b) All q-values were treated as significance matrices. The Pearson correlations of q-values for non-experimental data vs. real Hi-C data at various genomic distances are presented. Missing values are NaN values derived by python (numpy). (c) We evaluated the overlap of significant loci-pair with real Hi-C data at each distance, using the preset cut-off. (d) We evaluated the overlap of all significant loci-pairs with various cut-off values, with respect to the false discovery rate which ranges from 0.001 to 0.05. (e) ROC analysis of overlap between interactions from CTCF ChIA-PET with identified interacting peaks from real high-resolution, downsampled, HiCPlus/HiCNN-enhanced, and DeepHiC-enhanced Hi-C matrices in the K562 cell line.
Fig 5
Fig 5. Enhancements of DeepHiC in detecting TAD boundaries, using insulation score algorithm.
(a) Graphs of insulation Δ scores derived from different Hi-C data. TAD boundaries are zero-points of insulation Δ scores in ascending intervals. Enlarged photos show that zero-points derived from DeepHiC-enhanced data are closest to those derived from real high-resolution data. (b) Distances from TAD boundaries obtained from downsampled/enhanced data to those obtained from real high-resolution data. Boxplots show that distances of DeepHiC-enhanced data are significantly smaller than others (***: p-value < 1×10⁻²⁰, *: p-value < 0.05,Wilcoxon rank-sum test). The whiskers are 5 and 95 percentiles. (c) The distribution of the overlaps between TADs in downsampled/enhanced data and those in real high-resolution data. Higher proportion of high Jaccard indices (y-axis) was obtained with use of DeepHiC-enhanced data. ***: p-value < 1×10⁻²⁰, **: p-value < 0.001, Mann Whitney U-test. Dash lines in violin plots are quantiles.
Fig 6
Fig 6. Analysis of significant interactions identified using DeepHiC-enhanced Hi-C data of mouse early embryonic development.
(a) Heatmaps showing examples of original and DeepHiC enhanced contact matrices for various stage of embryonic development. (b) Fraction of significant interactions for which anchor loci intersected with gene promoters. Error bar: standard deviation. Significance: ***: p-value < 1 × 10⁻²⁰ one-sample t-test. (c) Fraction of significant interactions for which both connected loci contain ATAC-seq signal peaks. Error bar: standard deviation. Significance: ***: p-value < 1 × 10⁻²⁰, one-sample t-test. (d) A representative Hi-C contact matrix, with significant interactions as depicted for the 8-cell stage. Left panel: Original Hi-C contact matrix and predicted significant interactions (bold pixels inside red circles). Right panel: DeepHiC enhanced contact matrix and predicted significant interactions (blue pixels).

References

    1. Lieberman-Aiden E, Van Berkum NL, Williams L, Imakaev M, Ragoczy T, Telling A, et al. Comprehensive mapping of long-range interactions reveals folding principles of the human genome. science. 2009;326(5950):289–93. 10.1126/science.1181369 - DOI - PMC - PubMed
    1. Dixon JR, Selvaraj S, Yue F, Kim A, Li Y, Shen Y, et al. Topological domains in mammalian genomes identified by analysis of chromatin interactions. Nature. 2012;485(7398):376 10.1038/nature11082 - DOI - PMC - PubMed
    1. Nora EP, Lajoie BR, Schulz EG, Giorgetti L, Okamoto I, Servant N, et al. Spatial partitioning of the regulatory landscape of the X-inactivation centre. Nature. 2012;485(7398):381 10.1038/nature11049 - DOI - PMC - PubMed
    1. Rao SS, Huntley MH, Durand NC, Stamenova EK, Bochkov ID, Robinson JT, et al. A 3D map of the human genome at kilobase resolution reveals principles of chromatin looping. Cell. 2014;159(7):1665–80. 10.1016/j.cell.2014.11.021 - DOI - PMC - PubMed
    1. Vian L, Pękowska A, Rao SS, Kieffer-Kwon K-R, Jung S, Baranello L, et al. The energetics and physiological impact of cohesin extrusion. Cell. 2018;173(5):1165–78. e20. 10.1016/j.cell.2018.03.072 - DOI - PMC - PubMed

Publication types