

A solution to minimum sample size for regressions
- PMID: 32084211
- PMCID: PMC7034864
- DOI: 10.1371/journal.pone.0229345
A solution to minimum sample size for regressions
Abstract
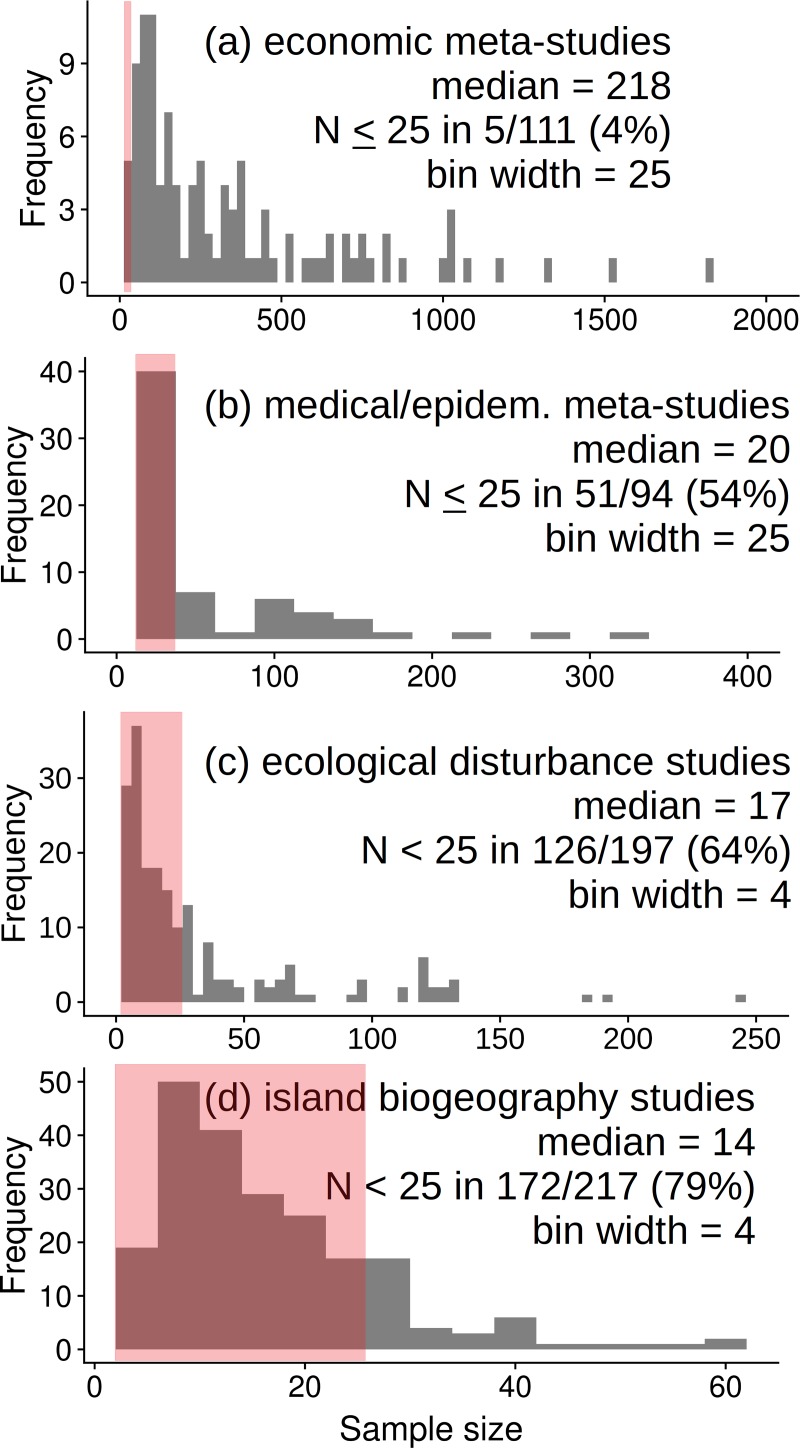
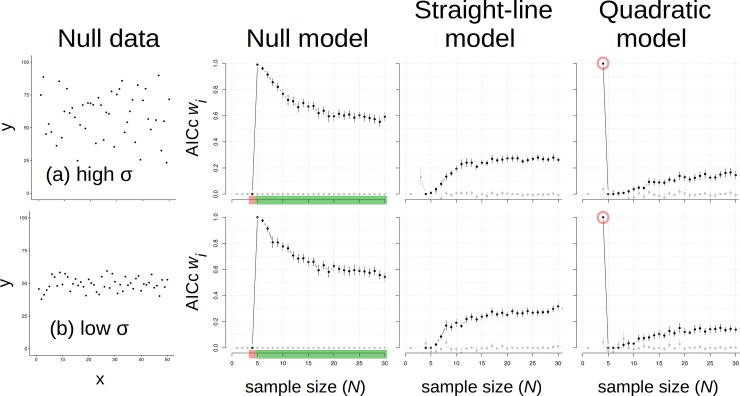
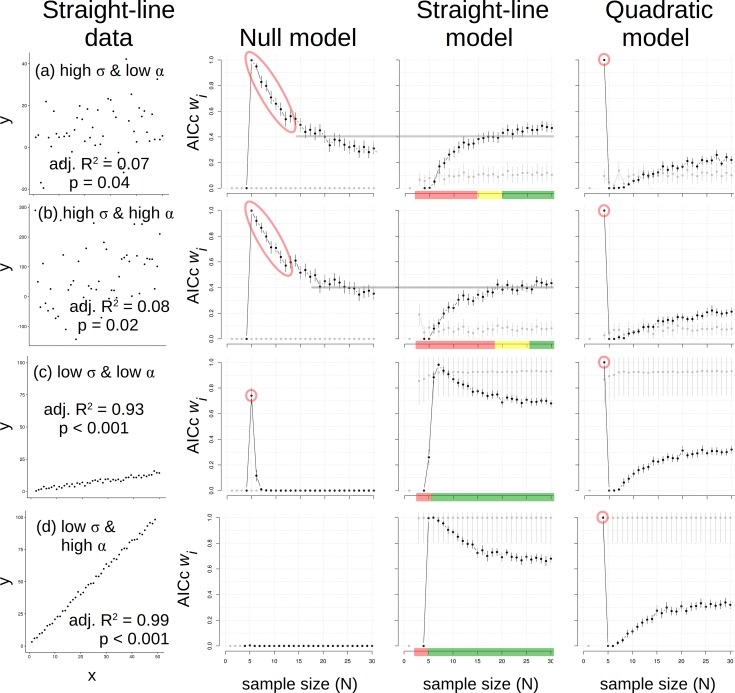
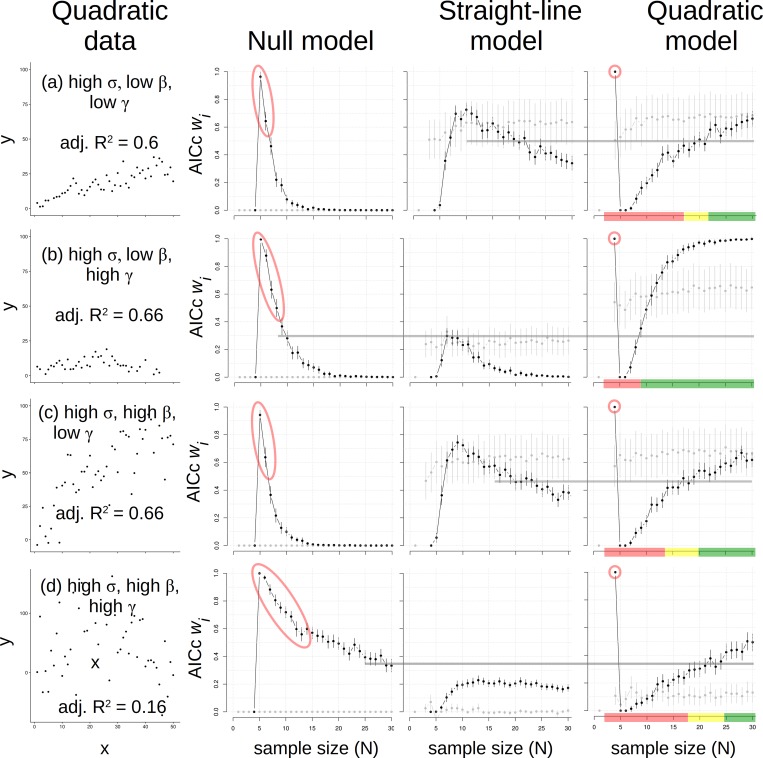
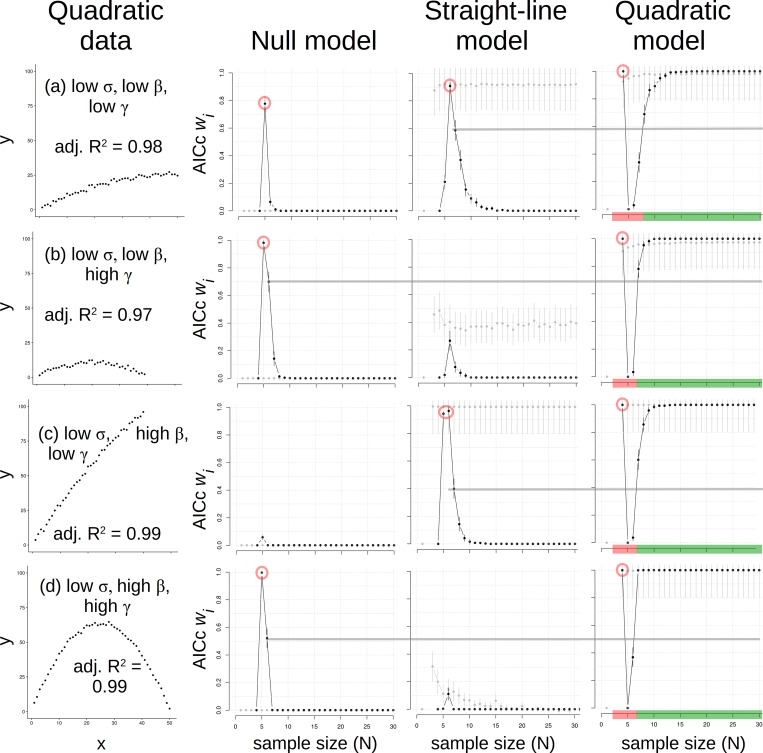
Regressions and meta-regressions are widely used to estimate patterns and effect sizes in various disciplines. However, many biological and medical analyses use relatively low sample size (N), contributing to concerns on reproducibility. What is the minimum N to identify the most plausible data pattern using regressions? Statistical power analysis is often used to answer that question, but it has its own problems and logically should follow model selection to first identify the most plausible model. Here we make null, simple linear and quadratic data with different variances and effect sizes. We then sample and use information theoretic model selection to evaluate minimum N for regression models. We also evaluate the use of coefficient of determination (R2) for this purpose; it is widely used but not recommended. With very low variance, both false positives and false negatives occurred at N < 8, but data shape was always clearly identified at N ≥ 8. With high variance, accurate inference was stable at N ≥ 25. Those outcomes were consistent at different effect sizes. Akaike Information Criterion weights (AICc wi) were essential to clearly identify patterns (e.g., simple linear vs. null); R2 or adjusted R2 values were not useful. We conclude that a minimum N = 8 is informative given very little variance, but minimum N ≥ 25 is required for more variance. Alternative models are better compared using information theory indices such as AIC but not R2 or adjusted R2. Insufficient N and R2-based model selection apparently contribute to confusion and low reproducibility in various disciplines. To avoid those problems, we recommend that research based on regressions or meta-regressions use N ≥ 25.
Conflict of interest statement
The authors have declared that no competing interests exist.
Figures
Similar articles
-
Subgroup analyses in randomised controlled trials: quantifying the risks of false-positives and false-negatives.Health Technol Assess. 2001;5(33):1-56. doi: 10.3310/hta5330. Health Technol Assess. 2001. PMID: 11701102 Review.
-
Effect size, statistical power, and sample size for assessing interactions between categorical and continuous variables.Br J Math Stat Psychol. 2019 Feb;72(1):136-154. doi: 10.1111/bmsp.12147. Epub 2018 Nov 23. Br J Math Stat Psychol. 2019. PMID: 30468259
-
How often should we expect to be wrong? Statistical power, P values, and the expected prevalence of false discoveries.Biochem Pharmacol. 2018 May;151:226-233. doi: 10.1016/j.bcp.2017.12.011. Epub 2017 Dec 14. Biochem Pharmacol. 2018. PMID: 29248599 Review.
-
Retrospective analysis: reproducibility of interblastomere differences of mRNA expression in 2-cell stage mouse embryos is remarkably poor due to combinatorial mechanisms of blastomere diversification.Mol Hum Reprod. 2018 Jul 1;24(7):388-400. doi: 10.1093/molehr/gay021. Mol Hum Reprod. 2018. PMID: 29746690
-
(I Can't Get No) Saturation: A simulation and guidelines for sample sizes in qualitative research.PLoS One. 2017 Jul 26;12(7):e0181689. doi: 10.1371/journal.pone.0181689. eCollection 2017. PLoS One. 2017. PMID: 28746358 Free PMC article.
Cited by
-
Validation of a Modified Submaximal Balke Protocol to Assess Cardiorespiratory Fitness in Individuals at High Risk of or With Chronic Health Conditions-A Pilot Study.Front Sports Act Living. 2021 Apr 22;3:642538. doi: 10.3389/fspor.2021.642538. eCollection 2021. Front Sports Act Living. 2021. PMID: 33969294 Free PMC article.
-
Herbaceous perennial plants with short generation time have stronger responses to climate anomalies than those with longer generation time.Nat Commun. 2021 Mar 23;12(1):1824. doi: 10.1038/s41467-021-21977-9. Nat Commun. 2021. PMID: 33758189 Free PMC article.
-
Etiology and duration of the disease in the assessment of intellectual functioning of pediatric patients with epilepsy: An observational study.Heliyon. 2023 Feb 25;9(3):e14085. doi: 10.1016/j.heliyon.2023.e14085. eCollection 2023 Mar. Heliyon. 2023. PMID: 36915569 Free PMC article.
-
Novel Th17 Lymphocyte Populations, Th17.1 and PD1+Th17, are Increased in Takayasu Arteritis, and Both Th17 and Th17.1 Sub-Populations Associate with Active Disease.J Inflamm Res. 2022 Mar 1;15:1521-1541. doi: 10.2147/JIR.S355881. eCollection 2022. J Inflamm Res. 2022. PMID: 35256852 Free PMC article.
-
Congruence in European and Asian perception of Vietnamese facial attractiveness, averageness, symmetry and sexual dimorphism.Sci Rep. 2023 Aug 16;13(1):13320. doi: 10.1038/s41598-023-40458-1. Sci Rep. 2023. PMID: 37587194 Free PMC article.
References
-
- Lau J, Ioannidis JP and Schmid CH. Quantitative synthesis in systematic reviews. Annals Internal Med. 1997; 127: 820–826. - PubMed
-
- Baker WL, White C, Cappelleri JC, Kluger J, Coleman CI, from the Health Outcomes, Policy, and Economics (HOPE) Collaborative Group. Understanding heterogeneity in meta-analysis: the role of meta-regression. International Journal of Clinical Practice. 2009; 63: 1426–1434. 10.1111/j.1742-1241.2009.02168.x - DOI - PubMed
-
- Koricheva J, Gurevitch J, Mengersen K. editors. Handbook of meta-analysis in ecology and evolution. Princeton University Press. 2013.
-
- Stanley TD, Jarrell SB. Meta-regression analysis: a quantitative method of literature surveys. J. Economic Surveys. 2005; 19: 299–308.
MeSH terms
LinkOut - more resources
Full Text Sources
