. 2020 Feb 21;16(2):e1008359.
doi: 10.1371/journal.ppat.1008359. eCollection 2020 Feb.

Single-cell glycolytic activity regulates membrane tension and HIV-1 fusion

Affiliations

Single-cell glycolytic activity regulates membrane tension and HIV-1 fusion

Charles A Coomer et al. PLoS Pathog. .

Erratum in

Abstract

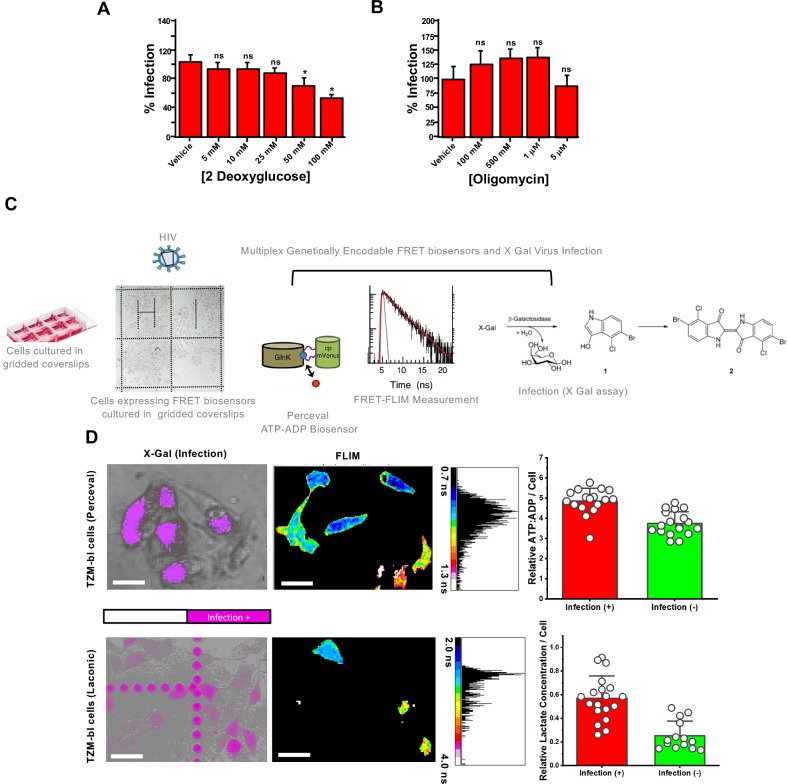
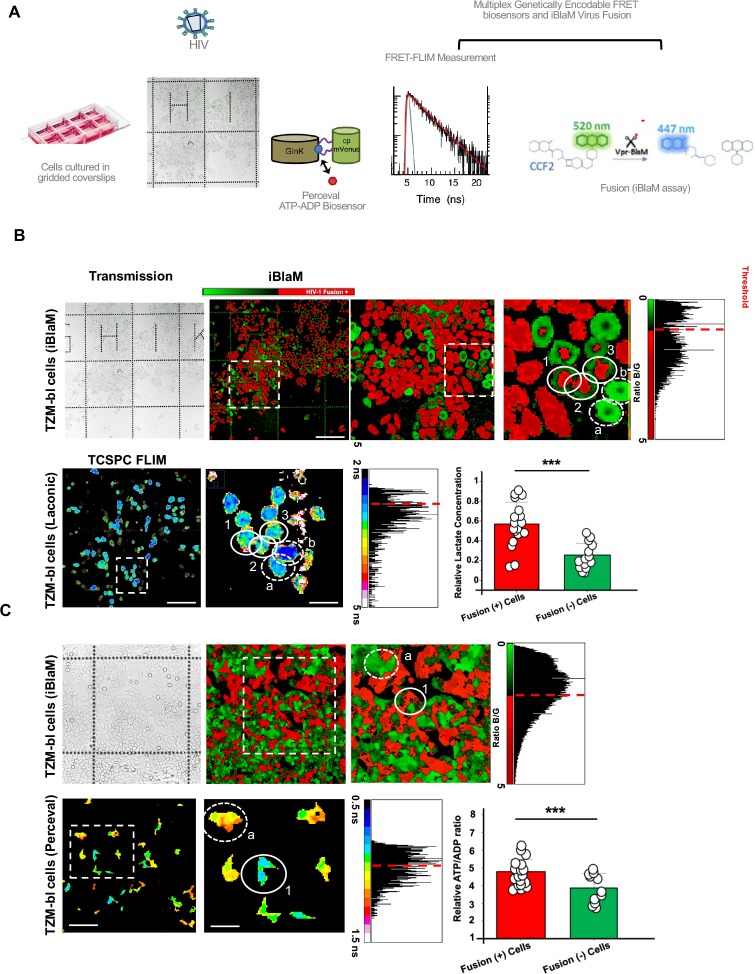
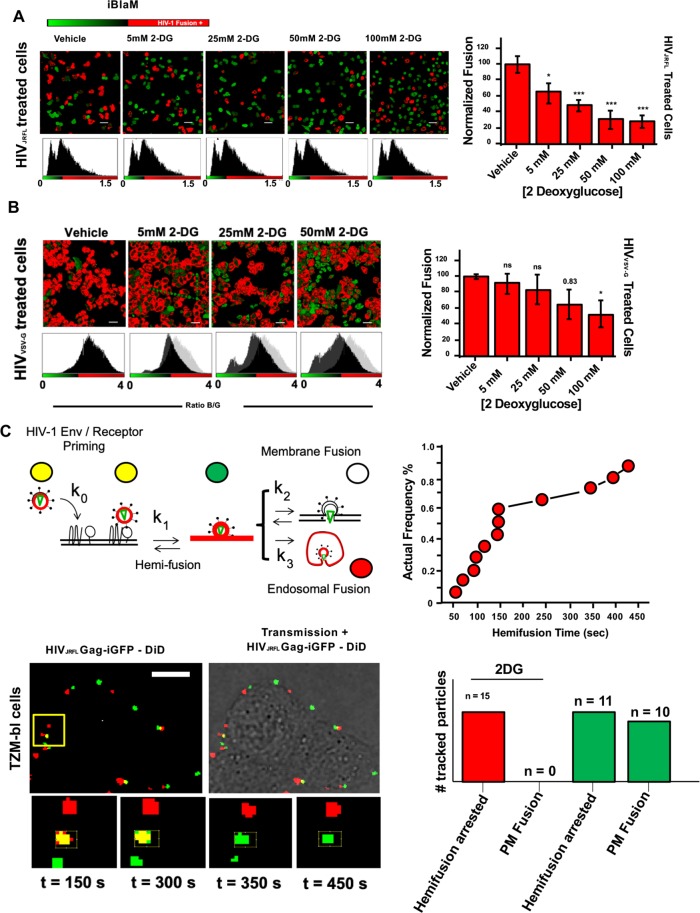
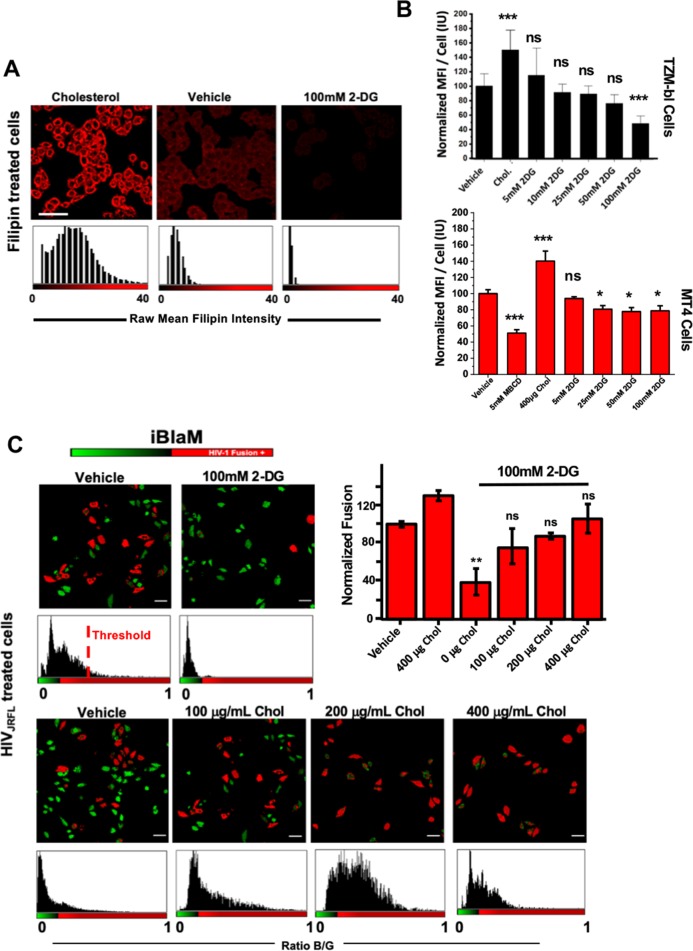
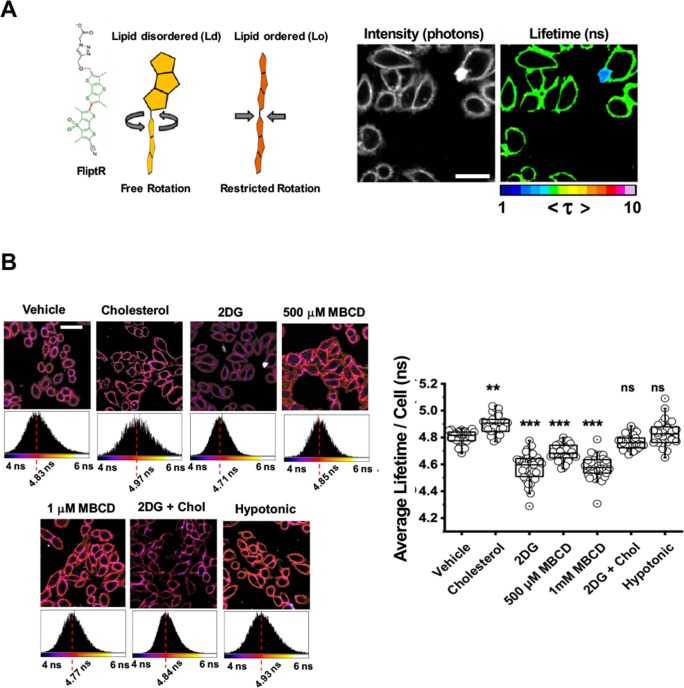
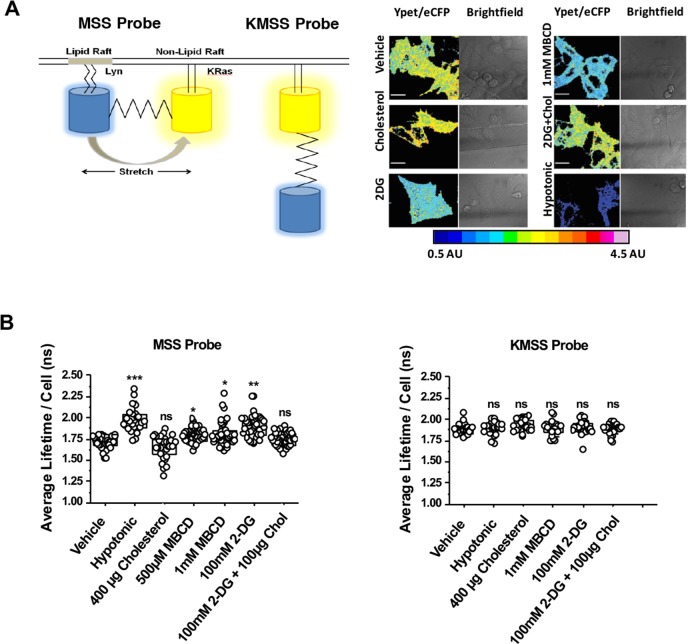
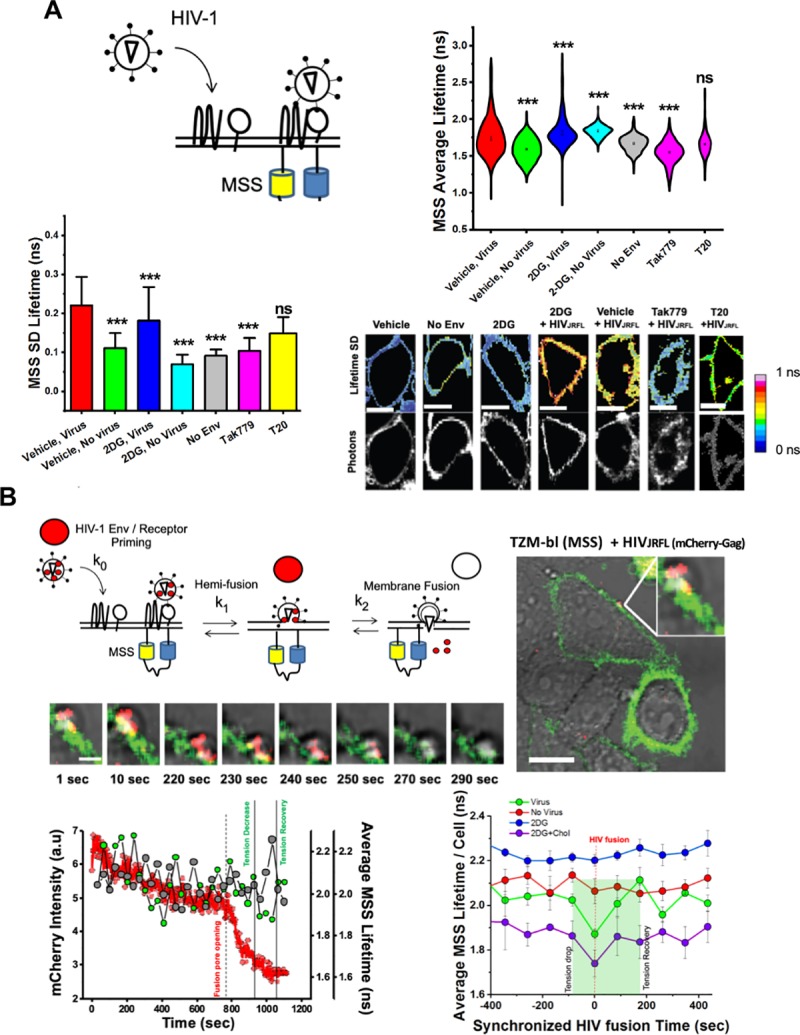
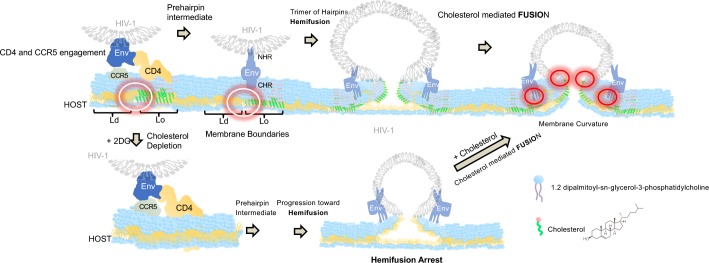
There has been resurgence in determining the role of host metabolism in viral infection yet deciphering how the metabolic state of single cells affects viral entry and fusion remains unknown. Here, we have developed a novel assay multiplexing genetically-encoded biosensors with single virus tracking (SVT) to evaluate the influence of global metabolic processes on the success rate of virus entry in single cells. We found that cells with a lower ATP:ADP ratio prior to virus addition were less permissive to virus fusion and infection. These results indicated a relationship between host metabolic state and the likelihood for virus-cell fusion to occur. SVT revealed that HIV-1 virions were arrested at hemifusion in glycolytically-inactive cells. Interestingly, cells acutely treated with glycolysis inhibitor 2-deoxyglucose (2-DG) become resistant to virus infection and also display less surface membrane cholesterol. Addition of cholesterol in these in glycolytically-inactive cells rescued the virus entry block at hemifusion and enabled completion of HIV-1 fusion. Further investigation with FRET-based membrane tension and membrane order reporters revealed a link between host cell glycolytic activity and host membrane order and tension. Indeed, cells treated with 2-DG possessed lower plasma membrane lipid order and higher tension values, respectively. Our novel imaging approach that combines lifetime imaging (FLIM) and SVT revealed not only changes in plasma membrane tension at the point of viral fusion, but also that HIV is less likely to enter cells at areas of higher membrane tension. We therefore have identified a connection between host cell glycolytic activity and membrane tension that influences HIV-1 fusion in real-time at the single-virus fusion level in live cells.


Conflict of interest statement

The authors have declared that no competing interests exist.

Figures

Fig 1
Fig 1. Relative lactate and ATP/ADP concentrations in single cells correlate with HIV-1 infection.
A.) Bar charts depicting % eGFP-expressing cells (i.e. mean of three independent experiments) as a marker of infection illustrating that acute treatment with increasing concentrations of2-DG for two hours led to reductions in HIV-1VSV-G infection in human MT4 T cells. B.) Bar charts depicting % eGFP-expressing cells (i.e. mean of three independent experiments) as a marker of infection illustrating that acute treatment with increasing concentrations of oligomycin for two hours did not inhibit HIV-1VSV-G infection in human MT4 T cells. C.) Approach to evaluate if basal, single-cell ATP:ADP ratio could predict HIV-1JR-FL infection in TZM-bl cells. TZM-bl cells were seeded onto an Ibidi 8-well gridded dish and transiently transfected with metabolic sensing biosensors Laconic or Perceval. FLIM images of cells transiently expressing these biosensors were recorded, denoting the location of the cells on the grid. These cells were then treated with HIV-1JR-FL, and after 48 hours a β-galactosidase assay was recorded on the same cells as a readout of infection. D.) (Top row) Representative images of β-galactosidase recorded 48 hours after HIV-1JR-FL infection (left) and basal FLIM images of intracellular lactate biosensor Laconic-expressing TZM-bl cells taken before infection (right) illustrating cells with higher intracellular lactate concentrations (warm colours, solid white circle) were more likely to be infected by HIV-1JR-FL (top row, solid white circle); scale bar 50μm. (Bottom Row) Representative images of β-galactosidase recorded 48 hours after HIV-1JR-FL infection (left) and basal FLIM images of intracellular ATP:ADP biosensor Perceval-expressing TZM-bl cells taken before infection (right) illustrating cells with higher intracellular ATP:ADP concentrations (cool colours, solid white 1, 2 circle) were more likely to be infected by HIV-1JR-FL (bottom row, solid white 1,2 and 3 circles); scale bar 50 μm. Built-in negative controls noted with dotted white circles (a, first row and a,b, second row) are presented in both cases (Laconic and Perceval expressing cells). Data depicted in bar charts are a mean of three experiments with at least 30 analysed cells per condition. *** p<0.001 as determined by Student T test of three independent experiments.
Fig 2
Fig 2. Relative lactate and ATP/ADP concentrations in single cells correlate with HIV-1 fusion.
A.) Approach to evaluate if basal, single-cell ATP:ADP ratios or intracellular Lactate concentrations could predict HIV-1JR-FL fusion. TZM-bl cells were seeded onto an Ibidi 8-well gridded dish and transiently transfected with metabolic sensing biosensors Laconic or Perceval. FLIM images of cells transiently expressing these biosensors were recorded, denoting the location of the cells on the grid. These cells were then treated with HIV-1JR-FL. After 90 minutes, viruses were washed away and a β-lactamase assay was recorded on the same cells as a readout of HIV-1JR-FL fusion. B.) Representative images of CCF2-loaded cells in Ibidi 8-well gridded dishes recorded 90 minutes after HIV-1JR-FL infection (top row, white solid circles denoting red cells undergoing fusion) and basal FLIM images of intracellular lactate biosensor Laconic-expressing TZM-bl cells taken before HIV-1JR-FL treatment (bottom row) illustrating cells with higher intracellular lactate concentrations (warm colours, solid white circles) were more likely to be scored fusion-positive for HIV-1JR-FL fusion by the β-lactamase assay (bottom row); scale bar, in order of appearance: 200μm, 100μm, 50μm. Built-in controls of cells not undergoing fusion that in turn presented lower lifetimes (cold colours) are stressed with dotted circles C.) Representative images of CCF2-loaded cells in Ibidi 8-well gridded dishes recorded 90 minutes after HIV-1JR-FL treatment (top row) and basal FLIM images of intracellular ATP:ADP biosensor Perceval-expressing TZM-bl cells taken before HIV-1JR-FL treatment (bottom row) illustrating cells with higher intracellular ATP:ADP concentrations (cool colours, solid white circle) were more likely to be scored fusion-positive for HIV-1JR-FL fusion by the β-lactamase assay (bottom row, solid white circle stressing a red fusion positive cells) scale bar, in order of appearance 100μm, 50μm. Data depicted in bar charts are a mean of three experiments with at least 30 analysed cells per condition. *** p<0.001 as determined by Student T test of three independent experiments.
Fig 3
Fig 3. Addition of 2DG arrests HIV-1 fusion at the hemifusion stage.
A.) (Left) Representative images of CCF2-loaded cells recorded 90 minutes after HIV-1JR-FL infection in vehicle and incrementally increasing 2-DG treatment conditions; scale bar 50μm. (Right) Corresponding bar graph compiling data extracted from the β-lactamase assay and normalised to vehicle-treated control illustrating that increasing concentrations of 2-DG led to reductions in viral fusion for HIV-1JR-FL. in TZM-bl cells (mean of three independent experiments). *p<0.5, **p<0.01 *** p<0.001 as determined by one-way ANOVA. B.) (Left) Representative images of CCF2-loaded cells recorded 90 minutes after HIV-1VSV-G infection in vehicle and incrementally increasing 2-DG treatment conditions; scale bar 50μm. (Right) Corresponding bar graph compiling data extracted from the β-lactamase assay and normalised to vehicle-treated control illustrating that increasing concentrations of 2-DG led to partial reduction in viral fusion for HIV-1VSV-G in TZM-bl cells (mean of three independent experiments). *p<0.5, **p<0.01 *** p<0.001 as determined by one-way ANOVA. C.) (Top row, left) Cartoon diagram illustrating the concept of single-particle tracking with double-labelled virions with DiD and eGFP-gag. Briefly, double-labelled virions entering via endocytosis will have their eGFP-gag signal infinitely diluted during endosomal fusion whilst DiD signal is retained in the endosome, which is mobile. Virions entering via plasma membrane fusion will have their DiD signal infinitely diluted in the plasma membrane whereas the eGFP-gag signal is retained and mobile. Hemifusion is denoted when DiD signal infinitely diluted in the plasma membrane whereas the eGFP-gag signal is retained and immobile. (Top row, right) Kinetics of the individual hemifusion events plotted as cumulative distributions as a function of time. (Bottom row, left) Representative panel of images illustrating doubled-labelled HIV-1JRFL particles losing DiD signal (red) and maintaining immobile eGFP signal (green) when attempting fusion in 2-DG treated cells, suggesting arrest at hemifusion (n = 15, acquired during three independent experiments). (Bottom row, right) Bar chart representing the total number of HIVJRFL double-labelled particles tracked for TZM-bl cells treated with 2DG (red bars) and without treatment (green bars). Only in cells without 2-DG treatment plasma membrane fusion was observed. Total number events tracked in control conditions: 217. Total number of events tracked in 2-DG-treated conditions: 236.
Fig 4
Fig 4. Addition of 2-DG sequesters cholesterol from the cell membrane.
A.) Representative images depicting filipin mean fluorescence intensity per cell indicating two-hour incubation of increasing concentrations of 2-DG decreases surface cholesterol in TZM-bl cells; scale bar 50 μm. B.) Bar charts depicting mean fluorescence intensity per cell of three independent experiments normalised to vehicle in TZM-bl cells (top) and MT4 cells (bottom) in cells treated with 400μg/mL cholesterol, 5mM MBCD and increasing concentrations of 2-DG. C.) Representative images (left) and bar chart (right) of three independent experiments depicting percent of fusion positive cells, as determined by the BlaM assay, relative to vehicle control illustrating increasing concentrations of cholesterol rescues fusion in 2-DG treated TZM-bl cells; scale bar 50 μm. *p<0.5, **p<0.01 *** p<0.001 as determined by one-way ANOVA.
Fig 5
Fig 5. Addition of 2-DG decreases cellular plasma membrane order.
A.) (Left) Cartoon diagram depicting a model of the planarizable, push-pull membrane order probe FlipTR, constructed from two large dithienothiophene flippers, in Ld and Lo environments. (Right) Representative image of FlipTR-stained cells in untreated conditions depicting the homogenous distribution of lifetimes throughout the entirety of the cell; scale bar 25μm. B.) (Top) Representative images of FlipTR-stained cells in listed treatment conditions depicting the extracted τm; scale bar 25μm. (Right) Bar charts depicting the average long lifetime (τ1) in TZM-bl cells under listed treatment conditions (n = at least 30 per condition, collected during the course of three independent experiments). * p<0.05 ** p<0.01 *** p<0.001 as determined by one-way ANOVA.
Fig 6
Fig 6. Acute treatment of TZM-bl cells with 2-DG increases plasma membrane tension.
A.) (Left) Cartoon diagram model depicting membrane tension FRET probe MSS and its control probe (insensitive to membrane tension), KMSS. (Right) Representative pseudocoloured FRET efficiency (i.e. Ypet/eCFP) images of TZM-bl cells expressing MSS under listed treatment conditions; scale bar 10μm. B.) (Left) Dot plots depicting donor CFP lifetimes of the tension-sensitive MSS probes extracted from single cells in the treatment conditions listed (n = at least 20/condition, collected during the course of three independent experiments; *p<0.5, **p<0.01 *** p<0.001 as determined by either one-way ANOVA). (Right) Dot plots depicting donor CFP lifetimes of the tension-insensitive KMSS probes extracted from single cells in the treatment conditions listed (n = at least 30/condition, collected during the course of three independent experiments; *p<0.5, **p<0.01 *** p<0.001 as determined by either one-way ANOVA).
Fig 7
Fig 7. Multiplexed FLIM with SVT reveals a drop in local tension during single HIV-1 fusion in live cells.
A.) (Top Left) Cartoon diagram depicting approach to determine plasma membrane tension fluctuations during virus entry. (Top Right) Violin plots of average MSS lifetimes per cell per frame during FLIM acquisition during viral entry in TZM-bl cells. Dots in each plot represent the mean of each condition, which was the calculated from at least 50 frames for at least 20 cells per condition during three independent experiments. (Bottom Left) Standard deviation of MSS lifetimes per cell from real-time FLIM acquisition during viral entry in TZM-bl cells, which was calculated from at least 50 frames for at least 20 cells per condition during three independent experiments. * p<0.05 ** p<0.01 *** p<0.001 as determined by one-way ANOVA of three independent experiments. (Bottom Right) Representative images of the standard deviation of MSS lifetimes per cell for each condition during viral entry; scale bar 2μm.* p<0.05 ** p<0.01 *** p<0.001 as determined by one-way ANOVA of three independent experiments. B.) (Top Left) Approach to combine SPT and MSS lifetime values to analyse local membrane tension during HIV-1JR-FL entry. (Right and below) Representative images of a single -mCherry-Gag JR-FL pseudotyped VLP entering MSS-transfected TZM-bl cells are also depicted; scale bar is 20μm and 2μm for the large and smaller images, respectively. (Bottom Left) Representative line-graphs showing local lifetimes in overlapping mCherry-Gag regions (green) and non-overlapping regions (grey) for a single virus particle during entry (loss of mCherry signal, red) in TZM-bl cells. (Bottom Right) Compiled local MSS lifetimes during multiple viral fusion events (green) and respective virus-free regions within the same cell (red) compared to regions of 2-DG treated cells where viruses were incapable of fusion (blue) or rescued events due to cholesterol treatment (purple) in TZM-bl cells. Each point represents a mean of at least 20 cells obtained during three separate experiments.
Fig 8
Fig 8. Cholesterol availability regulates the transition between HIV-1 hemifusion and fusion.
HIV-1 Env sequentially interacts with CD4 and CCR5 at the boundaries of ordered lipid domains. The progression toward hemifusion is not cholesterol dependent as cells treated with 2DG had a reduced concentration of cholesterol and were able to progress toward HIV-1 hemifusion. Viruses exposed to cells pre-treated with 2DG were arrested right at hemifusion and only the addition of cholesterol rescued full fusion suggesting that cholesterol is a limiting factor in the HIV-1 fusion reaction in the process of fusion pore formation. White circles (left panels) represent lipid boundaries where cholesterol might induce HIV-1 Env priming and favour the pre-hairpin intermediate. Red circles (right panels) represent a potential role of cholesterol during fusion pore formation and membrane curvature.

References

    1. Dalgliesh AG; Beverley PCL; Clapham PR: Crawford, DH; Greaves, MF; Weiss R. The CD4 (T4) antigen is an essential component of the receptor for the AIDS retrovirus. Nature. 1984;312:763–7. 10.1038/312763a0 - DOI - PubMed
    1. Dragic T; Litwin V; Allaway GP; Martin SR; Huang Y; Nagashima KA; Cyanan C; Maddon PJ; Koup RA; Moore JP; Paxton W. HIV-1 entry into CD4+ cells is mediated by the chemokine receptor CC-CKR-5. Nature. 1996;381:667–73. 10.1038/381667a0 - DOI - PubMed
    1. Feng Y, Broder CC, Kennedy PE, Berger EA. HIV-1 Entry Cofactor: Functional cDNA Cloning of a Seven-Transmembrane, G Protein-Coupled Receptor. Science (80-). 1996;272(May). - PubMed
    1. Gallo SA, Finnegan CM, Viard M, Raviv Y, Dimitrov A, Rawat SS, et al. The HIV Env-mediated fusion reaction. Biochim Biophys Acta—Biomembr. 2003;1614:36–50. - PubMed
    1. Deeks SG, Lewin SR, Ross AL, Ananworanich J, Benkirane M, Cannon P, et al. International AIDS Society global scientific strategy: towards an HIV cure 2016. Nat Med. 2016;22(8):839–50. 10.1038/nm.4108 - DOI - PMC - PubMed

Publication types

Substances