. 2021 May;34(5):e4257.
doi: 10.1002/nbm.4257. Epub 2020 Feb 21.

Preprocessing, analysis and quantification in single-voxel magnetic resonance spectroscopy: experts' consensus recommendations

Affiliations

Preprocessing, analysis and quantification in single-voxel magnetic resonance spectroscopy: experts' consensus recommendations

Jamie Near et al. NMR Biomed. 2021 May.

Abstract

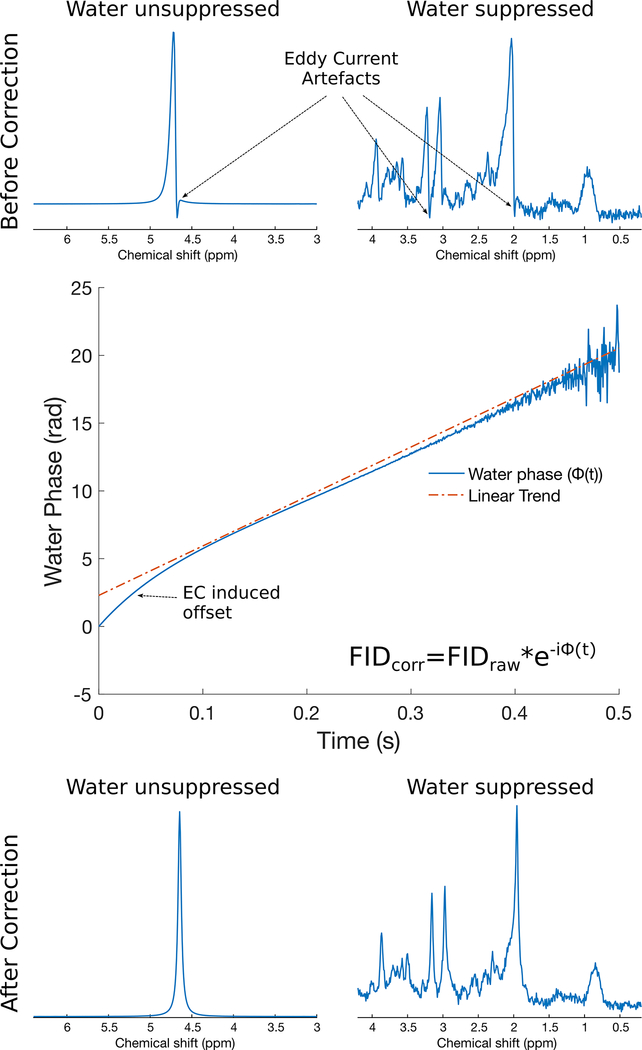
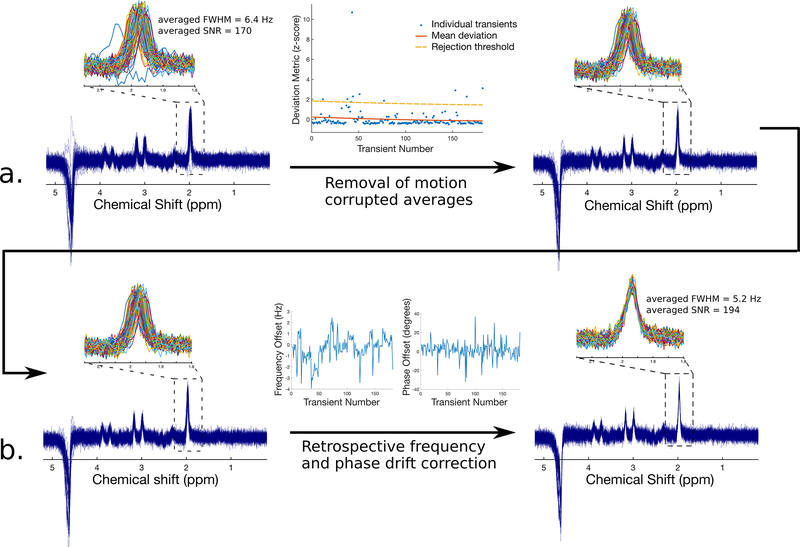
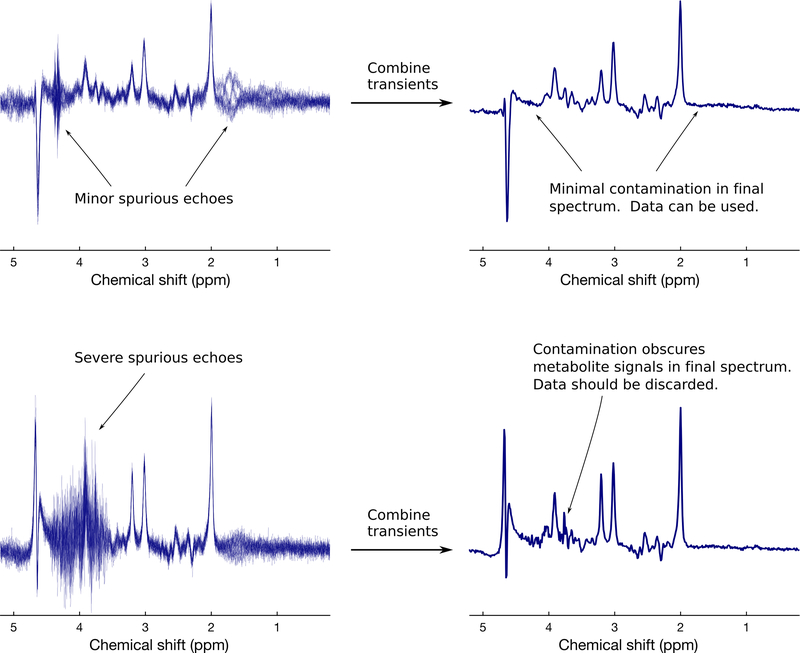
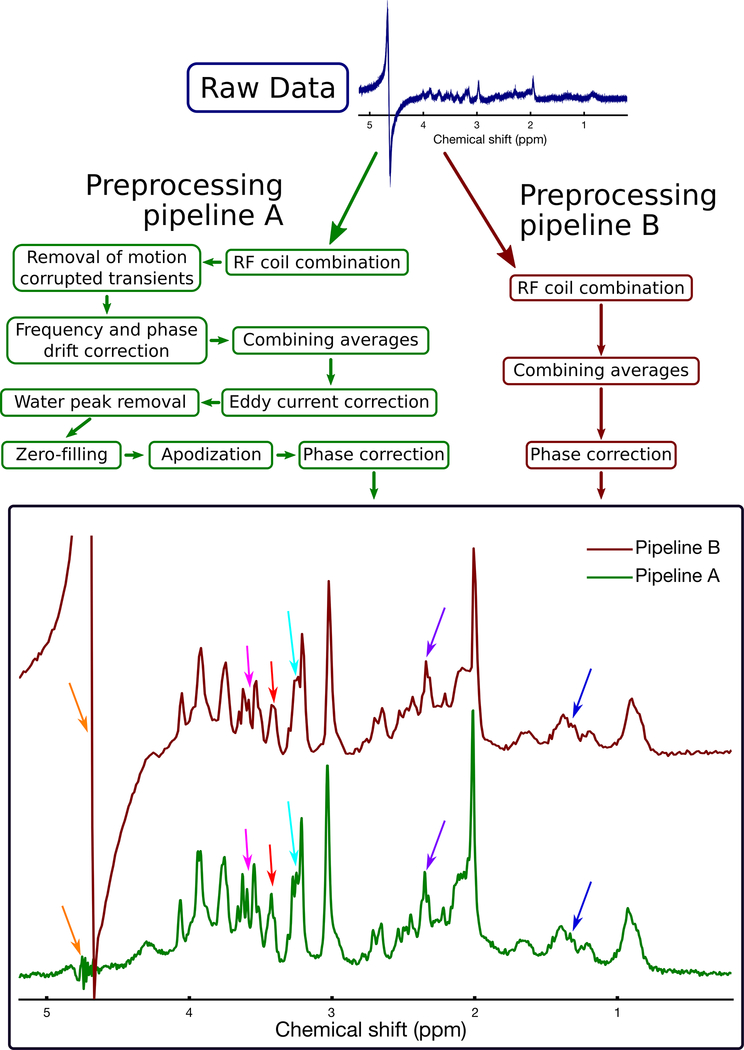
Once an MRS dataset has been acquired, several important steps must be taken to obtain the desired metabolite concentration measures. First, the data must be preprocessed to prepare them for analysis. Next, the intensity of the metabolite signal(s) of interest must be estimated. Finally, the measured metabolite signal intensities must be converted into scaled concentration units employing a quantitative reference signal to allow meaningful interpretation. In this paper, we review these three main steps in the post-acquisition workflow of a single-voxel MRS experiment (preprocessing, analysis and quantification) and provide recommendations for best practices at each step.

Keywords: MRS; analysis; preprocessing; processing; quantification; quantitation; water referencing.


Figures

Figure 1.
Figure 1.
Eddy current correction in synthetic 3T human brain PRESS spectra with TE=30 ms. In the top panel, water reference (left) and water suppressed (right) spectra with eddy current artefacts are shown. The central panel shows the phase evolution of the water reference FID before eddy current correction. Any deviation from linearity in this phase function is the result of the eddy current effect. The bottom panel shows the same water reference (left) and water suppressed (right) spectra following eddy current correction.
Figure 2.
Figure 2.
Removal of corrupted transients and retrospective frequency and phase drift correction from a 3T human brain PRESS acquisition with TE=270 ms. Removal of motion corrupted transients is shown in the top panel (a). Corrupted transients stand out as noticeably different from the others, and are effectively removed using an unsupervised outlier removal procedure (see Ref. 15). Subsequent retrospective frequency and phase drift correction is shown in the bottom panel (b). Following drift correction using spectral registration, the individual transients have improved coherence and can now be averaged. These processing steps yield a marked improvement in both the FWHM and SNR of the final averaged spectrum.
Figure 3.
Figure 3.
Examples of spurious echoes in 3 T human brain MRS data (TE=68 ms). In the top panel, minor spurious echoes are observed in the individual transients around 1.8 ppm and 4.3 ppm. However, following averaging of the phase cycled scans, these are effectively removed, so that this spectrum can be safely analyzed. In the bottom panel, severe spurious echoes are observed in the individual transients between 3.5–4.6 ppm. Even after combining these phase cycled averages, visible contamination remains (e.g. overall jagged character of the spectrum between 3.6–4.4 ppm, distortion of the glutamate-H2 doublet at 3.75 ppm, and distortion of the myo-inositol peak at 4.1 ppm), and this spectrum should therefore be discarded.
Figure 4.
Figure 4.
Illustration of two example processing pipelines, applied to the same raw data. The dataset was obtained from a rat brain using the PRESS sequence at 7 T with TE=11 ms. Processing pipeline B (dark red boxes, right side) includes only basic steps to combine the coils and transients (similar to the standard processing pipeline provided by clinical scanner vendors). Processing pipeline A (green boxes, left side) involves additional steps to remove motion corrupted averages, to retrospectively correct frequency and phase drift, and to remove eddy current artefacts. Pipeline A resulted in several noticeable improvements in spectral quality, including reduced water contamination (orange arrows), and improved visual definition of most spectral peaks, including lactate (1.3 ppm, dark blue arrows), glutamate-H4 (2.3 ppm, purple arrows), tCho (3.2 ppm, light blue arrows), taurine (3.4 ppm, red arrows), and myo-inositol (3.5 ppm, pink arrows). These improvements highlight the importance of using an appropriate processing pipeline. Note that as stated in the recommendations tables, zero-filling and apodization may be used to improve the visual appearance of the spectrum, but should not be performed prior to spectral analysis.
Figure 5.
Figure 5.
Macromolecule estimation in short-TE MRS. The top trace (blue) shows a 3 T MR spectrum from a human subject using the SPECIAL sequence with TE=8.5 ms. The second trace from the top (black) shows the metabolite-nulled MM spectrum from the same individual and voxel position, obtained using the same pulse sequence, but with an inversion recovery preparation. The third trace from top (dark red) illustrates a simple model fit of the above MM spectrum using 8 individual Lorentzian components. The 8 individual components of the modelled MM spectrum fit are shown in the bottom traces.
Figure 6.
Figure 6.
Two examples of linear combination model fitting are shown. In both cases the acquired data are displayed at the top in dark red, the overall fit is displayed second from the top in green, and the fit residual is displayed third from the top in dark blue. Below the fit residual, the individual metabolite fit components are displayed in black. The example on the left is from a 3 T human brain PRESS spectrum with TE=68 ms. The example on the right is from a 3 T human brain MEGA-PRESS difference edited spectrum with TE=68 ms. Note the small peaks around 3.0 ppm in the MEGA-PRESS fit residual, indicating imperfect modelling of the GABA signal due to MM contamination.

References

    1. Maudsley AA. Advanced magnetic resonance spectroscopic neuroimaging techniques: Experts’ consensus recommendations. NMR Biomed 2019;In preparation. - PMC - PubMed
    1. Inati SJ, Naegele JD, Zwart NR, et al. ISMRM Raw data format: A proposed standard for MRI raw datasets. Magn Reson Med 2017;77:411–21. - PMC - PubMed
    1. Klose U In vivo proton spectroscopy in presence of eddy currents. Magn Reson Med 1990;14:26–30. - PubMed
    1. de Graaf AA, van Dijk JE, Bovee WM. QUALITY: quantification improvement by converting lineshapes to the Lorentzian type. Magn Reson Med 1990;13:343–57. - PubMed
    1. Bartha R, Drost DJ, Menon RS, Williamson PC. Spectroscopic lineshape correction by QUECC: combined QUALITY deconvolution and eddy current correction. Magn Reson Med 2000;44:641–5. - PubMed

Publication types

Substances