. 2020 Mar 5;180(5):915-927.e16.
doi: 10.1016/j.cell.2020.01.032. Epub 2020 Feb 20.

Passenger Mutations in More Than 2,500 Cancer Genomes: Overall Molecular Functional Impact and Consequences

Affiliations

Passenger Mutations in More Than 2,500 Cancer Genomes: Overall Molecular Functional Impact and Consequences

Sushant Kumar et al. Cell. .

Abstract

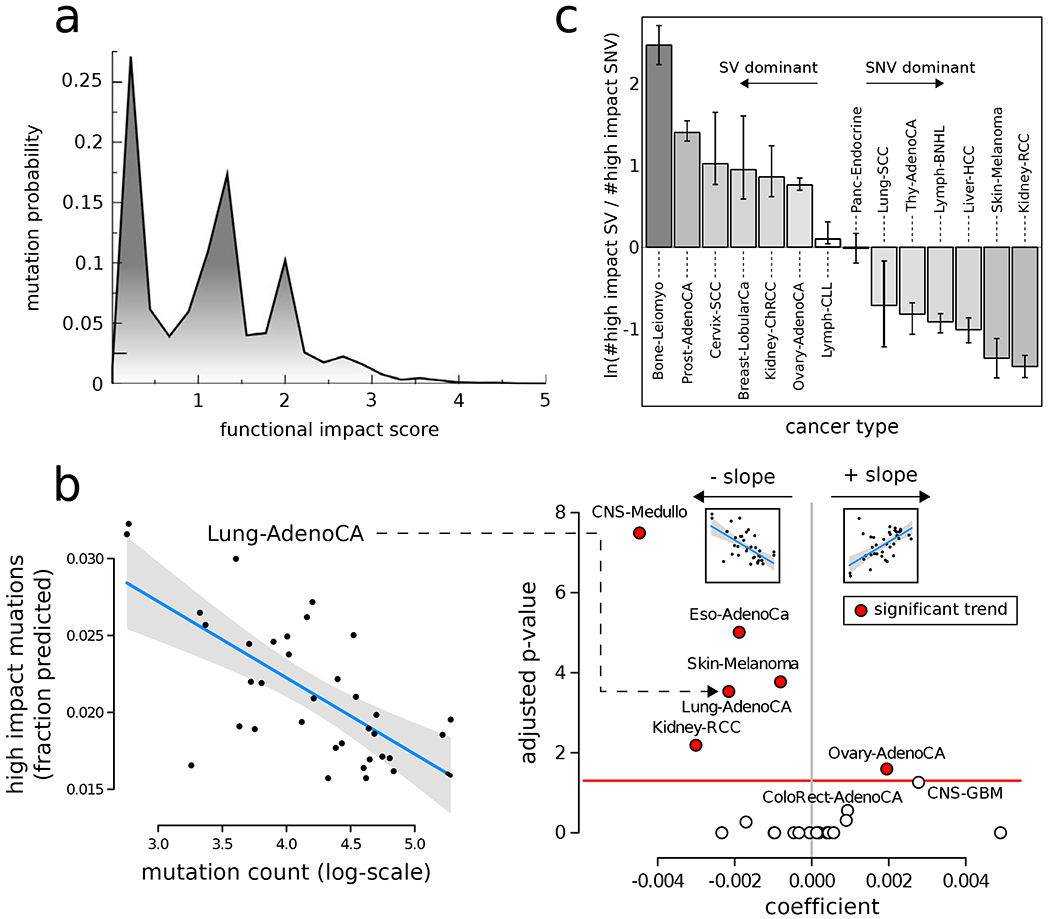
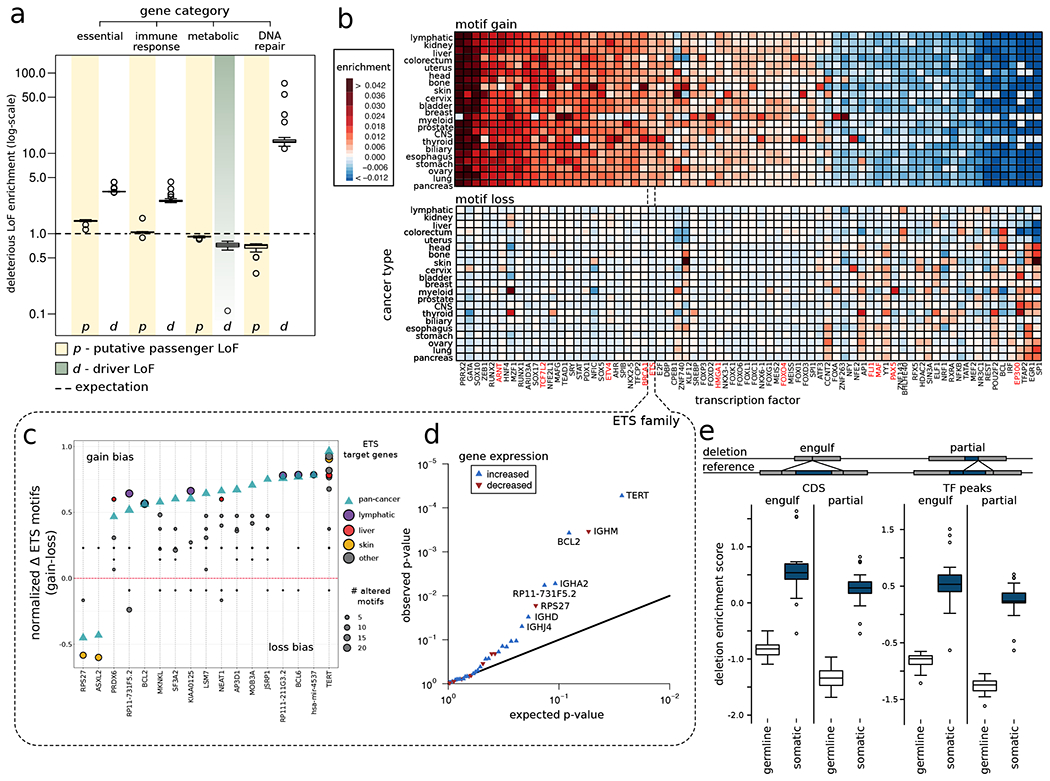
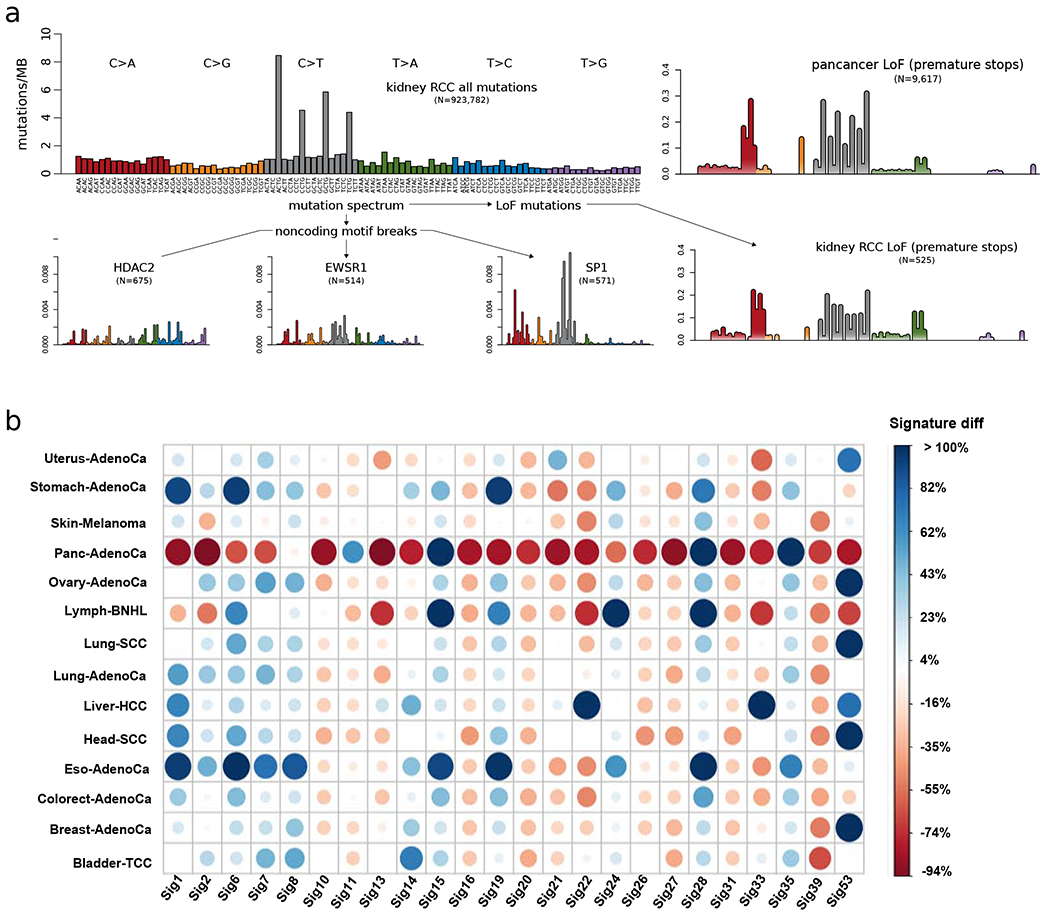
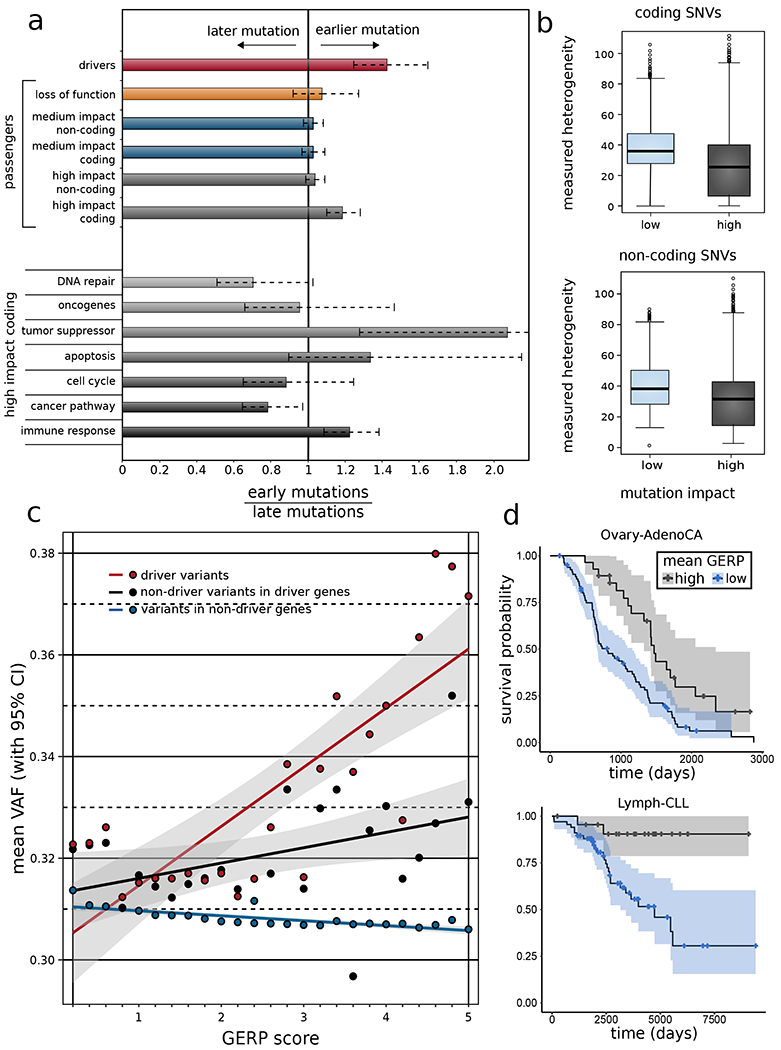
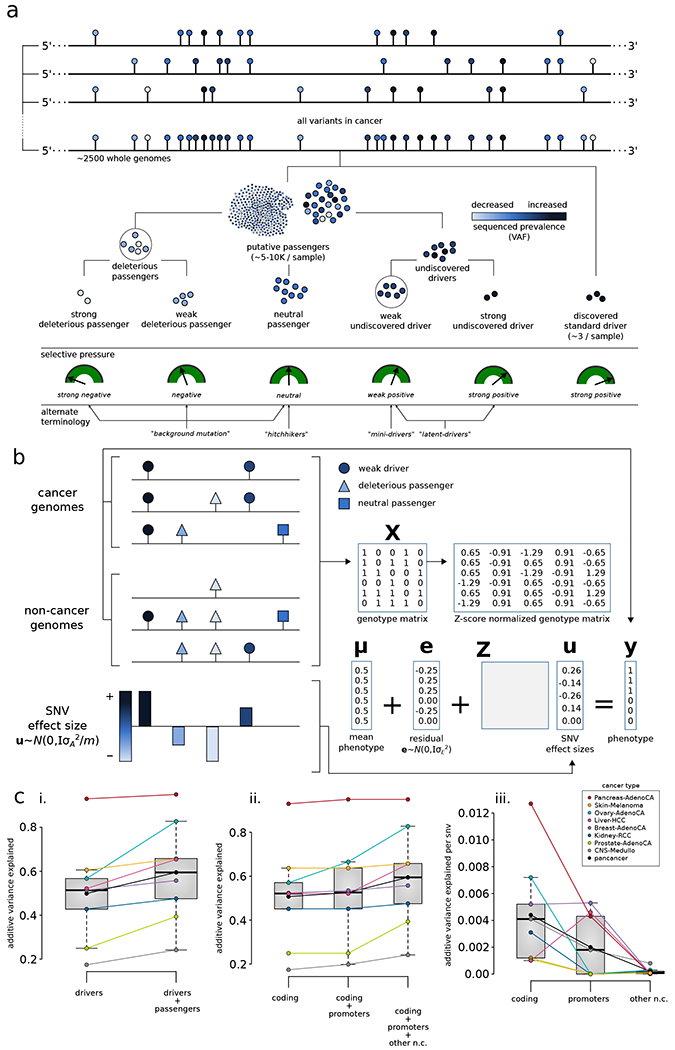
The dichotomous model of "drivers" and "passengers" in cancer posits that only a few mutations in a tumor strongly affect its progression, with the remaining ones being inconsequential. Here, we leveraged the comprehensive variant dataset from the ICGC/TCGA Pan-Cancer Analysis of Whole Genomes (PCAWG) project to demonstrate that-in addition to the dichotomy of high- and low-impact variants-there is a third group of medium-impact putative passengers. Moreover, we also found that molecular impact correlates with subclonal architecture (i.e., early versus late mutations), and different signatures encode for mutations with divergent impact. Furthermore, we adapted an additive-effects model from complex-trait studies to show that the aggregated effect of putative passengers, including undetected weak drivers, provides significant additional power (∼12% additive variance) for predicting cancerous phenotypes, beyond PCAWG-identified driver mutations. Finally, this framework allowed us to estimate the frequency of potential weak-driver mutations in PCAWG samples lacking any well-characterized driver alterations.

Keywords: PCAWG; additive-efects; cancer genomics; deleterious passengers; driver mutations; molecular impact; passenger mutations; weak drivers.


Conflict of interest statement

Declaration of Interests G.G. received funds from IBM and Pharmacyclics. G.G. is listed as inventor for multiple patent applications including MuTect, ABSOLUTE, POLYSOLVER, MutSig, and MSMuTect.

Figures

Figure 1:
Figure 1:. Overall functional impact of PCAWG variants:
a) Functional impact distribution in non-coding (DNase hypersensitive sites averaged across multiple cell lines) regions: three peaks correspond to low-, medium-, and high-impact mutations. b) Correlation between the fraction of high- and medium-impact non-coding SNVs and the total mutational counts for lung adenocarcinoma cohort (left). Scatter plot for correlation coefficient (x-axis) and FDR-corrected p-value for various cancer cohorts (right). c) Log ratio between high-impact SV and SNV frequency in different cancer cohorts. Error bars correspond to variation within the cohort. See also supplement Fig. S1.
Figure 2:
Figure 2:. Overall functional burdening of different genomic elements:
a) Percentage of genes in different gene categories affected by driver (grey band) and putative passenger (faded yellow band) LoFs compared to uniform background expectation (dashed black line). Data points in boxplot correspond to different tumor types. b) Heatmap showing enrichment (red color) and depletion (blue color) of motif gain (upper panel) and loss (bottom panel) events induced by putative passenger mutations for various TFs compared to a uniform genomic background. TFs highlighted in red are well-known cancer genes. c) Gain (positive alteration bias) and loss (negative alteration bias) of motif events observed among target genes (on x-axis) regulated by the ETS TF family. The green triangle denotes alteration bias on the pan-cancer level, whereas colored circles correspond to alteration bias for different cancer cohorts. The size of the circles corresponds to the frequency of motif-altering events. d) Q-Q plot showing genes that are differentially expressed due to gain-of-motif events in TFs belonging to the ETS TF family. e) Enrichment of germline and somatic large deletions that can engulf or partially delete coding regions and TF binding peaks. See also supplement Fig. S2.
Figure 3.
Figure 3.. Mutational signatures associated with different categories of impactful variants:
a) Mutation spectra associated with premature stops and TF binding motif-breaking events in the kidney-RCC cohort. b) Comparison of underlying signature distribution between high- and low-impact putative passengers in different cancer cohorts for a subset of signatures. For a given signature, the size of a dot corresponds to the percent increase or decrease in their contribution to describe high-impact mutations compared to low-impact mutations. Blue and red colored dots represent positive and negative signature differences, respectively. See also supplement Fig. S3.
Figure 4:
Figure 4:. Correlating functional burdening with subclonal information and patient survival:
a) Subclonal ratio (early/late) for different categories of SNVs (coding and non-coding) based on their impact scores. Subclonal ratios for high-impact SNVs occupying distinct gene sets. b) Mutant tumor allele heterogeneity difference comparison between high-, and low-impact SNVs for coding (top) and non-coding (bottom) regions. c) Correlation between mean VAF and GERP score of different categories of variants on a pan-cancer level. d) Survival curves in CLL (left panel) and RCC (right panel) with 95% confidence intervals, stratified by mean GERP score. See also supplement Fig. S4.
Figure 5.
Figure 5.. Conceptual classification of SNVs based on their functional impact and selection characteristics, and additive effects model:
a) In addition to canonical drivers, deleterious passengers (weak and strong) and mini drivers (weak and strong) represent additional categories of cancer mutations in the extended model. b) Additive effects model for putative passengers: The combined effect of many nominal passengers is modeled linearly and predicts whether a genotype arises from an observed cancer sample or from a null (neutral) model. c) Predictive power of known drivers and putative passengers using the additive effects model: (i) compares the maximum possible variance that can be explained using known drivers; (ii) further splits the variance into contributions from coding, non-coding, and promoter variants; (iii) presents normalized additive variance explained exclusively by putative passengers in coding regions, by promoters, and by other non-coding elements of the genome. See also supplement Fig. S5.

References

    1. 1000 Genomes Project Consortium, Auton A, Brooks LD, Durbin RM, Garrison EP, Kang HM, Korbel JO, Marchini JL, McCarthy S, McVean GA, et al. (2015). A global reference for human genetic variation. Nature 526, 68–74. - PMC - PubMed
    1. Alexandrov L, Kim J, Haradhvala NJ, Huang MN, Ng AWT, Boot A, Covington KR, Gordenin DA, Bergstrom E, Lopez-Bigas N, et al. (2018). The Repertoire of Mutational Signatures in Human Cancer. BioRxiv 322859.
    1. Alexandrov LB, Nik-Zainal S, Wedge DC, Aparicio S a J.R., Behjati S, Biankin AV, Bignell GR, Bolli N, Borg A, Borresen-Dale A-L, et al. (2013). Signatures of mutational processes in human cancer. Nature 500, 415–421. - PMC - PubMed
    1. Balasubramanian S, Fu Y, Pawashe M, McGillivray P, Jin M, Liu J, Karczewski KJ, MacArthur DG, and Gerstein M (2017). Using ALoFT to determine the impact of putative loss-of-function variants in protein-coding genes. Nat. Commun 8, 382. - PMC - PubMed
    1. Campbell PJ, Getz G, Stuart JM, Korbel JO, Stein LD, and Net, - ICGC/TCGA Pan-Cancer Analysis of Whole Genomes (2017). Pan-cancer analysis of whole genomes. BioRxiv 162784.

Publication types