. 2020 Apr 16;78(2):197-209.e7.
doi: 10.1016/j.molcel.2020.02.004. Epub 2020 Feb 20.

A Quantitative Genetic Interaction Map of HIV Infection

Affiliations

A Quantitative Genetic Interaction Map of HIV Infection

David E Gordon et al. Mol Cell. .

Abstract

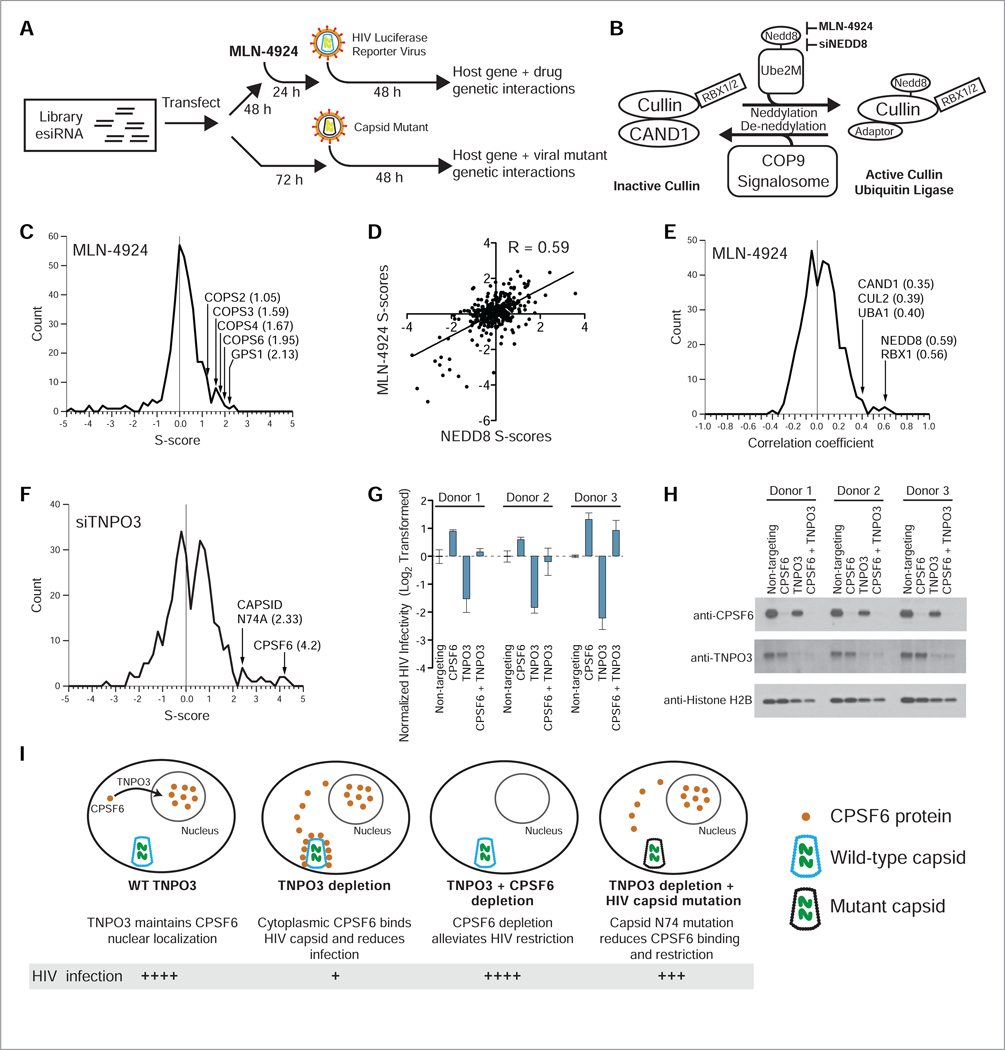
We have developed a platform for quantitative genetic interaction mapping using viral infectivity as a functional readout and constructed a viral host-dependency epistasis map (vE-MAP) of 356 human genes linked to HIV function, comprising >63,000 pairwise genetic perturbations. The vE-MAP provides an expansive view of the genetic dependencies underlying HIV infection and can be used to identify drug targets and study viral mutations. We found that the RNA deadenylase complex, CNOT, is a central player in the vE-MAP and show that knockout of CNOT1, 10, and 11 suppressed HIV infection in primary T cells by upregulating innate immunity pathways. This phenotype was rescued by deletion of IRF7, a transcription factor regulating interferon-stimulated genes, revealing a previously unrecognized host signaling pathway involved in HIV infection. The vE-MAP represents a generic platform that can be used to study the global effects of how different pathogens hijack and rewire the host during infection.

Keywords: CCR4-NOT; CNOT complex; IRF7; combinatorial genetics; epistasis map; host-pathogen network biology; innate immunity; interferon stimulated gene; vE-MAP; viral infection genetic screen.


Conflict of interest statement

Declaration of Interests The Krogan Laboratory has received research support from Vir Biotechnology and F. Hoffmann-La Roche. A.M. is a co-founder of Spotlight Therapeutics and Arsenal Therapeutics. A.M. serves on the scientific advisory board of PACT Pharma, is an advisor to Sonoma Biotherapeutics, and was a former advisor to Juno Therapeutics. The Marson laboratory has received sponsored research support from Juno Therapeutics, Epinomics, Sanofi, and a gift from Gilead.

Figures

Figure 1:
Figure 1:. An arrayed pipeline for studying genetic interactions impacting HIV infection.
A) The effect of pairwise knockdowns of human genes on HIV expression is measured using a high-throughput luciferase reporter system. Genetic interaction scores are calculated on the basis of luciferase signal normalized to cell count in each well. In the vast majority of wells, the normalized luciferase signal conforms to the expected combinatorial phenotype, indicating a lack of genetic interaction (neutral). In some wells, the luciferase signal is higher or lower than expected, indicating positive or negative genetic interactions, respectively. Genetic interaction profiles subjected to hierarchical clustering reveal functional gene modules. (B) Overview of the HIV vE-MAP pipeline: Cultured HeLa cells in each well are transfected with esiRNAs targeting two different genes and later infected with a HIV luciferase reporter virus. All combinations are analyzed in quadruplicate. Cell counts and HIV expression are measured by high-throughput microscopy and luminometry. (C and D) Typical library well behavior calculated across all plates ran in the HIV E-MAP, depicting single knockdown phenotypes for cell count (C) and cell count-corrected HIV luciferase expression (D). The 356 HIV-associated human gene knockdowns which passed our viability filter were utilized for vE-MAP analysis. See also Data S1 for pairwise knockdown vE-MAP data, and Figure S1 for esiRNA testing and library composition data.
Figure 2:
Figure 2:. The vE-MAP highlights known protein complexes.
(A and B) Clustering of HIV vE-MAP data highlights known human protein complexes. Genetic interaction scores (S-score) are visualized by a yellow (positive) to blue (negative) scale, and single knockdown phenotypes by a red (positive) to purple (negative) scale. (C and D) Genetic interaction clustering highlights structural submodules of the eIF3 complex (Wagner et al., 2016). (E) Enrichment of protein-protein interactions (Bioplex, Huttlin et al., 2017) as a function of correlation between genetic interaction profiles. This analysis indicates that genes with higher correlation in genetic interaction profiles are enriched for protein-protein interactions (PPIs).
Figure 3:
Figure 3:. The vE-MAP approach is amenable to small molecule and mutant virus queries.
(A) Small molecules may be introduced during the 72-hour knockdown period prior to addition of reporter virus. Alternatively, a mutant virus may be introduced instead of the wild-type reporter virus. (B) Graphical representation of the NEDD8 conjugation pathway regulating activity of Cullin ubiquitin ligases. (C) The neddylation inhibitor MLN-4924 displays positive genetic interactions with all five subunits of the COP9 signalosome run in the vE-MAP. (D) Comparison of S-score profiles of MLN-4924 and NEDD8 knockdown (Pearson correlation = 0.59). (E) The MLN-4924 genetic interaction profile displays high correlation with NEDD8 and the NEDD8-associated genes RBX1/ROC1, CAND1, CUL2 and UBA1. (F) TNPO3 displays positive genetic interactions with CPSF6 and the HIV capsid point mutant N74A. (G and H) Double CPSF6 and TNPO3 knockout in primary CD4+ T-cells harvested from three healthy donors. Error bars: standard deviation (n = 3). Western blotting shows reproducible combinatorial knockout in all donors tested. (I) Model for circumvention of TNPO3-dependency by depletion of CPSF6 or mutation of HIV capsid.
Figure 4:
Figure 4:. Components of the CNOT complex are required for HIV infection.
(A) All three CNOT subunits in the vE-MAP library co-cluster and interact negatively with HIV host-dependency factors including RNA transcriptional machinery, the RNA granule gene DDX3X, and the ESCRT components HGS and TSG101. (B) CNOT subunits 1, 2 and 3 display a large number of negative genetic interactions in the HIV vE-MAP. (C) Combinatorial knockout of CNOT1 with CCNT1 in primary T-cells demonstrates an additive decrease in infection in four independent donors (72 hours post infection). Error bars: standard deviation (n = 3). (D) Representative western blot validates combinatorial knockout of the CNOT1 large isoform and CCNT1. See also Figure S3 for full western blot data and validation of a second negative genetic interaction between CNOT2 and DDX3X. (E) Map illustrating CNOT1 large and small isoforms predicted by CNOT1 western blots and the human genome sequence. Exon 8 encodes four in-frame start codons downstream of the canonical translational start site; see also Figure S4. The CNOT10/11 binding domain is highlighted at the N-terminus. (F and G) Polyclonal knockout of the CNOT1 large isoform is sufficient to reduce HIV infection in primary CD4+ T-cells. Error bars: standard deviation (n = 3). (H) Knockout of the CNOT1 large isoform reduces enrichment of CNOT10 and CNOT11 following immunoprecipitation of total CNOT1 (IP antibody epitope shown in panel E). Error bars: standard error (n = 4). See also Table S3. (I and J) Polyclonal knockout of CNOT10 and 11 causes a ~10-fold decrease in HIV infection. Error bars: standard deviation (n = 3). Asterisk: likely nonspecific band. See also Figure S5 for HIV infection data for other CNOT subunit knockouts.
Figure 5:
Figure 5:. CNOT1, 10 and 11 are required to suppress interferon-stimulated genes in T-cells.
(A) Polyclonal knockouts of the CNOT1 large isoform and of CNOT10 were generated in CD4+ T-cells, and the impact on RNA transcripts determined via RNAseq (NT = non-targeting, Spearman correlation = 0.9429). See also Table S4. (B) Pathway analysis was used to profile genes upregulated by CNOT10 polyclonal knockout (FDR < 0.01, Log2FC ≥ 1). (C) Knockout of the CNOT1 large isoform, CNOT10 and CNOT11, but not CNOT2, causes a dramatic upregulation of the interferon stimulated gene IFIT1 in primary CD4+ T-cells (interferon alpha-2a treatment added to wild-type cells as a positive control). (D) The top 30 genes (Library) upregulated by CNOT10 knockout were targeted for polyclonal knockout in primary CD4+ T-cells (utilizing three individual guide RNAs per gene) in combination with CNOT10 knockout or interferon alpha-2a treatment. The reduction in HIV infection caused by CNOT10 knockout was reversed by knocking out the IRF7 gene with either one of two guide RNAs (IRF7 guide 1 and IRF7 guide 3). None of the library gene knockouts reverted the effect of IFN alpha-2a. See also Figure S7 and Table S5. (E) Schematic of the CNOT complex. The N-terminal region of CNOT1, CNOT10 and CNOT11 are required for suppression of interferon stimulated genes.

References

    1. Ahle S, Mann A, Eichelsbacher U, and Ungewickell E (1988). Structural relationships between clathrin assembly proteins from the Golgi and the plasma membrane. EMBO J. 7, 919–929. - PMC - PubMed
    1. Andrews S FastQC. Bioinformatics.babraham.ac.uk.
    1. Aronesty E (2011). EA-Utils: Command-line tools for processing biological sequencing data. Code.Google.com.
    1. Bassik MC, Lebbink RJ, Churchman LS, Ingolia NT, Patena W, LeProust EM, Schuldiner M, Weissman JS, and McManus MT (2009). Rapid creation and quantitative monitoring of high coverage shRNA libraries. Nat. Methods 6, 443–445. - PMC - PubMed
    1. Batra J, Hultquist JF, Liu D, Shtanko O, Dollen, Von J,Satkamp L, Jang GM, Luthra P, Schwarz TM, Small GI, et al. (2018). Protein Interaction Mapping Identifies RBBP6 as a Negative Regulator of Ebola Virus Replication. Cell 175, 1917–1930.e13. - PMC - PubMed

Publication types

MeSH terms