. 2020 Feb 20;180(4):717-728.e19.
doi: 10.1016/j.cell.2020.01.023.

A Metabolic Pathway for Activation of Dietary Glucosinolates by a Human Gut Symbiont

Affiliations

A Metabolic Pathway for Activation of Dietary Glucosinolates by a Human Gut Symbiont

Catherine S Liou et al. Cell. .

Abstract

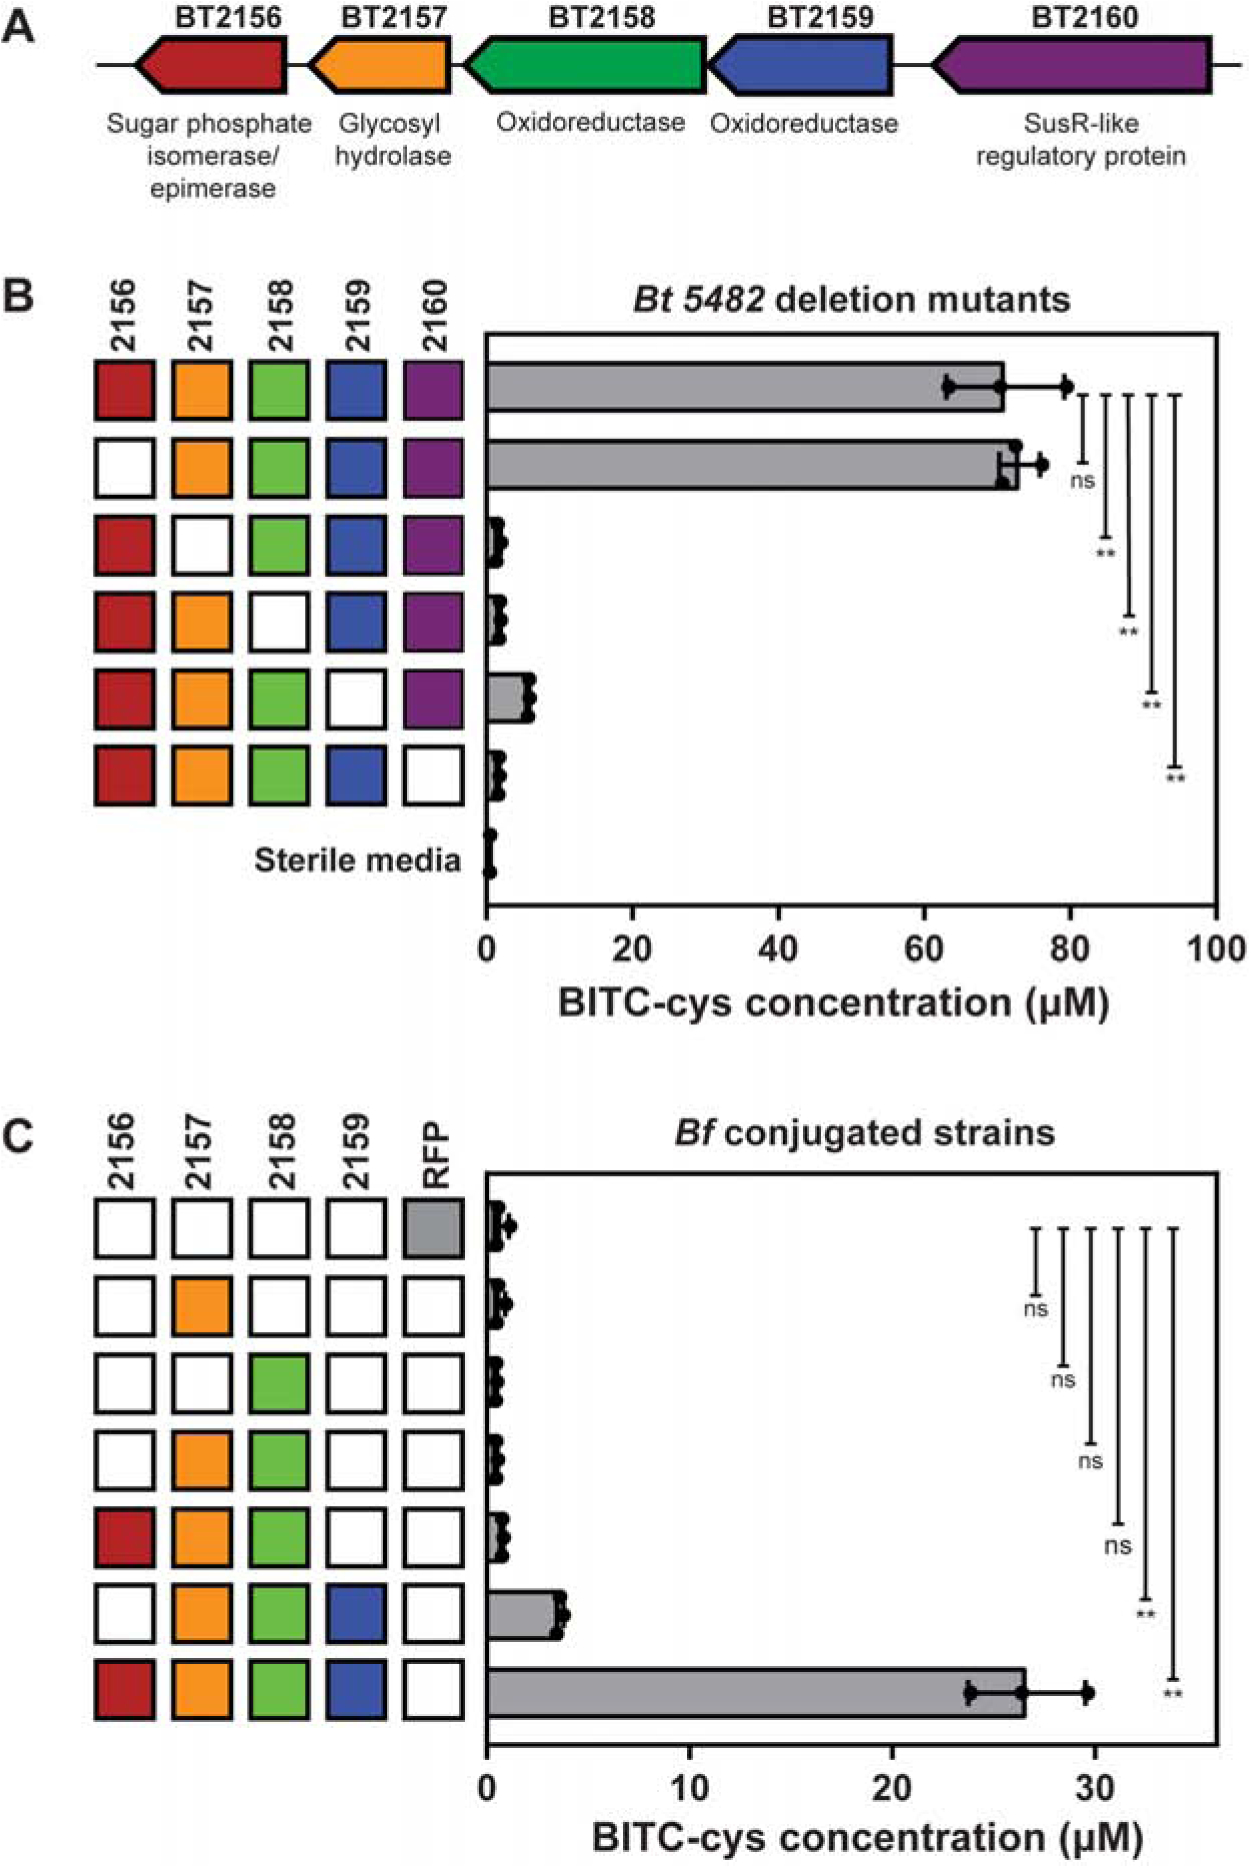
Consumption of glucosinolates, pro-drug-like metabolites abundant in Brassica vegetables, has been associated with decreased risk of certain cancers. Gut microbiota have the ability to metabolize glucosinolates, generating chemopreventive isothiocyanates. Here, we identify a genetic and biochemical basis for activation of glucosinolates to isothiocyanates by Bacteroides thetaiotaomicron, a prominent gut commensal species. Using a genome-wide transposon insertion screen, we identified an operon required for glucosinolate metabolism in B. thetaiotaomicron. Expression of BT2159-BT2156 in a non-metabolizing relative, Bacteroides fragilis, resulted in gain of glucosinolate metabolism. We show that isothiocyanate formation requires the action of BT2158 and either BT2156 or BT2157 in vitro. Monocolonization of mice with mutant BtΔ2157 showed reduced isothiocyanate production in the gastrointestinal tract. These data provide insight into the mechanisms by which a common gut bacterium processes an important dietary nutrient.

Keywords: Bacteroides thetaiotaomicron; glucosinolate; gut microbe; isothiocyanate; myrosinase; phytonutrient.


Conflict of interest statement

Declaration of Interests The authors declare no competing interests.

Figures

Figure 1.
Figure 1.. Activation of glucosinolates (GSs) to isothiocyanates (ITCs) by microbial myrosinases
(A) Reaction scheme for the conversion of GSs to ITCs by myrosinases (B) Metabolic fates of microbially produced ITCs (benzyl ITC (BITC) derived from glucotropaeolin (BGS), shown) in culture media or host urine. ITC in media was measured as ITC-cysteine, derived from in situ conjugation with cysteine in the media. ITC in urine was measured as the N-acetyl cysteine conjugate, an excreted product in mercapturic acid metabolism of ITC (Hwang and Jeffery, 2003). (C) Benzyl ITC cysteine conjugate (BITC-cys) concentrations in culture supernatant, produced from BGS by Bacteroides strains grown in rich media for 24 hours. Bars represent the mean ± SD of three biological replicates, with individual replicates overlaid. Multiple reaction monitoring (MRM) by liquid chromatography with tandem mass spectrometry (LC-MS/MS) was used to track the transition of protonated BITC-cys with m/z 271.0 to a product ion with m/z 122.0.
Figure 2.
Figure 2.. An operon necessary for GS conversion to ITCs in B. thetaiotaomicron (Bt)
(A) The operon involved in GS metabolism in Bt. Predicted functions based on homology are annotated below each gene. (B) BITC-cys concentrations in culture supernatant of Bt mutants with single deletions in the BT2160-BT2156 operon grown in rich media with BGS for 30 hours. Filled boxes represent natively expressed genes, while empty boxes represent deleted genes. Bars represent the mean±SD of three biological replicates, with individual replicates overlaid. BITC-cys background in sterile media is shown on the bottom-most row. Significant differences from wild-type Bt are marked by ns (not significant) or ** (p<0.0001), as determined using Dunnett’s multiple comparison test. (C) BITC-cys concentrations in culture supernatant of B. fragilis (Bf) strains expressing subsets of BT2159-BT2156 after 30 hours of growth in rich media with BGS. Filled boxes represent extra-chromosomally complemented genes. Bars represent the mean±SD of three biological replicates, with individual replicates overlaid. Significant differences from the RFP expressing negative control strain are marked by ns or **(p<0.0001). See also Figures S1–S2 and Table S1.
Figure 3.
Figure 3.. In vitro GS conversion by recombinant proteins
(A) Extracted ion chromatograms (EIC) of BGS (m/z 408.0428) and BITC-cys (m/z 271.0570) produced by different combinations of BT2159-BT2156 proteins in vitro, shown on the same scale. The first row of chromatograms represents BGS and BITC-cys standards. Data shown represent the mean of three replicates, with the shaded regions representing one standard deviation. (B) Direct injection mass spectrometry (MS) EIC showing glucose release (m/z 179.0561), substrate consumption (glucoraphanin (GRP): m/z 436.0411; glucobrassicin (GBR): m/z 447.0538), and ITC (sulforaphane (SFN): m/z 178.0355) production over time by different combinations of BT2159-BT2156 proteins. The ion count corresponding to a known reference SFN concentration is represented by a dotted line. No corresponding ITC was observed for GBR. Substrate ion count was normalized against the initial ion count for each combination of proteins. Data shown is one replicate, representative of triplicate results. (C) Direct injection MS EIC showing glucose release (m/z 179.0561) and substrate consumption (m/z 341.1089) over time by different combinations of BT2159-BT2156 proteins with cellobiose and maltose. Substrate ion count was normalized against the initial ion count for each combination of proteins. Data shown is one replicate, representative of triplicate results. See also Figure S3.
Figure 4.
Figure 4.. Monocolonization of gnotobiotic mice with mutant Bt
(A) Schematic for colonization, dosing schedule, and collection of urine and feces. Each mark in the dosing schedule corresponds to an interval of 24 hours. Numbers in the unfilled shapes represent the dose within that series. Sample collection timepoints for colonization density measurements (Fig. S5B) are marked with red arrows. (B) Sulforaphane N-acetyl cysteine (SFN-NAC), SFN-cys mercapturic acid conjugates, and GRP excreted in urine six hours after broccoli meals containing GRP. Creatinine-normalized quantities are shown in Fig. S5D. The ion counts corresponding to a known reference concentrations are represented by dotted lines. Metabolites were measured by LC-MS/MS and quantified by MRM (SFN-NAC: m/z 341.1→ m/z 177.9; SFN-cys: m/z 299.1→ m/z 136; GRP: m/z 436.0→ m/z 372). n=5 for each colonized group and time point unless otherwise noted on the graph. ** represents significance with p<0.01 from the germ-free control at the corresponding time point. * represents significance with p<0.05. Statistical groups were determined using the Tukey test. (C) SFN-cys and GRP in feces collected six hours after broccoli meals containing GRP. SFN-cys was the product of in situ conjugation of SFN with exogenous cysteine. Bars represent the mean values for each group, with individual data overlaid (different shapes correspond to individual mice). See also Figure S4.
Figure 5.
Figure 5.. Metagenomic and transcriptomic prevalence of BT2160-BT2156
Solid bars represent the fraction of subjects in metagenomic stool cohorts containing all five genes in the operon, with gene presence defined as a coverage of ≥50%. Cross-hatched bars represent the fraction of subjects in the metatranscriptomic cohort containing BT2159-BT2156, of the total subjects with the BT2160-BT2156 in the paired metagenome. The total number of subjects in a cohort is denoted on the right of each bar. See also Figure S5.

Comment in

References

    1. Abu-Ali GS, Mehta RS, Lloyd-Price J, Mallick H, Branck T, Ivey KL, Drew DA, Dulong C, Rimm E, Izard J, et al. (2018). Metatranscriptome of human faecal microbial communities in a cohort of adult men. Nat. Microbiol 3, 356–366. - PMC - PubMed
    1. Agerbirk N, De Vos M, Kim JH, and Jander G (2009). Indole glucosinolate breakdown and its biological effects. Phytochem. Rev 8, 101–120.
    1. Albaser A, Kazana E, Bennett MH, Cebeci F, Luang-In V, Spanu PD, and Rossiter JT (2016). Discovery of a Bacterial Glycoside Hydrolase Family 3 (GH3) β-Glucosidase with Myrosinase Activity from a Citrobacter Strain Isolated from Soil. J. Agric. Food Chem 64, 1520–1527. - PubMed
    1. Angelino D, Dosz EB, Sun J, Hoeflinger JL, Van Tassell ML, Chen P, Harnly JM, Miller MJ, and Jeffery EH (2015). Myrosinase-dependent and -independent formation and control of isothiocyanate products of glucosinolate hydrolysis. Front. Plant Sci 6, 831. - PMC - PubMed
    1. Armah CN, Derdemezis C, Traka MH, Dainty JR, Doleman JF, Saha S, Leung W, Potter JF, Lovegrove JA, and Mithen RF (2015). Diet rich in high glucoraphanin broccoli reduces plasma LDL cholesterol: Evidence from randomised controlled trials. Mol. Nutr. Food Res 59, 918–926. - PMC - PubMed

Publication types