. 2020 Mar 9;52(5):591-604.e6.
doi: 10.1016/j.devcel.2020.01.025. Epub 2020 Feb 20.

Autophagic Degradation of NBR1 Restricts Metastatic Outgrowth during Mammary Tumor Progression

Affiliations

Autophagic Degradation of NBR1 Restricts Metastatic Outgrowth during Mammary Tumor Progression

Timothy Marsh et al. Dev Cell. .

Abstract

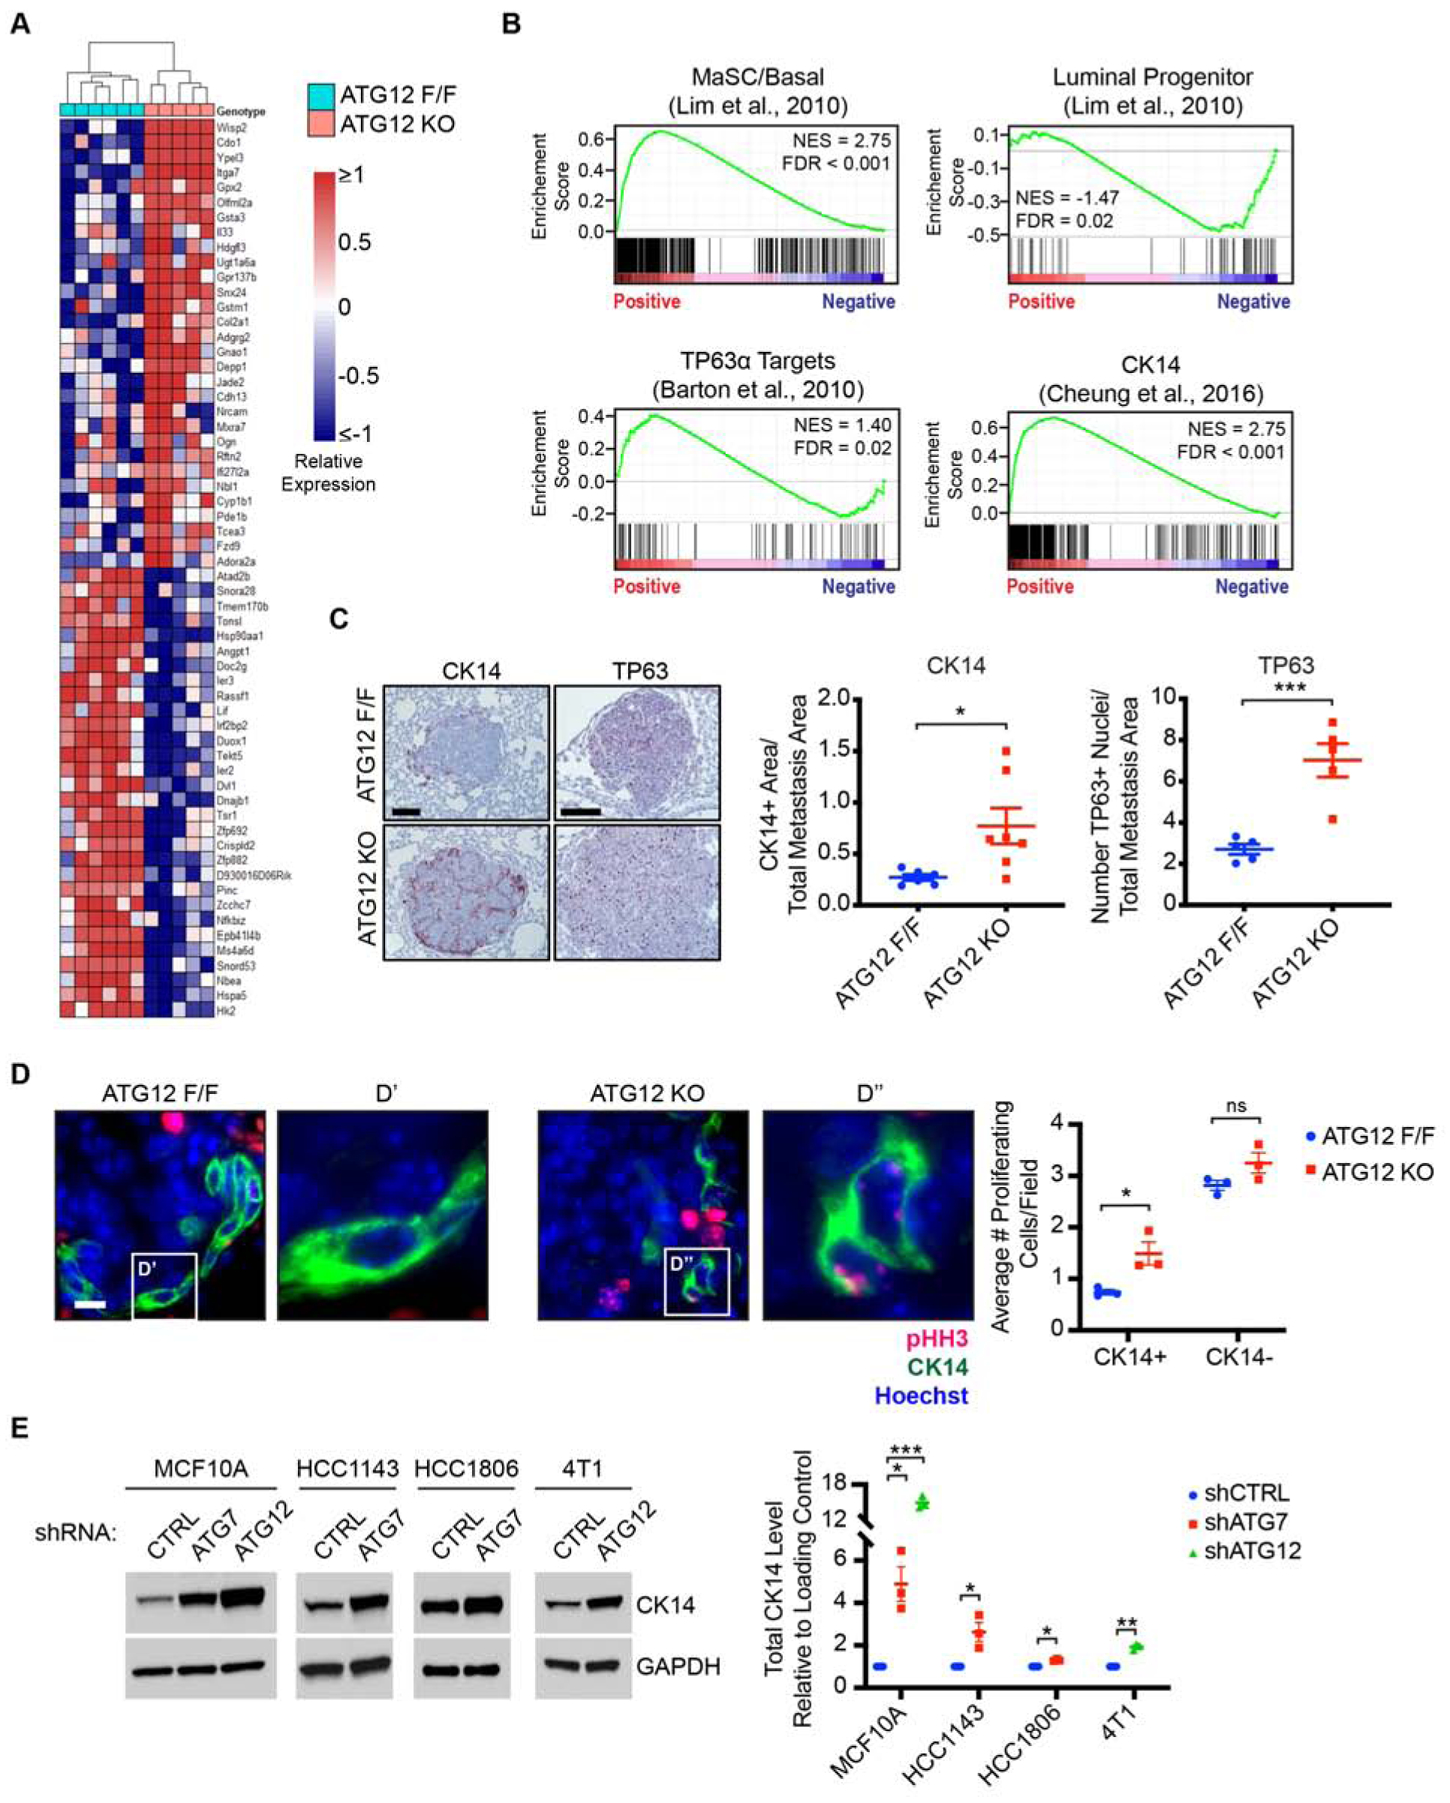
Although autophagy is being pursued as a therapeutic target in clinical oncology trials, its effects on metastasis, the principal cause of cancer mortality, remain unclear. Here, we utilize mammary cancer models to temporally delete essential autophagy regulators during carcinoma progression. Though genetic ablation of autophagy strongly attenuates primary mammary tumor growth, impaired autophagy promotes spontaneous metastasis and enables the outgrowth of disseminated tumor cells into overt macro-metastases. Transcriptomic analysis reveals that autophagy deficiency elicits a subpopulation of otherwise luminal tumor cells exhibiting basal differentiation traits, which is reversed upon preventing accumulation of the autophagy cargo receptor, Neighbor to BRCA1 (NBR1). Furthermore, pharmacological and genetic induction of autophagy suppresses pro-metastatic differentiation and metastatic outgrowth. Analysis of human breast cancer data reveal that autophagy gene expression inversely correlates with pro-metastatic differentiation signatures and predicts overall and distant metastasis-free survival. Overall, these findings highlight autophagy-dependent control of NBR1 as a key determinant of metastatic progression.

Keywords: Keratin14; NBR1; Rubicon; TP63; autophagy; breast cancer; chloroquine; metastasis.


Conflict of interest statement

Declaration of Interests J.D. is a scientific advisory board member for Vescor Therapeutics, LLC. Z.W. is a scientific advisory board member for Maverick Therapeutics, Inc.

Figures

Figure 1.
Figure 1.. Tumor Cell Autophagy Restricts Macro-metastatic Outgrowth of DTCs.
(A) Schematic of experimental design. (B) Representative hematoxylin and eosin staining of lungs bearing metastases for indicated groups. Scale bar = 1 mm. (C) Quantification of average metastatic size for indicated genotypes. Two pooled independent experiments. ATG12F/F (n=7 mice), ATG12KO (n=8), ATG5F/F (n=8), ATG5KO (n=9). (D) Immunoblot of macro-dissected metastases from indicated genotypes at endpoint for the ATG12–5 complex, LC3 and GAPDH. (E) Left, representative immunofluorescent staining of P62 (green) and nuclei (Hoechst, blue). Scale bar = 10 μm. Right, quantification of P62 aggregates normalized to number of cells. Number of metastases analyzed, ATG12F/F (n=34), ATG12KO (n=34). (F) Histological groups of Micro- (1), Intermediate (2), and Macro- (3) metastatic lesions. Scale bar = 100 μm. (G) Quantification of percent total metastases within indicated histological groups in (C) at endpoint. (H) Representative immunofluorescent staining of phospho-histone H3 positive metastatic tumor cells (pHH3, red) and nuclei (Hoechst, blue). Metastases outlined with dashed line (yellow). Scale bar = 20 μm. (I) Quantification of nuclei positive for pHH3 normalized to metastatic lesion area for indicated timepoints. N=3/genotype. (J) Quantification of average metastatic size for indicated shRNAs in R221a and 4T1 cells. R221a, three pooled independent experiments. shCTRL (n=20 mice), shATG7 (n=19). 4T1, one experiment. shCTRL (n=7 mice), shATG12 (n=8). Statistics: t-test (C)(E)(G, Micro-ATG5, Macro-ATG12, Macro-ATG5)(I)(J, 4T1), Mann-Whitney (G, Micro-ATG12)(J, R221a). Data are represented by mean ± S.E.M. Each dot represents 1 animal. ns = not significant. *p<0.05, **p<0.01, ***p<0.001. See also Figure S1.
Figure 2.
Figure 2.. Tumor Cell Autophagy Restricts Basal Differentiation Transcriptional Programs and Proliferation During Metastasis.
(A) Heatmap of top 30 differentially expressed genes (ranked by p-value) between ATG12F/F and ATG12KO metastases (scale indicates log2 transformed and median centered expression, p-value < 0.005). ATG12F/F (n= 6 mice), ATG12KO (n=5). (B) Gene set enrichment analyses in ATG12KO relative to ATG12F/F metastases. (C) Left, representative immunohistochemical staining of CK14 (red), TP63 (red), and counterstained with hematoxylin (blue) from animals in Figure 1C. Scale bar = 100 μm. Right, quantification of CK14 and TP63 staining area normalized to metastasis area. CK14; ATG12F/F (n=6 mice), ATG12KO (n=7). TP63; ATG12F/F (n=5), ATG12KO (n=5). (D) Left, representative immunofluorescent staining of proliferating metastatic tumor cells (pHH3, red), CK14 (green) and nuclei (Hoechst, blue) from 2-week group in Figure 1I. Scale bar = 10 μm. Right, quantification of average proliferating cells/field for CK14+ and CK14− populations in indicated genotypes. 17–21 optical fields/animal. (E) Left, immunoblots of CK14 and GAPDH in MCF10A, HCC1143, HCC1806 and 4T1 cells with indicated shRNAs. Right, quantification of CK14 normalized to GAPDH in triplicate. Statistics: DESeq2 (A), false-discovery rate (B), t-test (C)(D)(E). Data represented by mean ± S.E.M. Each dot represents 1 animal or biological replicate. ns = not significant. *p<0.05, **p<0.01, ***p<0.001. See also Figure S2
Figure 3.
Figure 3.. Tumor Cell Autophagy Promotes Orthotopic Primary Mammary Tumor Formation.
(A) Tumor growth kinetics for indicated genotypes. One experiment for ATG12, three pooled experiments for ATG5. (B) Tumor weight at endpoint for indicated genotypes from animals in (A). (C) Immunoblots of primary tumors from indicated genotypes at endpoint for the ATG12-ATG5 complex, LC3 and GAPDH. (D) Representative images of primary tumors stained for CK14 (red), CK5 (red) and counterstained with hematoxylin (blue). Inset, adjacent normal mammary duct. Scale bar = 100 μm. (E) Representative images of primary tumors stained for CK14, Vimentin, Fibronectin, TP63, ΔN-TP63 (red), and counterstained with hematoxylin (blue). Inset, top – adjacent normal mammary duct. Inset, bottom – increased magnification. Scale bar = 100 μm. (F) Left, representative immunofluorescent staining of proliferating primary tumor cells (pHH3, red), CK14 (green) and nuclei (Hoechst, blue) from (A). Scale bar = 20 μm. Middle, quantification of average proliferating cells/field for CK14+ and CK14− populations in indicated genotypes. 7–11 optical fields/animal. Right, quantification of percent total proliferating cells that express CK14 at indicated tumor sites for specified genotypes. Statistics: t-test (A)(B, ATG12)(F), Mann-Whitney (B, ATG5). Data represented by mean ± S.E.M. Each dot represents 1 animal. *p<0.05, **p<0.01, ***p<0.001. See also Figure S3 and S4.
Figure 4.
Figure 4.. Tumor Cell Autophagy Restricts Local and Metastatic Recurrence Following Primary Tumor Excision.
(A) Schematic of experimental design. (B) PyMT tumor growth kinetics for indicated genotypes. Two pooled independent experiments for ATG12, and one experiment for ATG5. (C) Incidence of primary tumor recurrence and metastasis for indicated genotypes from animals in (B). (D) Left, Quantification of average metastatic number for animals of indicated genotypes without primary tumor recurrence. ATG12F/F (n=7 mice), ATG12KO (n=7), ATG5F/F (n=5), ATG5KO (n=5). Right, representative hematoxylin and eosin staining of lung metastases for indicated genotypes. Scale bar = 2 mm. (E) 4T1 tumor growth kinetics for indicated shRNAs. Two pooled independent experiments. (F) Quantification of average 4T1 metastatic number for animals of indicated shRNAs. shCTRL (n=12 mice), shATG12 (n=13). (G) Quantification of CK14 staining area normalized to metastasis area for indicated shRNAs. shCTRL (n=6 mice); shATG12 (n=7). Statistics: t-test (B)(E)(F), Mann-Whitney (G). Data are represented by mean ± S.E.M. Each dot represents 1 animal. *p<0.05, **p<0.01, ***p<0.001.
Figure 5.
Figure 5.. NBR1 Is Required for Metastatic Outgrowth and Basal Differentiation Upon Tumor Cell Autophagy Inhibition.
(A) Immunoblots for autophagy cargo receptors in autophagy-deficient and -competent primary and R221a PyMT cells of indicated genotypes and shRNAs, respectively. (B) Quantification of autophagy cargo receptor protein levels normalized to GAPDH in autophagy-deficient cells relative to autophagy-competent cells from (A). Three pooled independent experiments. (C) Quantification of average metastatic size for empty vector (EV, n=16 mice) or P62-overexpressing (n=18) R221a cells. Two pooled independent experiments. (D) Quantification of average metastatic size for empty vector (EV, n=15 mice) or NBR1-overexpressing (n=15) R221a cells. Two pooled independent experiments. (E) Quantification of average metastatic size for indicated shRNAs in R221a cells. Two pooled independent experiments. shCTRL (n=12 mice), shNBR1#1 (n=8), shNBR1#2 (n=10). (F) Quantification of average metastatic size for indicated shRNAs in R221a cells. Three pooled independent experiments. shCTRL (n=15 mice); shATG7 (n=17); shATG7, shNBR1 (n=16). (G) Quantification of average metastatic size for indicated shRNAs in 4T1 cells. One experiment. shCTRL (n=7 mice); shATG12 (n=6); shATG12, shNBR1 (n=7). (H) Representative whole lung images after inoculation with R221a cells expressing indicated shRNAs. Scale bar = 2 mm. (I) Representative images of CK14 staining in R221a metastases for indicated shRNAs. Metastases are outlined with dashed line (black). Scale bar = 100 μm. (J) Quantification of CK14 staining area normalized to R221a metastasis area for indicated shRNAs. shCTRL (n=8 mice); shATG7 (n=9); shATG7, shNBR1 (n=8). Statistics: t-test (B)(C), Mann-Whitney (D), ANOVA with Dunn’s post-hoc test (E)(F) or Tukey’s post-hoc test (G)(J). Data are represented by mean ± S.E.M. Each dot represents 1 animal or biological replicate. ns = not significant. *p<0.05, **p<0.01, ***p<0.001. See also Figure S5.
Figure 6.
Figure 6.. Autophagy-Specific Genes Correlate with MaSC/Basal and TP63 Target Gene Expression Signatures.
Best-fit line and Pearson correlations between mean autophagy-specific gene expression in primary tumors and MaSC/Basal and TP63 Targets gene expression signatures for indicated PAM50 subtypes from TCGA datasets. The complete list of autophagy genes analyzed is listed in Table S1. Statistics: F-test.
Figure 7.
Figure 7.. Clinical Correlates in Human Breast Cancer and Autophagy Induction in Mice.
(A) Kaplan-Meier plot of overall survival (OS; n=626) and distant metastasis-free survival (DMFS; n=664) probability in breast cancer patients stratified by high (red) and low (black) primary tumor mean expression of autophagy genes (ATG). Complete list of autophagy genes analyzed in Table S1. (B) Schematic of experimental design. (C) Quantification of average metastatic size for indicated treatments utilizing primary PyMT cells. Vehicle (n=6 mice), Chloroquine (CQ, n=6). (D) Quantification of CK14 staining area normalized to metastasis area for indicated treatments. Vehicle (n=5 mice), Chloroquine (n=5). (E) Representative whole lung images for indicated treatments. Scale bar = 2 mm. (F) Quantification of average metastatic size for indicated treatments utilizing primary PyMT cells. Vehicle (n=5 mice), Rapamycin (RAP, n=5). (G) Quantification of CK14 staining area normalized to metastasis area for indicated treatments. Vehicle (n=5 mice), Rapamycin (n=5). (H) Quantification of average metastatic size for indicated shRNAs in R221a cells. Two pooled independent experiments. shCTRL (n=10 mice); shRUBCN (n=11); shATG7, shRUBCN (n=7). (I) Quantification of CK14 staining area normalized to metastasis area for indicated shRNAs. shCTRL (n=4 mice); shRUBCN (n=4); shATG7, shRUBCN (n=4). (J) Representative whole lung images for indicated genotypes. Scale bar = 2 mm. Statistics: Log-rank test (A), t-test (C)(D)(G), Mann-Whitney (F), ANOVA with Tukey’s post-hoc test (H)(I). Data are represented by mean ± S.E.M. Each dot represents 1 animal. ns = not significant. *p<0.05, **p<0.01, ***p<0.001. See also Figure S6.

Comment in

References

    1. Barton CE, Johnson KN, Mays DM, Boehnke K, Shyr Y, Boukamp P, and Pietenpol JA (2010). Novel p63 target genes involved in paracrine signaling and keratinocyte differentiation. Cell Death Dis 1, e74. - PMC - PubMed
    1. Bray NL, Pimentel H, Melsted P, and Pachter L (2016). Near-optimal probabilistic RNAseq quantification. Nat Biotechnol 34, 525–527. - PubMed
    1. Cameron MD, Schmidt EE, Kerkvliet N, Nadkarni KV, Morris VL, Groom AC, Chambers AF, and MacDonald IC (2000). Temporal progression of metastasis in lung: cell survival, dormancy, and location dependence of metastatic inefficiency. Cancer Res 60, 2541–2546. - PubMed
    1. Cheung KJ, Gabrielson E, Werb Z, and Ewald AJ (2013). Collective invasion in breast cancer requires a conserved basal epithelial program. Cell 155, 1639–1651. - PMC - PubMed
    1. Cheung KJ, Padmanaban V, Silvestri V, Schipper K, Cohen JD, Fairchild AN, Gorin MA, Verdone JE, Pienta KJ, Bader JS, et al. (2016). Polyclonal breast cancer metastases arise from collective dissemination of keratin 14-expressing tumor cell clusters. Proc Natl Acad Sci U S A 113, E854–863. - PMC - PubMed

Publication types

Substances