. 2020 Mar 10;14(3):390-405.
doi: 10.1016/j.stemcr.2020.01.010. Epub 2020 Feb 20.

Knocking out C9ORF72 Exacerbates Axonal Trafficking Defects Associated with Hexanucleotide Repeat Expansion and Reduces Levels of Heat Shock Proteins

Affiliations

Knocking out C9ORF72 Exacerbates Axonal Trafficking Defects Associated with Hexanucleotide Repeat Expansion and Reduces Levels of Heat Shock Proteins

Masin Abo-Rady et al. Stem Cell Reports. .

Abstract

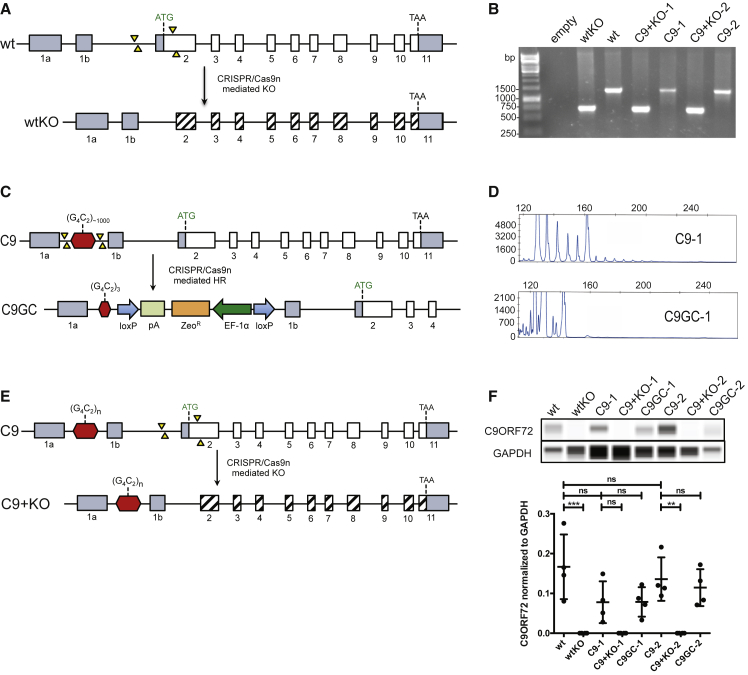
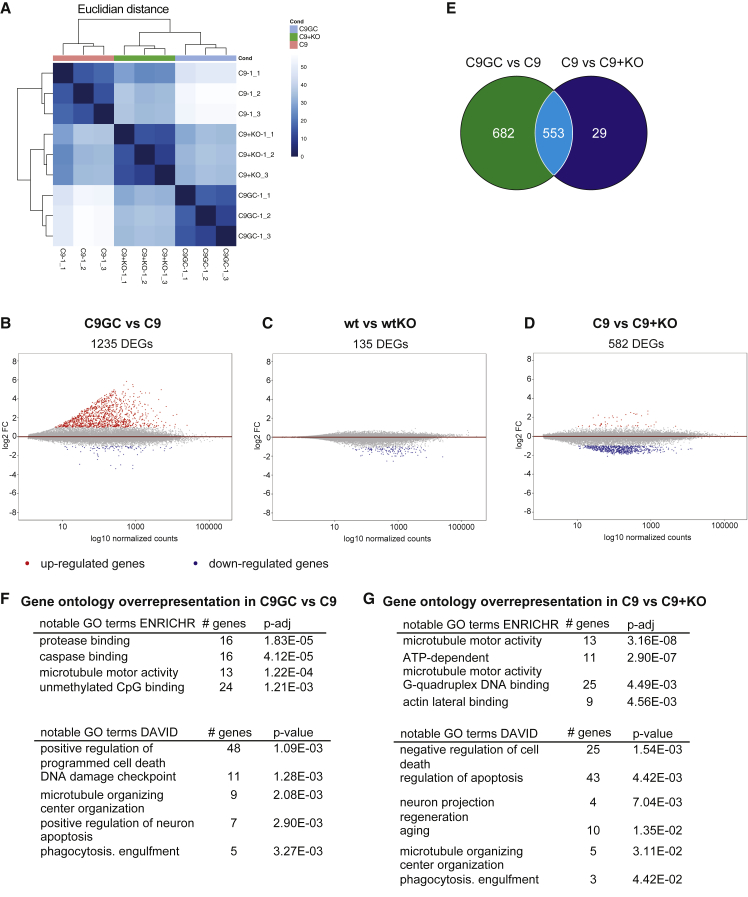
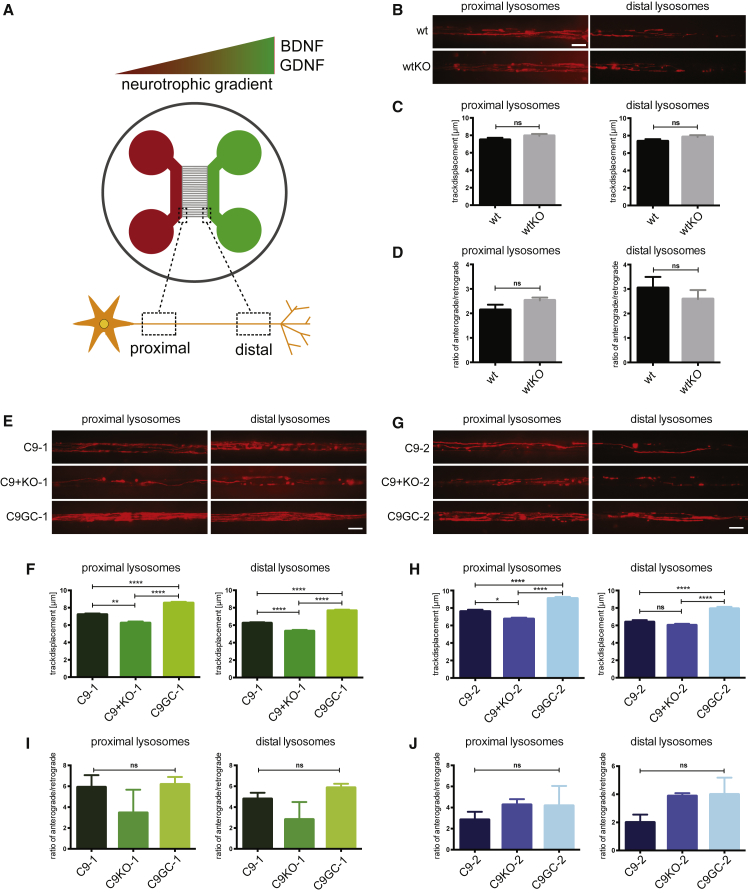
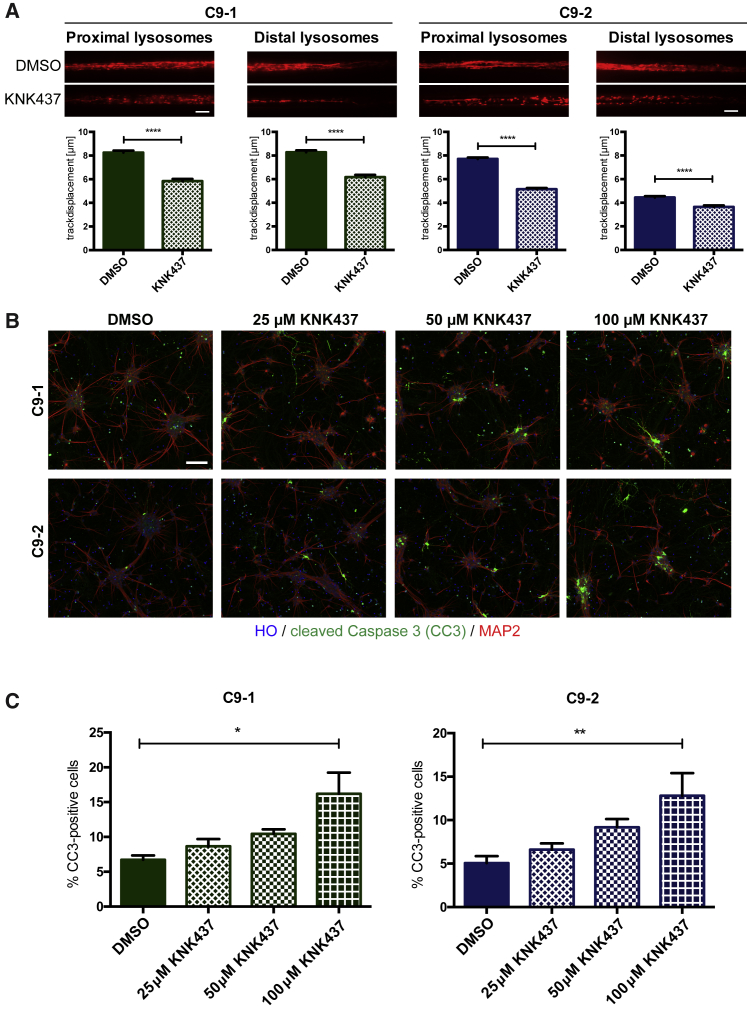
In amyotrophic lateral sclerosis (ALS) motor neurons (MNs) undergo dying-back, where the distal axon degenerates before the soma. The hexanucleotide repeat expansion (HRE) in C9ORF72 is the most common genetic cause of ALS, but the mechanism of pathogenesis is largely unknown with both gain- and loss-of-function mechanisms being proposed. To better understand C9ORF72-ALS pathogenesis, we generated isogenic induced pluripotent stem cells. MNs with HRE in C9ORF72 showed decreased axonal trafficking compared with gene corrected MNs. However, knocking out C9ORF72 did not recapitulate these changes in MNs from healthy controls, suggesting a gain-of-function mechanism. In contrast, knocking out C9ORF72 in MNs with HRE exacerbated axonal trafficking defects and increased apoptosis as well as decreased levels of HSP70 and HSP40, and inhibition of HSPs exacerbated ALS phenotypes in MNs with HRE. Therefore, we propose that the HRE in C9ORF72 induces ALS pathogenesis via a combination of gain- and loss-of-function mechanisms.

Keywords: C9ORF72; HSP40; HSP70; amyotrophic lateral sclerosis; axonal trafficking; disease modeling; gene editing; heat shock proteins; induced pluripotent stem cells.


Figures

Figure 1
Figure 1
Generation of Isogenic iPSC Lines (A) Strategy for targeting C9ORF72 to knockout C9ORF72 protein production in WT iPSCs (wtKO). Quadruple Cas9-nickase (Cas9n) introduced two double-strand breaks (yellow arrows). (B) PCR confirmed the deletion in KO iPSC lines. (C) Strategy for gene correction by reducing HRE to WT length of three repeats. (D) Repeat-primed PCR confirmed absence of HRE in C9GC lines. (E) Scheme of KO deletion in iPSCs with HRE in C9ORF72 (C9 + KO). (F) Capillary electrophoresis confirmed loss of C9ORF72 protein in KO cells. Note that no significant differences between C9-1 and C9-1 in comparison with WT were not significant. N = 4 biological replicates. All values are presented as mean ± SEM. One-way ANOVA showed p < 0.05. Tukey's post-test for multiple comparisons was performed (**p < 0.01, ***p < 0.001). See also Figures S1–S3.
Figure 2
Figure 2
Differentiation of iPSCs into Functional MNs (A) Differentiation scheme. (B) MNs express the neuronal marker MAP2 (green) and the MN markers Islet1 (red) and SMI32 (cyan). Scale bar, 100 μm. (C) MN differentiation efficiency is comparable between all cell lines (n = 3 biological replicates). One-way ANOVA showed no statistical significance. (D–F) Representative voltage-gated sodium inward and potassium outward currents of an MN recorded in whole-cell voltage-clamp mode (D). Peak sodium currents INa at maximal amplitude (E) and (F) at −40 mV holding potential. (G) Recording of a C9GC-1 MN spiking repetitive spontaneous action potentials (APs). (H and I) Number of spontaneously active MNs (H) and their AP frequency is significantly higher in C9GC-1 than C9-1 MNs (I). (J) A C9GC-1 MN firing multiple APs upon depolarization in the current-clamp mode. (K and L) The number of MNs with multiple elicited APs (K) and the maximal amplitudes of elicited APs were most pronounced in C9GC-1 cells (L). A minimum of n = 32 cells was measured per line. All values are presented as mean ± SEM. Statistical analysis was performed using one-way ANOVA followed by Tukey's post-test for multiple comparisons (p < 0.05, ∗∗p < 0.01). See also Figures S4 and S5.
Figure 3
Figure 3
Transcriptome Analysis of Isogenic MNs (A) Heatmap and hierarchical clustering of transcriptome results from the indicated MNs. (B–D) MA plots depict significantly (p < 0.05) upregulated (red) and downregulated genes (blue). (B) shows C9GC versus C9, (C) shows wt versus wtKO, and (D) shows C9 versus C9 + KO. (E) Venn diagram shows numbers of differentially expressed genes (DEGs) between C9GC versus C9 MNs (green), between C9 versus C9 + KO MNs (blue), and the overlap of both comparisons (cyan). (F and G) Gene ontology studies on DEGs between (F) C9GC versus C9 and (G) C9 versus C9 + KO using ENRICHR (top) and DAVID (bottom). See also Figure S6.
Figure 4
Figure 4
Axonal Trafficking Is Altered by the HRE and Loss of C9ORF72 (A) Schematic representation of microfluidic chambers used for live-cell imaging. (B) Maximum projection for WT and wtKO MNs of 400 frames acquired within a 2-min movie. Higher signal correlates with longer track displacement. Scale bar, 10 μm. (C and D) Quantification shows (C) track displacement of lysosomes in μm and (D) direction of trafficking. N = 3 biological replicates; >1,000 lysosomes were analyzed per cell line and per side for all experiments. (E) Maximum projection for C9-1 MNs. Scale bar, 10 μm. (F) Quantification shows track displacement of C9-1 lysosomes in μm. (G) Maximum projection for C9-2 MNs. Scale bar, 10 μm. (H) Quantification shows track displacement of C9-2 lysosomes in μm. (I and J) Quantification of direction of lysosomal trafficking. N = 3 biological replicates; >1,000 lysosomes were analyzed per cell line and per side for all experiments. Lysosome trafficking results are shown in (I) for C9-1, C9KO-1, and C9GC-1, and in (J) for C9-2, C9KO-2, and C9GC-2. All values are presented as mean ± SEM. One-way ANOVA followed by Tukey's post-test for multiple comparisons was performed (∗∗p < 0.01, ∗∗∗p < 0.001, ∗∗∗∗p < 0.0001). Tracks were shorter at the distal axon end than on the proximal compartment, consistent with dying-back.
Figure 5
Figure 5
HRE + C9ORF72 KO Neurons Show Increased Apoptosis without Increasing DPR Protein Levels (A) Immunostaining for the indicated markers. Images were segmented using CellProfiler to quantify cleaved caspase-3 (CC3), a marker of apoptosis. Scale bar, 50 μm. (B) C9 + KO MNs show more apoptosis compared with gene corrected C9GC (n = 3 biological replicates). (C) Quantification of endogenous poly-GP DPR levels using an ELISA assay (n = 7 biological replicates). (D) Immunostaining for the indicated markers, including MAP2 and poly-GP DPR proteins. Poly-GP peptides could be detected in the cytoplasm of C9 and C9 + KO MNs (indicated by arrows) but not in gene corrected controls. Isogenic cell lines set 1 (left) and set 2 (right). Scale bars, 10 μm. All values are presented as mean ± SEM. One-way ANOVA followed by Tukey's post-test for multiple comparisons was performed (p < 0.05, ∗∗p < 0.01, ∗∗∗p < 0.001, ∗∗∗∗p < 0.0001).
Figure 6
Figure 6
HRE and Loss of C9ORF72 Reduce HSP40 and HSP70 Protein Levels and Alter SG Formation (A and B) Capillary electrophoresis showing that (A) HSPA1A and (B) HSPA1B are reduced in C9 MNs compared with C9GC controls. Levels were even further reduced in C9 + KO MNs. (C) Capillary electrophoresis showing that DNAJA4 is reduced in C9 MNs compared with C9GC, and strikingly downregulated in C9 + KO MNs (n = 8 biological replicates). (D) Immunostaining of isogenic MNs with the indicated makers. Bottom panel shows segmentation of SGs, nuclei, and soma. Scale bar, 5 μm. (E) SG mean intensity was unaltered in MNs within the isogenic sets. (F) Quantification revealed significantly higher number of SGs per cell in C9 MNs compared with C9GC, which was increased in C9 + KO neurons (n = 3 biological replicates; >3,400 cells and >12,000 SGs). All values are presented as mean ± SEM. One-way ANOVA followed by Tukey's post-test for multiple comparisons was performed (p < 0.05, ∗∗p < 0.01, ∗∗∗∗p < 0.0001, ∗∗∗∗p < 0.0001).
Figure 7
Figure 7
HSP Inhibitor KNK437 Disrupts Axonal Trafficking and Induces Apoptosis in MNs with HRE (A) Maximum projection for C9-1 and C9-2 MNs treated with either DMSO or 200 μM KNK437. Scale bars, 10 μm. Quantification for lysosomal track displacement in μm. Mann-Whitney test was performed for statistical significance (∗∗∗∗p < 0.0001). N = 6 biological replicates; >500 lysosomes were analyzed per cell line and per side for all experiments. (B) Immunostaining for CC3 for C9-1 and C9-3 MNs treated with DMSO or the indicated concentration of KNK437. Scale bar, 50 μm. (C) Quantification shows percent CC3-positive cells. N = 4 biological replicates. One-way ANOVA was used to calculate statistical significance (p < 0.05, ∗∗p < 0.01). See also Figure S7.

References

    1. Benatar M., Wuu J., Andersen P.M., Atassi N., David W., Cudkowicz M., Schoenfeld D. Randomized, double-blind, placebo-controlled trial of arimoclomol in rapidly progressive SOD1 ALS. Neurology. 2018;90:e565–e574. - PMC - PubMed
    1. Chew J., Gendron T.F., Prudencio M., Sasaguri H., Zhang Y.J., Castanedes-Casey M., Lee C.W., Jansen-West K., Kurti A., Murray M.E. C9ORF72 repeat expansions in mice cause TDP-43 pathology, neuronal loss, and behavioral deficits. Science. 2015;348:1151–1154. - PMC - PubMed
    1. Chitiprolu M., Jagow C., Tremblay V., Bondy-Chorney E., Paris G., Savard A., Palidwor G., Barry F.A., Zinman L., Keith J. A complex of C9ORF72 and p62 uses arginine methylation to eliminate stress granules by autophagy. Nat. Commun. 2018;9:2794. - PMC - PubMed
    1. Ciura S., Lattante S., Le Ber I., Latouche M., Tostivint H., Brice A., Kabashi E. Loss of function of C9orf72 causes motor deficits in a zebrafish model of amyotrophic lateral sclerosis. Ann. Neurol. 2013;74:180–187. - PubMed
    1. Devlin A.C., Burr K., Borooah S., Foster J.D., Cleary E.M., Geti I., Vallier L., Shaw C.E., Chandran S., Miles G.B. Human iPSC-derived motoneurons harbouring TARDBP or C9ORF72 ALS mutations are dysfunctional despite maintaining viability. Nat. Commun. 2015;6:5999. - PMC - PubMed

Publication types

MeSH terms