. 2020 Mar 5;26(3):391-402.e5.
doi: 10.1016/j.stem.2020.01.008. Epub 2020 Feb 20.

Distinct Mesenchymal Cell Populations Generate the Essential Intestinal BMP Signaling Gradient

Affiliations

Distinct Mesenchymal Cell Populations Generate the Essential Intestinal BMP Signaling Gradient

Neil McCarthy et al. Cell Stem Cell. .

Abstract

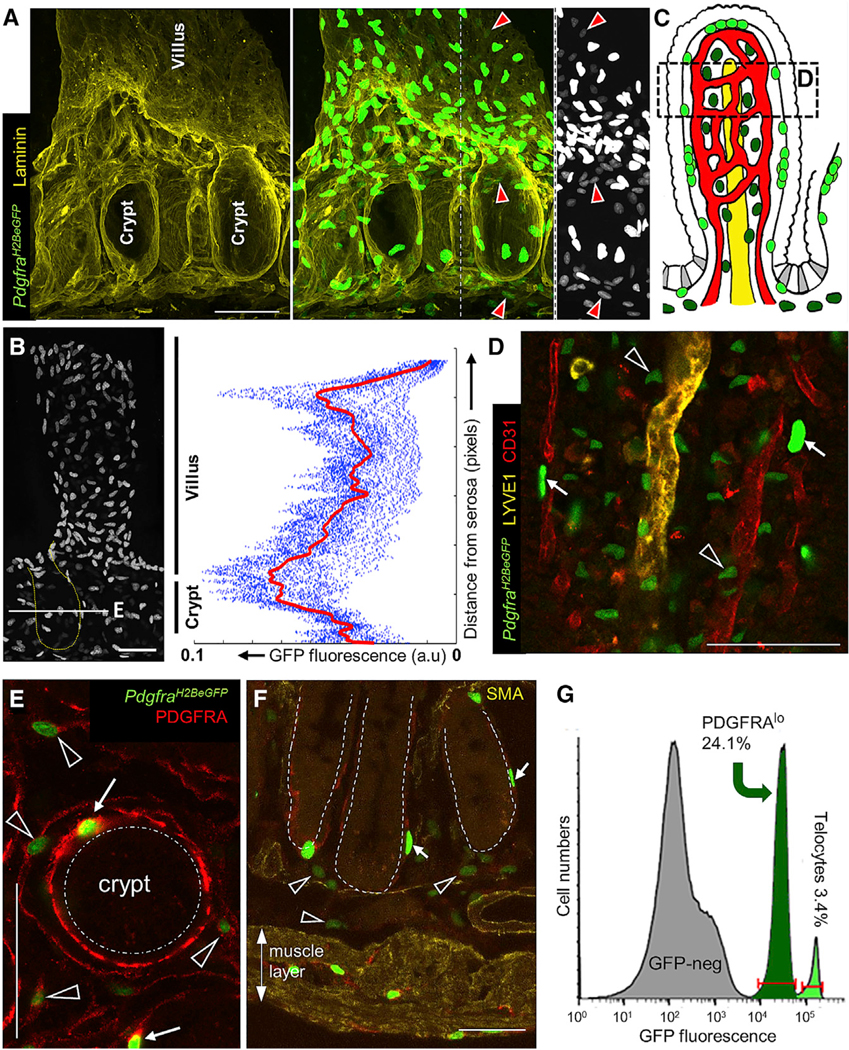
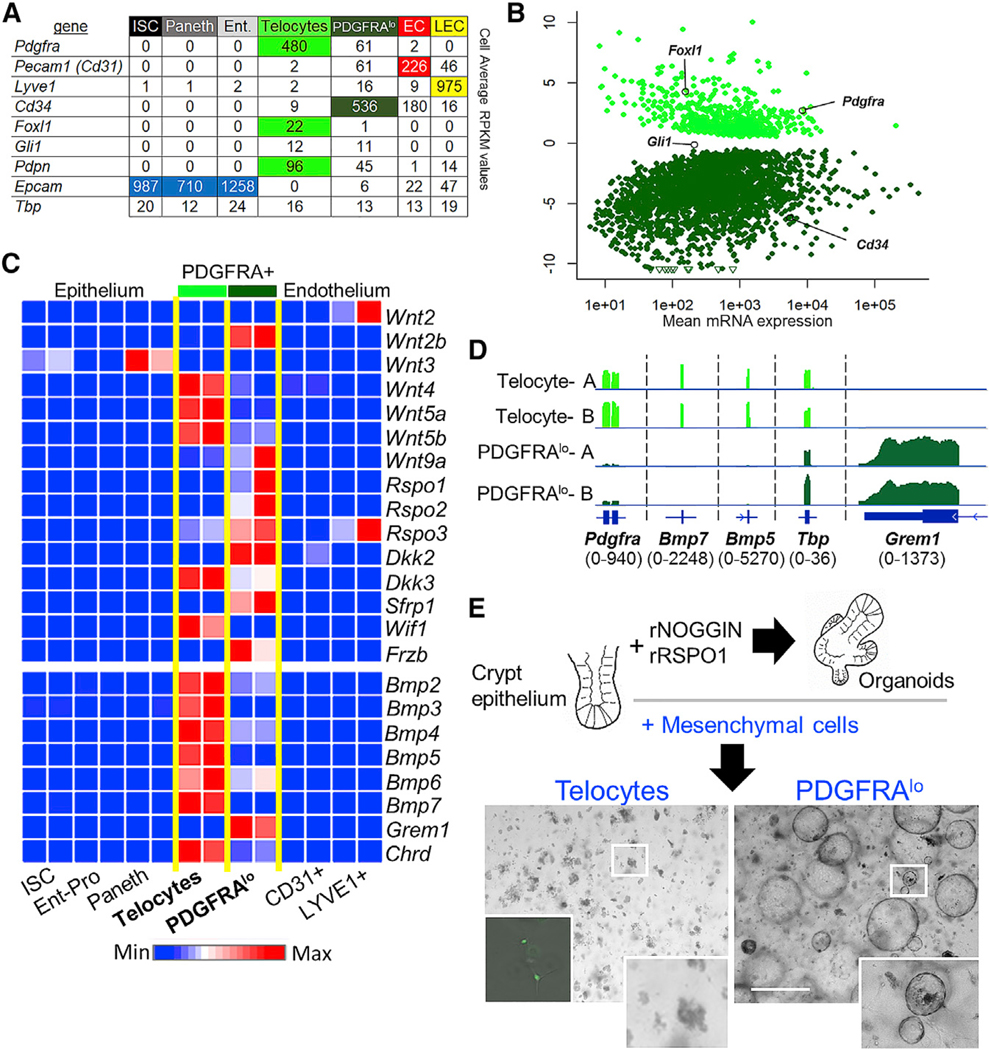
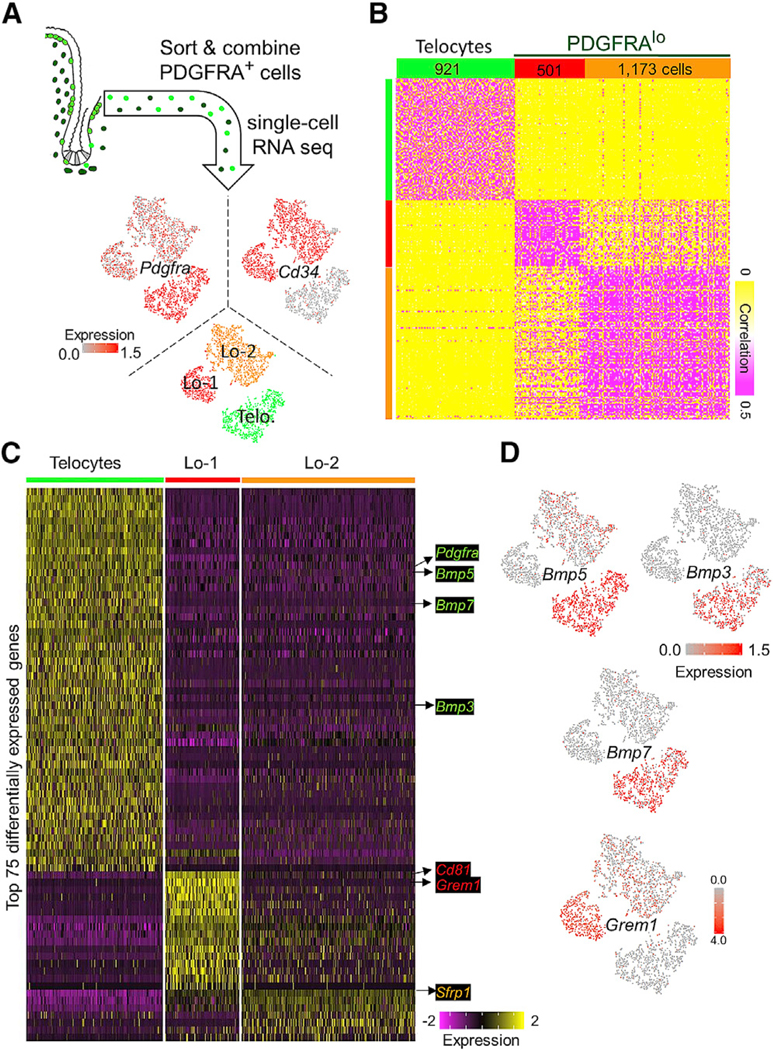
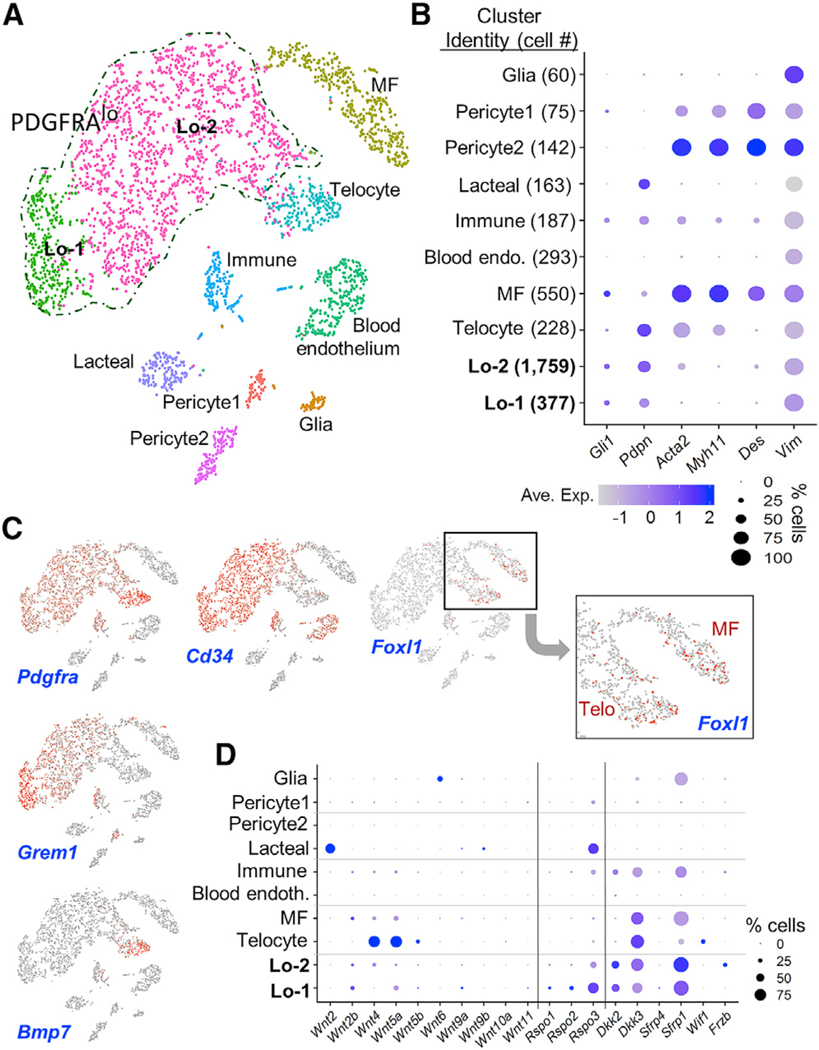
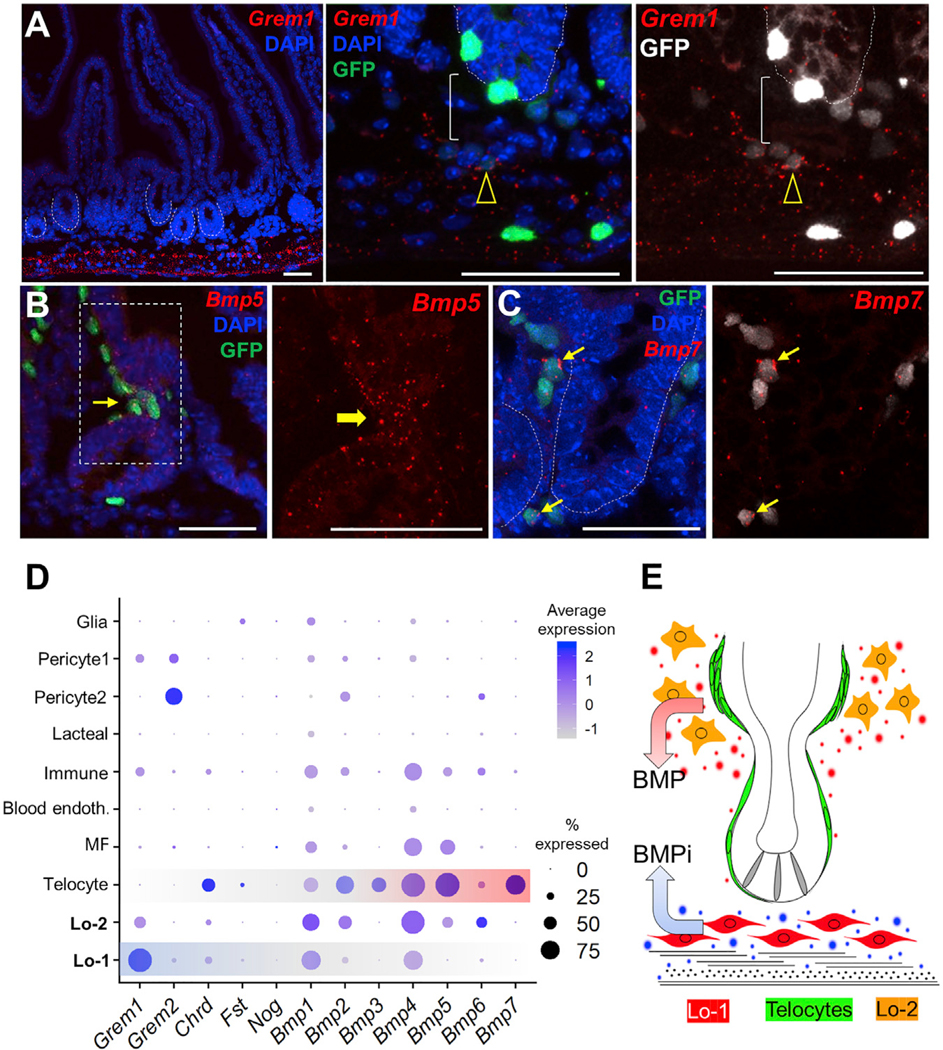
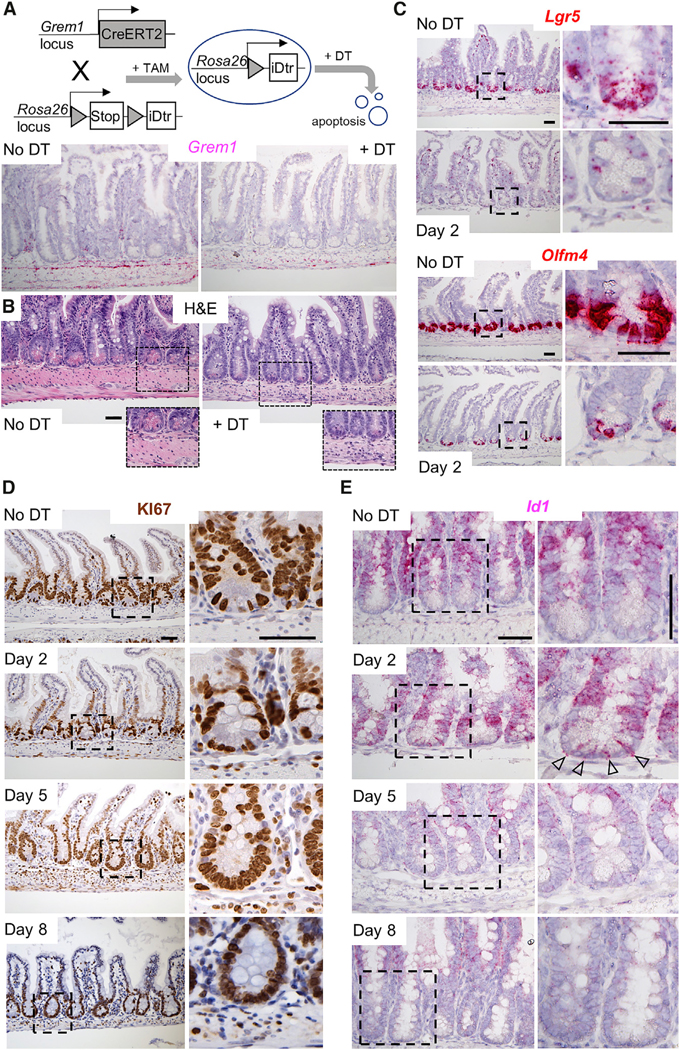
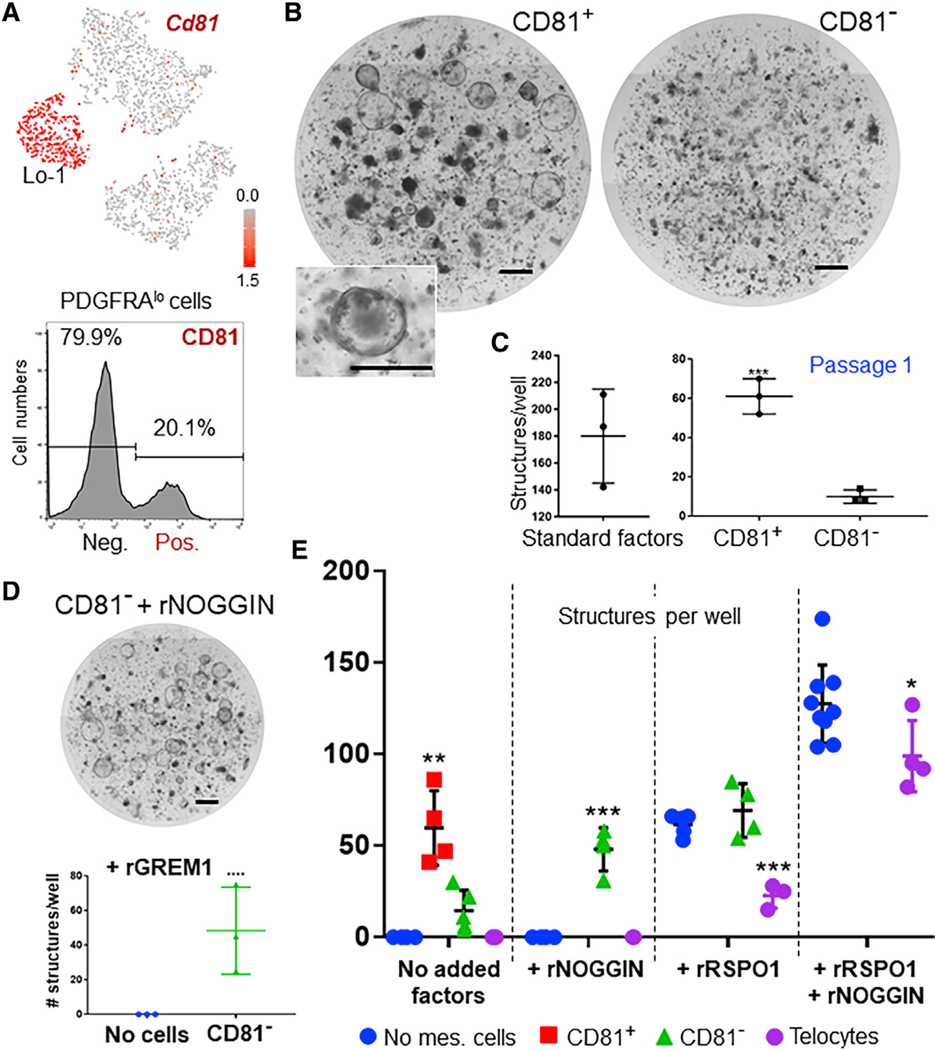
Intestinal stem cells (ISCs) are confined to crypt bottoms and their progeny differentiate near crypt-villus junctions. Wnt and bone morphogenic protein (BMP) gradients drive this polarity, and colorectal cancer fundamentally reflects disruption of this homeostatic signaling. However, sub-epithelial sources of crucial agonists and antagonists that organize this BMP gradient remain obscure. Here, we couple whole-mount high-resolution microscopy with ensemble and single-cell RNA sequencing (RNA-seq) to identify three distinct PDGFRA+ mesenchymal cell types. PDGFRA(hi) telocytes are especially abundant at the villus base and provide a BMP reservoir, and we identified a CD81+ PDGFRA(lo) population present just below crypts that secretes the BMP antagonist Gremlin1. These cells, referred to as trophocytes, are sufficient to expand ISCs in vitro without additional trophic support and contribute to ISC maintenance in vivo. This study reveals intestinal mesenchymal structure at fine anatomic, molecular, and functional detail and the cellular basis for a signaling gradient necessary for tissue self-renewal.

Keywords: epithelium-mesenchyme co-culture; intestinal stem cell niche; mesenchyme; niche signaling gradients; single-cell RNA profiles; telocytes; trophocytes.


Conflict of interest statement

Declaration of Interests E.E.S., V.N.K., C.C., S.K., F.J.d.S., and S.J.T. are employees of Genentech and own shares in Roche. The other authors declare no competing interests.

Figures

Figure 1.
Figure 1.. Anatomically and Molecularly Distinct PDGFRA+ Populations in Small Intestine Mesenchyme
(A) 3D-rendered image of representative intestinal crypts in PdgfraH2BeGFP mice (left: laminin immunostain, right: laminin + GFP, far right: single crypt showing only GFP in grayscale). Telocytes with bright nuclear fluorescence concentrate at the crypt-villus junction; a separate population of Pdgfralo cells (red arrowheads) is best appreciated in the grayscale image on the far right. (B) Single crypt-villus unit (crypt outline dotted), showing non-uniform telocyte abundance along the vertical axis. Right: GFPhi signals quantified along crypt-villus units. Dots represent the signal quantified along each unit; the red line represents the mean signal. The white line in the micrograph indicates the level represented in (E). (C) Telocyte (neon green) and PDGFRAlo cell (bottle green) distributions illustrated in relation to blood (red) and lymphatic (yellow) vessels, epithelium (white), and Lgr5+ ISC (gray). The region represented in (D) is boxed. (D) 3D-rendered image of telocyte (arrows) and PDGFRAlo cell (arrowheads) positions along the villus radial axis, shown over a region represented by the box in (C). Telocytes are apposed to the epithelium, whereas PDGFRAlo cell lie deeper, intermingled with capillaries. (E) Crypt cross-section (approximate level marked by the line in B), showing relative positions, PDGFRA expression levels, and cytoplasmic sweep of telocytes (arrows) and PDGFRAlo cells (arrowheads). (F) PDGFRAlo cells (arrowheads) are present below crypts (dotted outlines), in the submucosa; PDGFRAhi cells (arrows) include telocytes and other cells in the muscularis, as described previously (Kurahashi et al., 2012; Shoshkes-Carmel et al., 2018). All scale bars, 50 μm. (G) GFP flow cytometry separates telocytes from the larger population of PDGFRAlo cells. See also Figure S1.
Figure 2.
Figure 2.. Distinct Niche Signals and Epithelial Supportive Functions of Intestinal Telocytes and PDGFRAlo Stromal Cells
(A) Average normalized reads per kilobase per million (RPKM) values of known marker genes from duplicate RNA-seq libraries of the indicated cell types. Telocytes express the highest Pdgfra levels and alone express Foxl1, while PDGFRAlo cells express Cd34 and are the only other Pdgfra- expressing cell type. Pdpn and Gli1, markers recently ascribed to stromal cell populations (Degirmenci et al., 2018; Stzepourginski et al., 2017), express at roughly equal levels in telocytes and PDGFRAlo cells. Tbp, a representative house-keeping gene, confirms accurate library normalization. (B) Differential expression of >2,400 transcripts (q < 0.05, log2 fold-difference >1.5) in telocytes and PDGFRAlo cells; selected genes are shown. (C) Relative expression of secreted niche factor mRNAs in purified epithelial and mesenchymal cell populations, selected from a full set of Wnt and BMP pathway agonists and antagonists (Table S1). The heatmap is prepared from normalized values for RPKM averaged from duplicate RNA-seq libraries of each cell type. (D) Integrative genome viewer (IGV) tracks showing RNA-seq data for Bmp5, Bmp7, Grem1, and Pdgfra in duplicate cell isolates. Tbp controls for proper normalization of read counts and the numbers in parentheses refer to the range of signal values. (E) Co-culture of isolated mouse small intestine crypts in Matrigel, showing that PDGFRAlo cells (n = 12), but not telocytes (n = 7, left inset shows viable GFP+ telocytes), substitute for recombinant factors NOGGIN and RSPO1 to generate abundant spherical enteroid structures. Boxed areas are magnified in the bottom right insets. Scale bar, 1 mm. See also Figure S2 and Table S1.
Figure 3.
Figure 3.. sc-RNA Sequencing Reveals Three Distinct PDGFRA+ Populations
(A) GFPhi and GFPlo cells were sorted from PdgfraH2BeGFP mouse intestinal mesenchyme and combined for single-cell (sc) RNA-seq. t-Distributed stochastic network embedding (t-SNE) of data from 921 GFPhi and 1,674 GFPlo (PDGFRAlo) cells reveals three populations. Cd34Pdgfrahi telocytes are distinct from two novel Cd34+ PDGFRAlo subpopulations. (B) Unsupervised clustering verified the similarities within, and differences between, the three cell groups. (C) Genes differentially expressed among the three PDGFRA+ mesenchymal cell types (p < 0.01, average log2 fold change >1). BMP ligand transcripts are highly enriched in telocytes, Cd81, and Grem1 are two of the three best distinguishers of Lo-1 cells, and Sfrp1 best distinguishes both PDGFRAlo populations from telocytes. (D) Projection of Bmp5, Bmp3, Bmp7, and Grem1 single-cell transcript density onto the t-SNE map. See also Figure S3 and Table S2.
Figure 4.
Figure 4.. Pdgfralo Cells Are the Dominant Resident Population in the Small Bowel Mesenchyme
(A) Clustering of 10 discrete cell populations by t-SNE of RNA profiles from 3,763 single mesenchymal cells, excluding Ptprc+ leukocytes. (B) Relative expression of known stromal cell markers in cell clusters identified by scRNA-seq. Circle sizes represent the within-cluster probability of gene detection and fill colors represent normalized mean expression levels. (C) Projection of Pdgfra, Cd34, Foxl1, Grem1, and Bmp7 single-cell transcript density onto the t-SNE map. Foxl1+ cell clusters are magnified, showing expression in both telocytes and MFs. (D) Relative expression of Wnt, Rspo, and Wnt inhibitor transcripts in the single-cell clusters. See also Figure S4.
Figure 5.
Figure 5.. Spatial Polarity of Grem1 and Bmp Expression
(A) RNA in situ hybridization localizes Grem1 transcripts largely in two parallel stripes. Beneath the crypt epithelium (dotted outlines), confocal microscopy further localizes Grem1 mRNA in PDGFRAlo cells (arrowhead), revealing a gap (bracket) between these sub-cryptal cells and the epithelium. To highlight this gap, GFP signal is rendered in gray to the right. PDGFRAhi pericryptal (telocytes) and muscularis (Purkinje-like) cells lack Grem1. Images represent dozens of microscopic fields examined in three independent experiments. (B and C) In situ hybridization localizes Bmp5 (B) and Bmp7 (C) mRNAs in telocytes (arrows), which embrace the epithelium and concentrate at the crypt-villus boundary. Images represent dozens of microscopic fields examined in three independent experiments, and boxed regions are magnified in panels to the right. In light of the absence of Bmp5 mRNA in crypt epithelial cells (Table S1), the faint epithelial signal is likely background noise. All scale bars, 50 μm. (D) Relative expression of BMP inhibitors and ligands in single-cell clusters identified in unfractionated mesenchyme. (E) Model of the mesenchymal BMP gradient, showing telocytes (green) as the major and Lo-2 cells (orange) as possibly minor sources of BMP agonists concentrated at the villus base, with sub-cryptal Lo-1 cells (red) providing BMPi near the crypt base to oppose that signal (ISCs in gray).
Figure 6.
Figure 6.. Grem1+ Mesenchymal Cells Sustain ISC In Vivo
(A) Targeting strategy for depletion of Grem1+ cells. Ablation of Grem1+ cells is verified by absence of Grem1 mRNA (in situ hybridization) two days after the second of 2 DT injections. (B) Histology (H&E) shows reduced external muscle, inflammatory infiltrates, and disrupted epithelial morphology within 5 days of Grem1+ cell ablation. Boxed regions are magnified in the insets. (C) Expression of ISC markers Lgr5 and Olfm4 is markedly attenuated within two days of Grem1+ cell ablation. (D) Replicating (KI67+) TA cells remain in intestines depleted of Grem1+ cells and occupy the crypt bottoms, which are depleted of Lgr5+ ISC. (E) BMP target gene Id1 is increased two days after Grem1+ cell ablation, selectively in crypt base columnar cells, and subsequently lost, coincident with ISC attrition. All images depict data from three or four independent mice. Boxed areas in each image are magnified to the immediate right. All scale bars, 50 μm. See also Figures S5 and S6.
Figure 7.
Figure 7.. Grem1+PDGFRAlo Cells Selectively Express CD81 and Support Enteroid Growth
(A) Top: Cd81 transcript levels projected onto the t-SNE map of scRNA-seq data (Figure 3), showing highly enriched expression in Lo-1 cells. Bottom: PDGFRAlo cell separation into CD81+ and CD81+ subpopulations by flow cytometry with CD81 Ab. (B) Co-culture of isolated crypt epithelium with CD81+ and CD81 PDGFRAlo cells in the absence of recombinant trophic factors, showing enteroid growth stimulated by the CD81+ but not by the CD81 fraction. Inset shows one magnified enteroid. (C) Successful propagation of structures produced in CD81+ co-cultures. Standard conditions: rRSPO1, rNOGGIN, and rEGF. n = 3 experiments each. (D) Addition of rNOGGIN or rGREM1 to CD81 crypt co-cultures overcomes their inability to support enteroid growth. (E) Quantitation of spheroid structures from multiple (n, 3 to 5) experiments of crypt epithelium co-culture with the indicted mesenchymal cells and recombinant (r) factors. Bars represent mean ± SEM values. Significance of differences was determined by two-tailed t test, one-way ANOVA. **p < 0.01; ***p < 0.001; n.s., not significant. All scale bars, 1 mm. See also Figure S7.

References

    1. Aoki R, Shoshkes-Carmel M, Gao N, Shin S, May CL, Golson ML, Zahm AM, Ray M, Wiser CL, Wright CV, and Kaestner KH (2016). Foxl1-expressing mesenchymal cells constitute the intestinal stem cell niche. Cell. Mol. Gastroenterol. Hepatol 2, 175–188. - PMC - PubMed
    1. Aono A, Hazama M, Notoya K, Taketomi S, Yamasaki H, Tsukuda R, Sasaki S, and Fujisawa Y. (1995). Potent ectopic bone-inducing activity of bone morphogenetic protein-4/7 heterodimer. Biochem. Biophys. Res. Commun 210, 670–677. - PubMed
    1. Barkai N, and Shilo BZ (2009). Robust generation and decoding of morphogen gradients. Cold Spring Harb. Perspect. Biol 1, a001990. - PMC - PubMed
    1. Baryawno N, Przybylski D, Kowalczyk MS, Kfoury Y, Severe N, Gustafsson K, Kokkaliaris KD, Mercier F, Tabaka M, Hofree M, et al. (2019). A cellular taxonomy of the bone marrow stroma in homeostasis and leukemia. Cell 177, 1915–1932. - PMC - PubMed
    1. Batts LE, Polk DB, Dubois RN, and Kulessa H. (2006). Bmp signaling is required for intestinal growth and morphogenesis. Dev. Dyn 235, 1563–1570. - PubMed

Publication types