. 2020 Mar 5;26(3):377-390.e6.
doi: 10.1016/j.stem.2019.12.011. Epub 2020 Feb 20.

Ascl2-Dependent Cell Dedifferentiation Drives Regeneration of Ablated Intestinal Stem Cells

Affiliations

Ascl2-Dependent Cell Dedifferentiation Drives Regeneration of Ablated Intestinal Stem Cells

Kazutaka Murata et al. Cell Stem Cell. .

Abstract

Ablation of LGR5+ intestinal stem cells (ISCs) is associated with rapid restoration of the ISC compartment. Different intestinal crypt populations dedifferentiate to provide new ISCs, but the transcriptional and signaling trajectories that guide this process are unclear, and a large body of work suggests that quiescent "reserve" ISCs contribute to regeneration. By timing the interval between LGR5+ lineage tracing and lethal injury, we show that ISC regeneration is explained nearly completely by dedifferentiation, with contributions from absorptive and secretory progenitors. The ISC-restricted transcription factor ASCL2 confers measurable competitive advantage to resting ISCs and is essential to restore the ISC compartment. Regenerating cells re-express Ascl2 days before Lgr5, and single-cell RNA sequencing (scRNA-seq) analyses reveal transcriptional paths underlying dedifferentiation. ASCL2 target genes include the interleukin-11 (IL-11) receptor Il11ra1, and recombinant IL-11 enhances crypt cell regenerative potential. These findings reveal cell dedifferentiation as the principal means for ISC restoration and highlight an ASCL2-regulated signal that enables this adaptive response.

Keywords: facultative stem cells; reserve stem cells; stem cell dedifferentiation.


Conflict of interest statement

Declaration of Interests H.C. is an inventor on patents related to intestinal organoids (full disclosure at https://www.uu.nl/staff/JCClevers/). The other authors declare no competing interests.

Figures
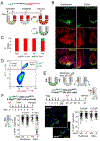
Figure 1.
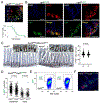
Figure 1.. ISC regeneration by enterocyte and secretory progenitors.
A) Schema for ISC regeneration in Lgr5GFP-Cre-ER(T2);R26R tdTom mice. Lgr5+ ISCs were ablated by γ-irradiation 4 days after induction of Cre to track tdTom+ progeny 6 days thereafter. If ISC regenerate from those progeny, then freshly restored GFP+ ISCs will carry the tdTom label. If ISCs are restored from a separate reserve pool, those ISCs will express GFP but not tdTom. B-C) Representative micrographs (B) and quantitation (C) of crypts containing restored tdTom+ and tdTomGFP+ ISCs in the duodenum and colon 6 days after γ-irradiation. Scale bars, 50 m. Bar graphs represent the tdTom+ fraction (means ±SD) in all (hundreds in each of N=5 mice) GFP+ crypts. D) Two-color (GFP and tdTom) flow cytometry of duodenal crypt cells isolated from TAM-treated Lgr5GFP-Cre;R26R tdTom mice 6 days after γ-irradiation (N=2 animals). tdTom+ cells represent GFP+ ISCs (>99% express tdTom) and their labeled GFP progeny. E-F) Experimental schemes and results of ISC restoration in DT-treated Lgr5Dtr-GFP mice by Ent cells when the Sec lineage is absent (Atoh1−/−, E) or by Sec cells when the Ent lineage is depleted (Rbpj−/−, F). Tamoxifen (TAM) was administered to delete genes and DT was given to ablate ISCs. Every GFP+ crypt was counted on the indicated days in Atoh1−/− (N=6) or Rbpj−/− (N=4) intestines and equal numbers of controls. Within the plots, boxes demarcate quartiles 1 and 3, bars represent median values, whiskers represent 1.5 times the inter-quartile range, and differences were assessed using Student’s t-test. Dotted white lines in representative micrographs outline selected crypts. Scale bars, 50 μm. See also Figure S1.
Figure 2.
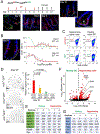
Figure 2.. Ascl2 expression and perturbation.
A) mCh+ cell positions in Ascl2Dfci mouse intestines relative to the bottom of colonic crypts (tier 0; positions 1 and 1’, 2 and 2’, etc. correspond to higher tiers). Results are quantified below as means ±SD (N=4 mice). B) Confocal micrographs of mCh and GFP co-localization in the duodenum and colon of strains with mosaic (Lgr5GFP-Cre) and non-mosaic (Lgr5Dtr-GFP) GFP+ ISCs. Results represent findings in at least 5 mice of each genotype. Scale bars, 50 μm. Dotted white lines outline single crypts. C) Duodenal crypt cell proliferation was largely intact after Ascl2 deletion by Villin-CreER-T2 (N=3 mice of each genotype). D) Counts of all GFP+ crypts in every microscopic field in Ascl2+/Fl and Ascl2Fl/Fl intestines (N=5 mice each) on the Lgr5GFP-Cre background, 7 days after the first TAM dose. Differences in C and D were assessed by Student’s t-test. E) Flow cytometry confirmed persistence of duodenal GFP+ ISCs in Lgr5GFP-Cre;Ascl2Fl/Fl mice 7 days after TAM treatment. Data are shown for 1 pair from N=2 mice of each genotype. F) In Cre-activated crypts, LgrGFP-Cre;Ascl2Fl/Fl mice lacked mCh expression, which was readily evident in neighboring Cre (GFP) crypts. Dashes outline single crypts, scale bar =50 μm. See also Figures S1 and S2.
Figure 3.
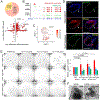
Figure 3.. Reduced fitness of Ascl2−/− ISCs.
A) Early (5 days) and late (28 days and 112 days) crypt composition after Ascl2 deletion in Lgr5GFP-Cre;R26R tdTom intestines. All GFP+ crypts on this mosaic background showed tdTom expression 5 days after the first dose of TAM, but the proportion of tdTom+ GFP+ crypts (red arrow) was reduced by 28 days (N=2 animals) and substantially so by 112 days (N=5 mice), when large fractions of duodenal and colonic GFP+ ISCs lacked tdTom (green arrow). Bar graphs depict mean counts ±SD and differences were evaluated by Student’s t-test. Thus, Lgr5+ cells that escaped Ascl2 and R26R recombination (tdTom) are selected over Ascl2-null (tdTom+) ISCs. Scale bars, 50 μm. B) Genotyping of GFP+ ISCs purified by flow cytometry 5 days and 28 days after TAM treatment shows presence of recombined (Ascl2-null) and parental (unrecombined, ‘escaper’) alleles. The genotyping strategy is shown in Fig. S1G–H. C) High-magnification micrographs showing the presence of tdTom (green arrowheads) and tdTom+ (yellow arrowheads) GFP+ ISCs in the same crypt. Such mixed crypts were rare (<15 per animal). tdTom+GFP cells are Paneth cells arising from tdTom+ ISCs that previously contributed to this representative crypt. D) Population genetics model for ISC dynamics (see STAR Methods). N number of ISCs are arranged on the cycle graph, representing crypts that contain infrequent tdTom ‘escaper’ ISC (0, wild-type) amid mostly recombined tdTom+ ISCs (1, Ascl2−/−). During each time step of the stochastic model, we first sample an exponential waiting time for each ISC with rates λWT and λMut for WT and mutant ISCs, respectively. The smallest waiting time defines which cell divides first. Thereafter, one resulting daughter takes the parent’s spot, while the other usurps one of the two neighboring cells, each with probability 0.5. This cycle repeats over many cell divisions until crypts carry predominantly tdTom+ or tdTom ISCs, i.e., fixation, which was evident in mice examined 28 and 112 days after gene excision (Fig. 3A). E) Density plot of estimated Ascl2−/− fitness (λMut) values relative to wild-type duodenal or colonic ISCs (λWT), determined using simulations for different parameter regimes (see Figure S3C). See also Figures S1 and S3.
Figure 4.
Figure 4.. Ascl2 requirement in ISC restoration after injury.
A) Test of Ascl2 requirements in ISC regeneration after 10 Gy γ-irradiation of Lgr5GFP-Cre mice. GFP+ ISCs failed to regenerate in the absence of ASCL2. Graph depicts survival of unirradiated mice with Ascl2−/− intestines and mice with Ascl2+/+ or Ascl2−/− intestines after irradiation (N=5 animals per cohort). Differences were assessed by the log-rank test. B) Ascl2 requirement for ISC restoration after Lgr5Dtr-GFP mice were treated with DT. In mice harvested on day 11 of the study, all GFP+ crypts were counted in every microscopic field in experimental (Ascl2−/−) and two groups of control (Ascl2+/+ and no DT treatment) intestines (N=4 mice per cohort) harvested on day 11. Boxes: quartiles 1 and 3, bars: median values, whiskers: 1.5 times the inter-quartile range. Differences assessed using Student’s t-test. Fluorescence micrographs representing 4 experimental pairs and flow cytometry data representing 1 of N=2 experimental pairs demonstrate the paucity of duodenal GFP+ ISCs in Ascl2−/− intestines. C-D) Representative fluorescence micrographs (C, dotted white lines outline selected crypts) and histology (D, hematoxylin & eosin stain) from intestines harvested from 2 mice on day 14, showing absence of GFP+ crypt base cells and distorted tissue morphology, which was patchy. Scale bars, 50 μm. See also Figure S4.
Figure 5.
Figure 5.. Ascl2 expression in colonic non-stem crypt cells after ISC ablation.
A) Lgr5Dtr-GFP ISCs were ablated by administering DT, followed by colon harvests on days 7, 8, 9, and 10. mCh first appeared on day 8 in cells located well above the ISC zone, in positions never occupied by mCh+ cells in the absence of ISC injury (see Fig. 2A–B). Each subsequent day, mCh+ cells appeared in positions closer to the crypt base, and by day 10, many of these cells acquired GFP expression (arrowhead in inset micrograph). Scale bars, 50 μm. B) Illustrative tier positions and manual counts of mCh+ cells (red) relative to the crypt bottom on days 8 (N=5 mice) and 10 (N=3 mice). The green line (from Fig. 2A) depicts mCh+ cell positions in untreated animals (N=4 mice). C) Flow cytometry confirmed that mCh+ crypt cells on day 8 lack GFP and give higher mCh signals than resting ISCs (additional examples and comparative statistics shown in Fig. S5B). D) Organoid formation in vitro by single GFP cells (mCh+ or mCh) captured by flow cytometry from the same animals (N=3) on day 8. mCh+ cells formed organoids more efficiently than mCh cells or native stem cells (mCh+GFP+ from uninjured mice). Relative organoid numbers (yellow, red bars) are expressed in relation to those cultured from resting ISCs (green bar). E-G) Differential gene expression in uninjured (resting) colonic ISCs and regenerating day 8 mCh+ ‘upper’ crypt cells, determined by DEseq2 analysis of RNA-seq data. Overall differences (>log21.5-fold, q <0.05) were limited to 316 genes, most of which increased in regenerating cells (F). Reads per kb per million sequence tags (RPKM) values from replicate samples show that the regenerating ‘upper’ cell population lacked Lgr5 but expressed many ISC-specific mRNAs (E) and that markers attributed to +4 ‘reserve’ ISCs were absent or equally expressed in resting and regenerating colonic ISCs (G). Gapdh, Tbp confirm proper normalization of RNA-seq data. See also Figure S5 and Tables S1 and S2.
Figure 6.
Figure 6.. Transcriptomics of ISC restoration at single-cell resolution.
A) Uniform manifold Approximation and Projection (UMAP) plots from RNA analysis of single mCh+ regenerating ‘upper’ cells, showing the paucity of Lgr5 expression compared to Ascl2 and other ISC markers, including. In nearest-neighbor depiction, Lgr5 ISC-like cells cluster together. Expression scales are different for each marker. B) Within the same UMAP-specified cell groups: Top – Distributions of actively cycling and non-replicating cells. Bottom – Expression of +4 ‘reserve’ ISC marker genes Bmi1 and Clu. C) Projection of colonocyte (Fabp2, Car1) and goblet cell (Tff3, Muc2) markers on the same UMAP plot reveals that non-cycling mCh+ ‘upper’ cells are similar to mature epithelial cells. D) Hundreds of cells that cluster at the junctions of mature and ISC-like cells co-express ISC and either colonocyte (e.g., Fabp2) or goblet cell (e.g., Muc2) markers. In the dedifferentiation context, we therefore consider them bona fide transitional (Trans) cells. E) Analysis of scRNA-seq data in Monocle v2.12.0 (Trapnell et al., 2014). Left: Depiction of cells along the defined trajectory, color-coded according to categories defined in UMAP analysis by expression of cell-specific marker genes. Inset: ISCs, goblet cells, and colonocytes projected separately on the trajectory. Right: Cells are color-coded according to their imputed pseudotime, with high ISC marker-expressing cells as the destination. F) Colonocyte (Car1, Fabp2), ISC (Cdca7), and goblet cell (Spdef, Muc2) marker expression in mature and transitional (Trans) plotted along the above-defined pseudotime axis. Fall of mature cell, and rise of ISC, markers occurs faster in dedifferentiating colonocytes than in goblet cells. In this interpretation, Trans colonocytes are fewer than Trans goblet cells because the latter dedifferentiate over a longer period. See also Figure S6.
Figure 7.
Figure 7.. Transcriptional targets of ASCL2 in ISC regeneration.
A) Fraction of ASCL2Flag ChIP-seq peaks (Suppl. Table 3) present <1 kb (designated promoters) or >1 kb (presumptive enhancers) from TSSs in regenerating Ascl2+ cells. The graph shows the relation between 316 genes differentially expressed in ‘upper’ cells (compared to resting ISCs – Suppl. Table 1) and relative ASCL2Flag ChIP-seq signals at their respective promoters in the two populations. Dashed lines point to candidate ASCL2 target genes that encode signaling factors. B) Integrated Genome Viewer (IGV) tracks of RNA-seq and ASCL2Flag ChIP-seq data from uninjured colonic ISCs and regenerating day 8 mCh+ crypt cells, showing differential ASCL2 occupancy at the Il11ra1 promoter and reproducibly increased Il11ra1 mRNA in the latter cells. C) Projection of Il11ra1 mRNA levels onto the tSNE plot from single regenerating cells (Fig. 6), showing its broad distribution and particular enrichment in the goblet cell fraction. D) Phosphorylated (p) STAT3 immunofluorescence, showing its presence in rare crypts (<10 per colon, N=5 mice) after ISC ablation, compared to absence of pSTAT3 (0 crypts/colon, N=5 mice) in the absence of ISC injury. E) Response of GFP mCh+ ‘upper’ cells, mCh crypt cells post-ISC ablation, and uninjured mCh+ resting ISCs to recombinant IL-11 in organoid formation (N=4 mice). Scale bars, 1 mm. Bars in the graph represent mean (±SD) ratios of organoids generated with or without rIL-11. Relative organoid numbers in IL11-treated cultures are expressed in relation to those that each population yielded in WENR medium without IL11. F) Representative structures derived at the first passage of mCh+ ‘upper’ crypt cells initially cultured with rIL-11, indicating that they contained ISCs. See also Figure S7 and Table S3.

Comment in

References

    1. Anders S, Pyl PT, and Huber W (2015). HTSeq--a Python framework to work with high-throughput sequencing data. Bioinformatics 31, 166–169. - PMC - PubMed
    1. Ayyaz A, Kumar S, Sangiorgi B, Ghoshal B, Gosio J, Ouladan S, Fink M, Barutcu S, Trcka D, Shen J, et al. (2019). Single-cell transcriptomes of the regenerating intestine reveal a revival stem cell. Nature 569, 121–125. - PubMed
    1. Bamba S, Andoh A, Yasui H, Makino J, Kim S, and Fujiyama Y (2003). Regulation of IL-11 expression in intestinal myofibroblasts: role of c-Jun AP-1- and MAPK-dependent pathways. Am J Physiol Gastrointest Liver Physiol 285, G529–238. - PubMed
    1. Banerjee KK, Saxena M, Kumar N, Chen L, Cavazza A, Toke NH, O’Neill NK, Madha S, Jadhav U, Verzi MP, et al. (2018). Enhancer, transcriptional, and cell fate plasticity precedes intestinal determination during endoderm development. Genes Dev 32, 1430–1442. - PMC - PubMed
    1. Bankaitis ED, Ha A, Kuo CJ, and Magness ST (2018). Reserve Stem Cells in Intestinal Homeostasis and Injury. Gastroenterology 155, 1348–1361. - PMC - PubMed

Publication types