. 2020 Mar 9;30(5):788-801.e3.
doi: 10.1016/j.cub.2019.12.064. Epub 2020 Feb 20.

Neuromodulatory Selection of Motor Neuron Recruitment Patterns in a Visuomotor Behavior Increases Speed

Affiliations

Neuromodulatory Selection of Motor Neuron Recruitment Patterns in a Visuomotor Behavior Increases Speed

Urvashi Jha et al. Curr Biol. .

Abstract

Animals generate locomotion at different speeds to suit their behavioral needs. Spinal circuits generate locomotion at these varying speeds by sequential activation of different spinal interneurons and motor neurons. Larval zebrafish can generate slow swims for prey capture and exploration by activation of secondary motor neurons and much faster and vigorous swims during escape and struggle via additional activation of primary motor neurons. Neuromodulators are known to alter the motor output of spinal circuits, but their precise role in speed regulation is not well understood. Here, in the context of optomotor response (OMR), an innate evoked locomotor behavior, we show that dopamine (DA) provides an additional layer to regulation of swim speed in larval zebrafish. Activation of D1-like receptors increases swim speed during OMR in free-swimming larvae. By analyzing tail bend kinematics in head-restrained larvae, we show that the increase in speed is actuated by larger tail bends. Whole-cell patch-clamp recordings from motor neurons reveal that, during OMR, typically only secondary motor neurons are active, whereas primary motor neurons are quiescent. Activation of D1-like receptors increases intrinsic excitability and excitatory synaptic drive in primary and secondary motor neurons. These actions result in greater recruitment of motor neurons during OMR. Our findings provide an example of neuromodulatory reconfiguration of spinal motor neuron speed modules where members are selectively recruited and motor drive is increased to effect changes in locomotor speed. VIDEO ABSTRACT.

Keywords: D1-like receptor; central pattern generator; dopamine; excitability; locomotion; optomotor response; spinal cord; swimming; synaptic; zebrafish.


Conflict of interest statement

Declaration of Interests The authors declare no competing interests.

Figures

Graphical abstract
Graphical abstract
Figure 1
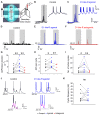
Figure 1. D1-like-R activation increases swim speed during OMR in free-swimming zebrafish larvae
(A) Schematic of experimental set up. OMR was evoked in freely swimming zebrafish larvae (6-7 dpf) by presenting radial gratings moving in a clockwise direction on a screen below the arena. Zebrafish larvae respond to the stimulus by swimming in the direction of moving grating. Videos were acquired from above and larval centroid was tracked. (B) Left, instantaneous speed of a representative larva during a trial. Right, zoomed view of region marked with the orange rectangle showing characteristic intermittent swimming pattern. Brief period of activity represents individual swim bouts (highlighted by line on top) and is followed by a period of no tail movement. (C) Overlaid tracked centroid for a trial duration of 60 seconds showing trajectory of a representative larva before (Control) and after bath application of 20 μM D1-like-R agonist, SKF-38393. Scale bar represents 10 mm. (D-F) Paired plots for average speed, average bout speed and average bout distance respectively, before (black) and after (blue) application of D1-like-R agonist. (G) Overlaid tracked centroid of a representative larva for a trial duration of 60 seconds before (Control) and after bath application of 20 μM D1-like-R antagonist, SCH-23390. Scale bar represents 10 mm. (H-J) Paired plots for average speed, average bout speed and average bout distance respectively, before (black) and after (red) application of D1-like-R antagonist. NSKF-38393=14 larvae, NSCH-23390=9 larvae, Wilcoxon signed-rank test; ** p<0.01. See also Video S1.
Figure 2
Figure 2. D1-like-R signaling modulates tail beat amplitude during forward OMR in head restrained larvae
(A) Schematic representation of experimental set-up. Z-projection of a swim bout showing characteristic alternating left-right tail beats evoked in a head-restrained larval zebrafish (top) in response to caudal-to-rostral moving gratings (bottom). Tail-tip position was tracked for measurement of kinematic variables. (B) Left, representative tracked tail-position for a trial. Right, zoomed view of highlighted bout showing kinematic variables used for behavioral quantification. (C) Overlaid tracked tail-tip position for a representative trial before (top) and after (bottom) application of 100 μM D1-like-R agonist, SKF-38393. Summary data of (D) average tail beat amplitude, (E) average tail beat frequency, (F) average bout duration and (G) number of bouts initiated before (black) and after (blue) bath application of D1-like-R agonist. (H) Overlaid tracked tail-tip position for a representative trial before (top) and after (bottom) application of 100 μM D1-like -R antagonist, SCH-23390. Summary data of (I) average tail beat amplitude, (J) average tail beat frequency, (K) average bout duration and (L) number of bouts initiated before (black) and after (red) bath application of D1-like-R antagonist. Scale bar represents 1mm. NSKF-38393=37 larvae, NSCH-23390=18 larvae, Wilcoxon signed rank test; ***p<0.00001, *p<0.05, ns: not significant. See also Videos S2 and S3 and Figures S1 and S2.
Figure 3
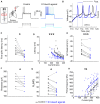
Figure 3. D1-like-R activation enhances drive from secondary motor neurons during OMR
(A) Schematic representation of experimental set-up. Whole-cell patch clamp recordings from secondary motor neurons were obtained while presenting 10s of stationary gratings alternating with 10s of forward moving gratings. Motor neurons were targeted in the region marked by the red rectangle. Zoomed view of the same region is shown on the right. (B) Left, recording from a representative secondary motor neuron during a trial. Region under small black line is shown in a zoomed view on the right. Shaded areas represent timing of moving gratings presentation. (C) Left, recording from the same neuron as in (B) post application of 20 μM D1-like-R agonist, SKF-38393. Region under the small blue line is shown expanded on the right . (D) Representative recording from a secondary motor neuron that was quiescent during moving gratings presentation before any drug application (black). (E) Recording from the same secondary motor neuron as in (D) after subsequent application of D1-like-R agonist (blue) and (F) D1-like-R antagonist (red). (G) Paired plot of average number of action potentials fired within a fictive swim bout divided by its duration during moving grating presentation before (black), after application of D1-like-R agonist (blue) and post subsequent application of D1-like-R antagonist (red). N = 12 cells in control and agonist, and 7 cells in antagonist; Tukey HSD following mixed effects model; **p<0.01. (H) Paired plot of average number of action potentials per cycle before (black), after application of D1-like-R agonist (blue) and post subsequent application of D1-like-R antagonist (red). Tukey HSD following mixed effects model; *p<0.05, **p<0.01. (I) Paired plot of total number of supra-threshold cycles (active cycles) during moving gratings presentation before (black), after (blue) application of D1-like-R agonist, and post subsequent application of D1-like-R antagonist (red). Tukey HSD following mixed effects model; *p<0.05, **p<0.01. (J) Top, representative recordings from a secondary motor neuron during moving grating representation before (black) and after (blue) application of D1-like-R agonist. Bottom, zoomed view of region marked with black rectangle showing voltage cycles (highlighted in pink, see Methods). (K) Average frequency of voltage cycles before (black) and after (blue) application of D1-like-R agonist. Wilcoxon signed-rank test; p=0.9. N=12 cells from 12 larvae. ns: not significant. See also Figures S3 and S4.
Figure 4
Figure 4. D1-like-R activation reduces spike latency and action potential threshold of secondary motor neurons
(A) Schematic of experimental set up. Region marked by the red rectangle is shown on the right. Responses of secondary motor neurons to a series of depolarizing current steps were compared before and after application of 20 μM D1-like-R agonist, SKF-38393. Right, example traces from a cell showing responses to sub-threshold (bottom), threshold (middle) and supra-threshold (top) current steps before (Control) and after application of D1-like-R agonist. (B) Representative traces before (black) and after (blue) application of D1-like-R agonist. Vertical dotted lines indicate spike latency and horizontal dotted lines mark threshold for action potential generation before (black) and after (blue) D1-like-R agonist application. (C) Summary data for first spike latency. Wilcoxon signed-rank test; **p<0.01 (D) Scatter plot of spike latency for each step of depolarizing current injected before (black) and after application of D1-like-R agonist (blue). Solid lines represent mean latency for each current with minimum three values. Mixed-Effects model; **p<0.01 (E) Summary data for threshold of action potential generation. Wilcoxon signed-rank test; *p<0.05. (F) Summary data for rheobase. Paired t-test, p=0.34 (G) Summary data for input resistance. Wilcoxon signed-rank test; p= 0.10 (H) Instantaneous firing frequency of the first two spikes measured in response to series of current steps before (black) and after (blue) application of D1-like-R agonist. Solid lines represent mean firing frequency for each current with minimum three values. Mixed-Effects model; p= 0.41. ns: not significant. N=10 secondary motor neurons recorded from 10 larvae. See also Figures S3, S5 and S6.
Figure 5
Figure 5. Quiescent primary motor neurons are recruited during OMR by D1-like-R activation
(A) Schematic representation of experimental set-up. Whole-cell patch clamp recordings from primary motor neurons were obtained while presenting 10 s of stationary gratings alternating with 10 s of forward moving gratings. Motor neurons were targeted in the region marked by the red rectangle. Zoomed view of the same region is shown on the right. (B-D) Representative recordings from a rostral primary motor neuron (RoP) before any drug application (black), after application of D1-like-R agonist (blue) followed by D1-like-R antagonist (red) application. Shaded areas represent timing of moving gratings presentation. (E) Paired plot of average number of action potentials fired within a fictive swim bout divided by its duration during moving grating presentation before (black), after application of D1-like-R agonist (blue) and post subsequent application of D1-like-R antagonist (red). N= 13 cells in control and agonist, and 5 cells in antagonist; Tukey HSD following mixed effects model; **p<0.01, *p<0.05. (F) Paired plot of average number of action potentials per cycle before (black), after application of D1-like-R agonist (blue) and post subsequent application of D1-like-R antagonist (red). Tukey HSD following mixed effects model; ***p<0.001, **p<0.01. (G) Paired plot of number of supra-threshold cycles (active cycles) during moving gratings presentation before (black), after (blue) application of D1-like-R agonist, and post subsequent application of D1-like-R antagonist (red). Tukey HSD following mixed effects model; *p<0.05, **p<0.01. (H) Left, recordings from a middle primary motor neuron (MiP) before any drug application (black) and (I) after application of D1-like-R agonist (blue). Right, zoomed view of the regions bounded by the black boxes showing rhythmic voltage oscillations (marked in pink, see Methods). (J) Average frequency of voltage oscillations before (black) and after (blue) application of D1-like-R agonist from all the primary motor neurons that were recruited (7/13 cells) post application of D1-like-R agonist. Wilcoxon signed-rank test; p=0.09. ns: not significant; N=13 primary motor neurons recorded from 13 larvae. See also Figures S3 and S4.
Figure 6
Figure 6. D1-like-R activation increases excitability of primary motor neurons
(A) Schematic of experimental set up. Region marked by the red rectangle is shown on the right. Responses of a representative primary motor neuron to a series of depolarizing current steps were compared before (Control) and after application of 20 μM D1-like-R agonist, SKF-38393. (B) Representative traces before (black) and after (blue) application of D1-like-R agonist. Vertical dotted lines indicate spike latency, horizontal dotted lines mark threshold for action potential generation and lines on top indicate first inter-spike interval (Finst) before (black) and after (blue) D1-like-R agonist application. (C) Summary data for first spike latency. Wilcoxon signed-rank test; *p<0.05 (D) Scatter plot of spike latency for each step of depolarizing current injected before (black) and after application of D1-like-R agonist (blue). Solid lines represent mean latency for each current step with minimum three values. Mixed-Effects model; *p<0.05 (E) Summary data for threshold of action potential generation. Wilcoxon signed-rank test; ***p<0.001. (F) Summary data for rheobase. Wilcoxon signed-rank test; *p<0.05. (G) Summary data for input resistance. Wilcoxon signed-rank test; *p<0.05. (H) Instantaneous firing frequency of the first two spikes measured in response to a series of current steps before (black) and after (blue) application of D1-like-R agonist. Solid lines represent mean firing frequency for each current step with minimum three values. p=0.6; Mixed effects model; ns: not significant. N=12 primary motor neurons recorded from 12 larvae. See also Figures S3, S5 and S6.
Figure 7
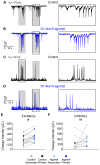
Figure 7. D1-like-R activation increases excitatory drive to motor neurons
(A)Left, voltage-clamp recordings (holding potential Vh = -75 mV) of excitatory currents were obtained while presenting 10 s of stationary gratings alternating with 10 s of forward moving gratings. Zoomed-in view of highlighted region is shown on the right. Shaded areas represent timing of moving gratings presentation. (B) Recording from the same motor neuron as in (A) after subsequent application of D1-like-R agonist. (C) Left, voltage-clamp recordings (holding potential Vh = +10 mV) of inhibitory currents were obtained while presenting 10 s of stationary gratings alternating with 10 s of forward moving gratings. Zoomed-in view of the highlighted region is shown on the right. Shaded areas represent timing of moving gratings presentation. (D) Recording from the same motor neuron as in (C) after subsequent application of D1-like-R agonist. (E) Summary data for excitatory drive. NPrimary=8 cells from 8 larvae, NSecondary= 7 cells from 7 larvae; Wilcoxon signed-rank test; *p<0.05. (F) Summary data for inhibitory drive. NPrimary=7 cells from 7 larvae, NSecondary= 4 cells from 4 larvae; Wilcoxon signed-rank test; p=0.36. See also Figure S3.

Comment in

References

    1. McLean DL, Fan J, Higashijima S, Hale ME, Fetcho JR. A topographic map of recruitment in spinal cord. Nature. 2007;446:71. - PubMed
    1. McLean DL, Masino MA, Koh IYY, Lindquist WB, Fetcho JR. Continuous shifts in the active set of spinal interneurons during changes in locomotor speed. Nature Neuroscience. 2008;11:1419. - PMC - PubMed
    1. Bellardita C, Kiehn O. Phenotypic Characterization of Speed-Associated Gait Changes in Mice Reveals Modular Organization of Locomotor Networks. Current Biology. 2015;25:1426–1436. - PMC - PubMed
    1. Gosgnach S, Lanuza GM, Butt SJB, Saueressig H, Zhang Y, Velasquez T, Riethmacher D, Callaway EM, Kiehn O, Goulding M. V1 spinal neurons regulate the speed of vertebrate locomotor outputs. Nature. 2006;440:215–219. - PubMed
    1. Zhong G, Sharma K, Harris-Warrick RM. Frequency-dependent recruitment of V2a interneurons during fictive locomotion in the mouse spinal cord. Nature Communications. 2011;2:274. - PMC - PubMed

Publication types

LinkOut - more resources