. 2020 Apr 6;30(7):1231-1244.e4.
doi: 10.1016/j.cub.2020.01.065. Epub 2020 Feb 20.

Biofilm Bacteria Use Stress Responses to Detect and Respond to Competitors

Affiliations

Biofilm Bacteria Use Stress Responses to Detect and Respond to Competitors

Bram Lories et al. Curr Biol. .

Abstract

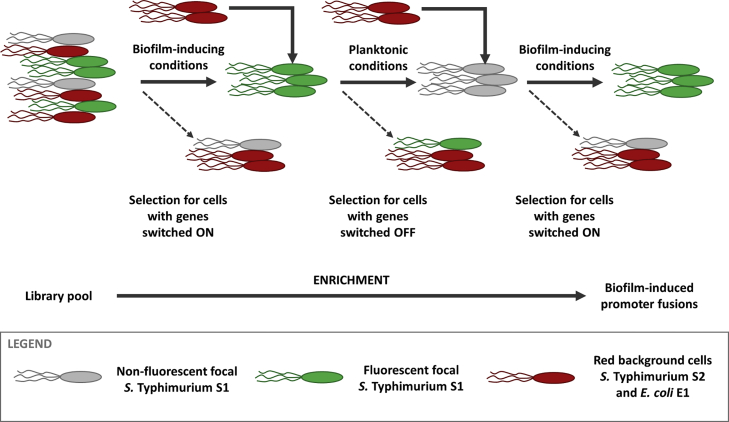
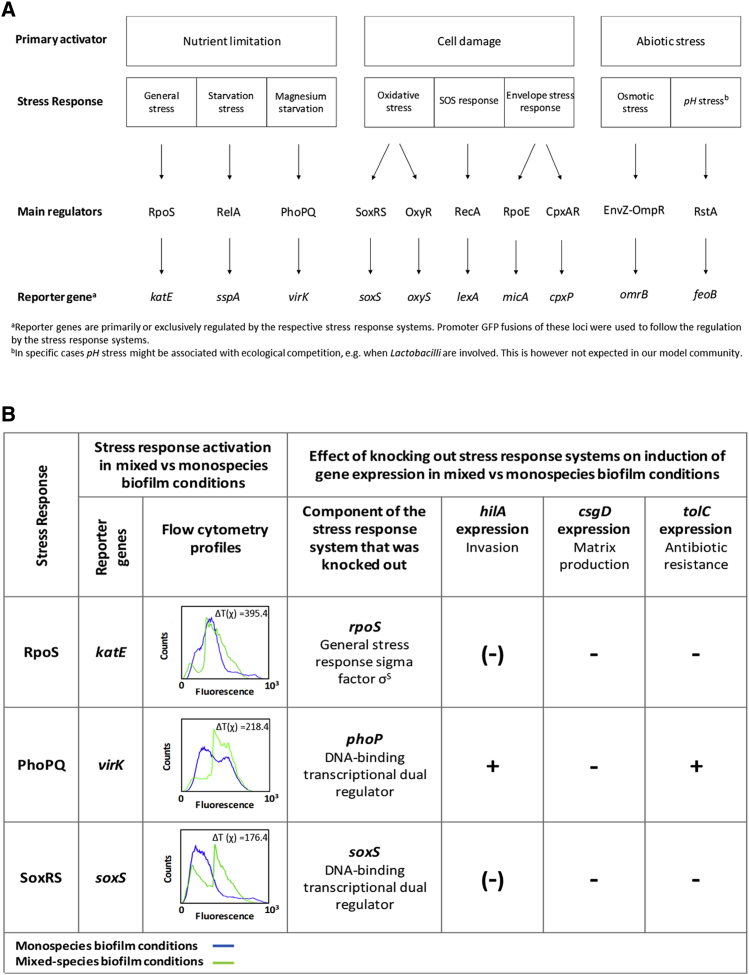
Bacteria use complex regulatory networks to cope with stress, but the function of these networks in natural habitats is poorly understood. The competition sensing hypothesis states that bacterial stress response systems can serve to detect ecological competition, but studying regulatory responses in diverse communities is challenging. Here, we solve this problem by using differential fluorescence induction to screen the Salmonella Typhimurium genome for loci that respond, at the single-cell level, to life in biofilms with competing strains of S. Typhimurium and Escherichia coli. This screening reveals the presence of competing strains drives up the expression of genes associated with biofilm matrix production (CsgD pathway), epithelial invasion (SPI1 invasion system), and, finally, chemical efflux and antibiotic tolerance (TolC efflux pump and AadA aminoglycoside 3-adenyltransferase). We validate that these regulatory changes result in the predicted phenotypic changes in biofilm, mammalian cell invasion, and antibiotic tolerance. We further show that these responses arise via activation of major stress responses, providing direct support for the competition sensing hypothesis. Moreover, inactivation of the type VI secretion system (T6SS) of a competitor annuls the responses to competition, indicating that T6SS-derived cell damage activates these stress response systems. Our work shows that bacteria use stress responses to detect and respond to competition in a manner important for major phenotypes, including biofilm formation, virulence, and antibiotic tolerance.

Keywords: Salmonella; antibiotic tolerance; biofilm; competition; competition sensing; epithelial invasion; microbial ecology; stress response systems.


Conflict of interest statement

Declaration of Interests The authors declare no competing interests.

Figures

Figure 1
Figure 1
The Mixed-Species Biofilm Model Is Characterized by Competitive Interactions (A) Confocal micrograph of the mixed-species biofilm model containing wild-type S. Typhimurium strains S1 (green) and S2 (red) and E. coli strain E1 (blue). All strains are present in similar amounts, indicating the absence of competitive exclusion (Zeiss confocal laser scanning microscope [LSM 700], with digital camera [AxioCam MRm], and the associated Zen 2011 software). S1, S2, and E1 were labeled with plasmid-encoded constitutive GFPmut3, dsRed.T4, and BFP, respectively. (B) Cell number of each strain in single-strain, two-strain, and three-strain biofilms. The cell number of each strain is greatly reduced in mixed culture as compared to monoculture, indicating strong competition between the strains. The total number of cells expected for cooperation between strains is at minimum equal to the sum of the cells in monoculture and is indicated with orange circles [8]. S1 accounted for around 30% of the biofilm cells, which is sufficient for DFI analysis. Three different biological repeats and their average are shown. p values are derived from two-tailed Student’s t test using Welch’s correction if SDs are significantly (p < 0.05) different. To differentiate between the strains, S1 was labeled with constitutive GFPmut3 on a plasmid, although S2 and E1 were labeled with plasmid-encoded constitutive dsRed.T4. Differences in colony shape and size allowed differentiation between S2 and E1 during CFU counting. The fluorescent protein markers did not influence the experimental outcome (Figure S1A). (C) The complementarity effect of mixed-species cultures. The mixed-species biofilm model, as well as the pairwise combination of S1 and S2, show negative complementarity, indicating that, besides resource competition, also physical or chemical interference occurs in these communities [12, 25]. Five different biological repeats and their average are shown. p values are derived from two-tailed Student’s t test using Welch’s correction if SDs are significantly (p < 0.05) different. See also Figure S1.
Figure 2
Figure 2
Differential Fluorescence Induction (DFI) Enriches for Promoters Specifically Expressed in the Mixed-Species Biofilm Model The DFI protocol allows to enrich the Salmonella Typhimurium SL1344 (S1) promoter trap library (20,500 gfpmut3 fusions) for promoters specifically expressed in the mixed-species biofilm model. S1 wild-type cells were alternatively subjected to biofilm-inducing and planktonic mixed-species growth conditions. In a first positive selection step, S1 was grown in mixed-species biofilm conditions, where only S1 cells with higher green fluorescence compared to a pre-determined biologically relevant threshold value were sorted with FACS. The subpool of sorted cells was subsequently amplified by overnight growth in lysogeny broth and subjected to mixed-species planktonic conditions to exclude constitutively expressed genes from the subpool. In this negative selection round, only non-fluorescent cells were sorted and amplified. A second positive selection round in mixed-species biofilm conditions resulted in a final subpool of S1 cells with plasmids containing DNA fragments with promoters that are specifically switched on in the mixed-species biofilm compared to mixed-species planktonic conditions. See also Figure S2.
Figure 3
Figure 3
Mixed Culture Drives Up Expression of Genes Involved in Biofilm Matrix Production, Epithelial Invasion, and Antibiotic Tolerance FACS profiles of S. Typhimurium SL1344 (S1) genes induced by competition, with functions related to biofilm matrix production (csgB and csgD), epithelial invasion (hilC, invF, hilA, and prgH), and antibiotic resistance (aadA and tolC). Five of these genes were identified in the DFI screening (csgB, hilC, invF, aadA, and tolC). The other genes were selected based on knowledge of the regulatory networks. Gene expression in S1 was measured by promoter GFP fusions and FACS under four conditions: monospecies planktonic (red line); monospecies biofilm (blue line); mixed-species planktonic (black line); and mixed-species biofilm (green line). The FACS profiles show the population distribution of fluorescence in S1 under the different conditions. In each condition, 100,000 S1 cells were analyzed. Data were analyzed by using the FlowJo software and probability binning, as described in STAR Methods. For significant differences between populations (T(χ) > T(χ) minimum), the ΔT(χ) values are displayed. Additionally, in each pathway, the increased expression of a central regulator (csgD, hilA, and tolC) was confirmed using a more strict T(χ) specific based on the 95% confidence interval of T(χ) of that specific reporter gene in the condition with the highest variation (n = 10). One representative repeat of at least two independent biological repeats is shown. See also Figures S2 and S3.
Figure 4
Figure 4
Phenotypic Assays Confirm the Regulatory Responses to Mixed Culture (A) Biofilm formation: ratio of the observed amount of biofilm (as measured by crystal violet staining) in mixed- species biofilms compared to the expected amount (STAR Methods). Biofilm production is higher than expected, confirming the biofilm response to competition. Five biological repeats and their average are shown. p values derived from one-sample t test for “greater than 1” (n = 5). (B) Invasion of Caco-2 cells: the FACS profiles show the number of invaded Caco-2 cells after exposure to fluorescently labeled S1 under monospecies (red lines) and mixed-species conditions (black lines). For each condition, the fluorescence of 10,000 Caco-2 cells was measured. The fluorescence level is determined by the number of invaded S1 cells. Only fluorescent, invaded cells are shown. Full lines represent invasion by wild-type S1 cell; dotted lines represent invasion by the isogenic ΔhilA mutant. A higher number of fluorescent Caco-2 cells were counted after invasion by wild-type S1 in mixed-species versus monospecies conditions, confirming that the strain interactions can trigger epithelial invasion by S1. The S1 ΔhilA mutant is strongly affected in invasion, confirming the need of a functional SPI1 system for Caco-2 cell invasion under the conditions tested. One repeat representative of four independent biological repeats is shown. (C) Tolerance against gentamicin: survival of S1 after 1 h incubation of pre-formed monospecies and mixed-species biofilms in the presence of 200 μM gentamicin. Survival of S1 wild-type is more than 5 times higher in mixed-species compared to monospecies conditions. This effect is abrogated in an S1 ΔtolC mutant. Three biological repeats and their average are shown. p values are derived from two-tailed Student’s t test using Welch’s correction if SDs are significantly (p < 0.05) different. See also Figure S4.
Figure 5
Figure 5
The Response to Competition Is Mediated by Stress Responses (A) Classification of stress response systems in S1 according to their primary activator. In specific cases, pH stress might be associated with competition, e.g., when Lactobacilli are involved. This is, however, not expected in our model community. Reporter genes are primarily or exclusively regulated by the respective stress response systems: katE [59]; sspA [60]; virK [61]; soxS [62]; oxyS [63]; lexA [64]; micA [65]; cpxP [66]; omrB [67]; and feoB [68]. Promoter GFP fusions of these loci were used to follow the regulation by the stress response systems. (B) Expression of reporter genes for stress response systems (left) and effect of knocking out crucial components of each of these systems on the induction of csgD (matrix production), hilA (invasion), and tolC (antibiotic resistance) in the mixed-species compared to monospecies biofilms (right). FACS analysis showed that reporter genes for the general stress response system mediated by RpoS (reporter gene katE), the PhoPQ system (reporter gene virK), and oxidative stress response system SoxRS (reporter gene soxS) were induced in mixed-species biofilm (green line) compared to monospecies biofilm (blue line) conditions (probability binning indicates that T(χ) > T(χ) minimum). Positive hits (katE, virK, and soxS) were confirmed using a more strict T(χ) specific based on the 95% confidence interval of each reporter gene in the condition with the most variation (n = 10). The ΔT(χ) = T(χ) − T(χ) specific is displayed. The symbols indicate the effect of knocking out the stress response systems on the induction of matrix (csgD), SPI1 invasion (hilA), and antibiotic resistance (tolC) in mixed versus monospecies biofilms: “−,” the induction is completely abolished in the stress response mutant; “(−),” the induction is partially abolished in the mutant, “+,” the response is still present in the mutant. One representative repeat of at least three independent biological repeats is shown. See also Figures S5 and S6.
Figure 6
Figure 6
Inactivation of the T6SS in S2 Significantly Reduces the Inhibition of S1, the Level of Total Interference Competition, and the Competitive Response of S1 (A) The biofilm cell counts of S1 in the presence of a community containing either the S2 wild-type or the S2 ΔT6SS deletion mutant. S1 is inhibited to a lower extent by the presence of the other strains if the T6SS of S2 is inactivated. p values are derived from two-tailed Student’s t test using Welch’s correction if SDs are significantly (p < 0.05) different. (B) The complementarity effect of mixed-species cultures. The mixed-species biofilm model, as well as the pairwise combination of S1 and S2, no longer show negative complementarity when the T6SS of S2 is inactivated. Five different biological repeats and their average are shown. p values are derived from two-tailed Student’s t test using Welch’s correction if SDs are significantly (p < 0.05) different. (C) The expression of stress response reporters katE, virK, and soxS and phenotypic reporters csgD (matrix production), hilA (virulence), and tolC (antibiotic resistance) in S1 when grown in monospecies conditions (blue) and in the presence of competitors with (green) and without functional T6SS (orange). The FACS profiles show the population distribution of fluorescence in S1 under the different conditions. In each condition, 100,000 S1 cells were analyzed. Data were analyzed by using the FlowJo software and probability binning. Significant differences (T(χ) > T(χ) specific) between mixed-species populations containing S2 wild-type (WT) and S2 ΔT6SS are indicated with a green ΔT value; significant differences (T(χ) > T(χ) specific) between mixed-species populations containing S2 ΔT6SS and monospecies populations of S1 WT are indicated with a blue ΔT value. The T(χ) specific is adapted for each specific reporter gene based on the 95% confidence interval of T(χ) of that reporter gene in the condition with the highest variation (n = 10). One representative repeat of at least two independent biological repeats is shown. See also Figures S6 and S7.

Comment in

References

    1. Costerton J.W., Stewart P.S., Greenberg E.P. Bacterial biofilms: a common cause of persistent infections. Science. 1999;284:1318–1322. - PubMed
    1. Davies D. Understanding biofilm resistance to antibacterial agents. Nat. Rev. Drug Discov. 2003;2:114–122. - PubMed
    1. Nadell C.D., Drescher K., Foster K.R. Spatial structure, cooperation and competition in biofilms. Nat. Rev. Microbiol. 2016;14:589–600. - PubMed
    1. Oliveira N.M., Martinez-Garcia E., Xavier J., Durham W.M., Kolter R., Kim W., Foster K.R. Biofilm formation as a response to ecological competition. PLoS Biol. 2015;13:e1002191. - PMC - PubMed
    1. Elias S., Banin E. Multi-species biofilms: living with friendly neighbors. FEMS Microbiol. Rev. 2012;36:990–1004. - PubMed

Publication types

MeSH terms

LinkOut - more resources