. 2020 Feb 18;9(2):464.
doi: 10.3390/cells9020464.

Characterizing the Retinal Phenotype in the High-Fat Diet and Western Diet Mouse Models of Prediabetes

Affiliations

Characterizing the Retinal Phenotype in the High-Fat Diet and Western Diet Mouse Models of Prediabetes

Bright Asare-Bediako et al. Cells. .

Abstract

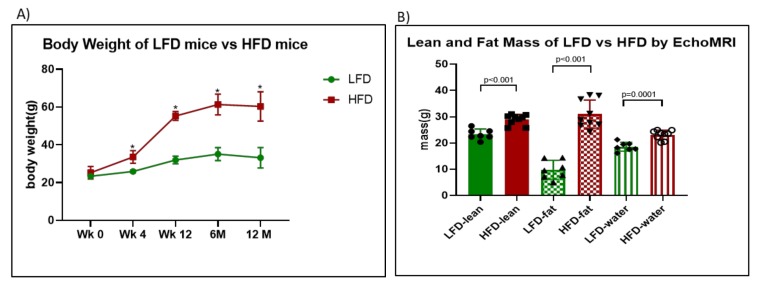
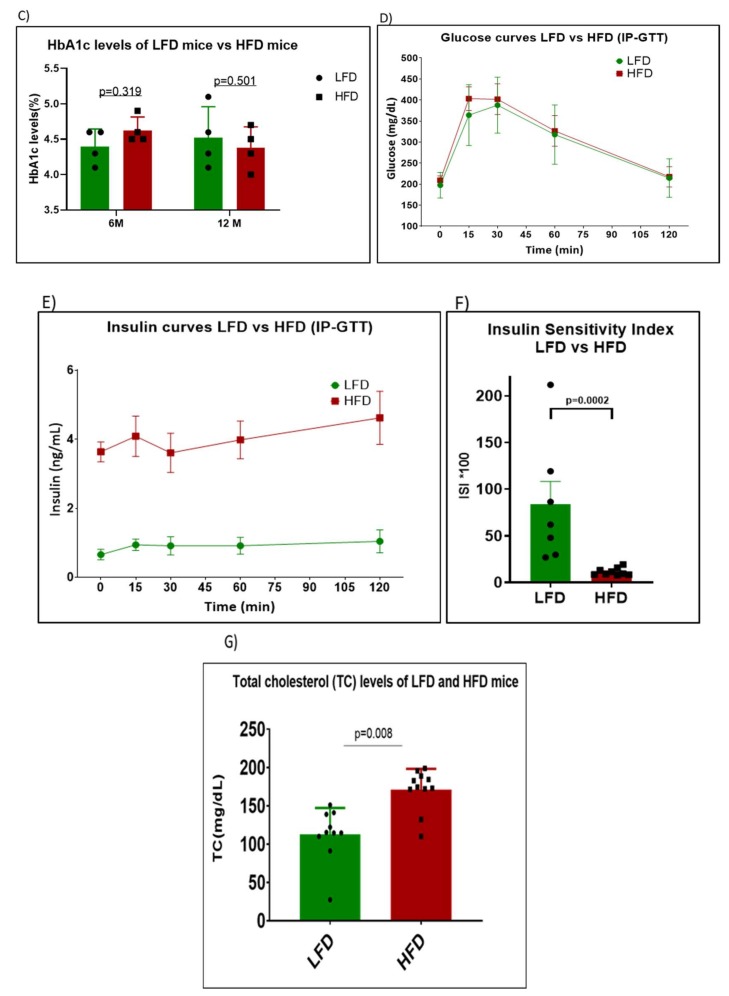
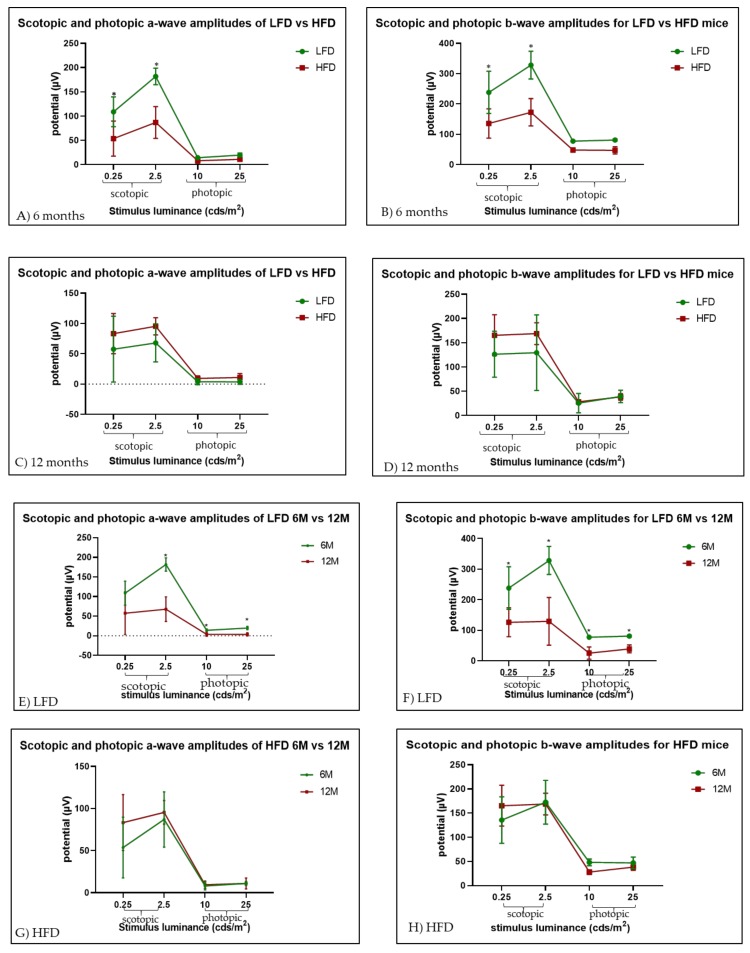
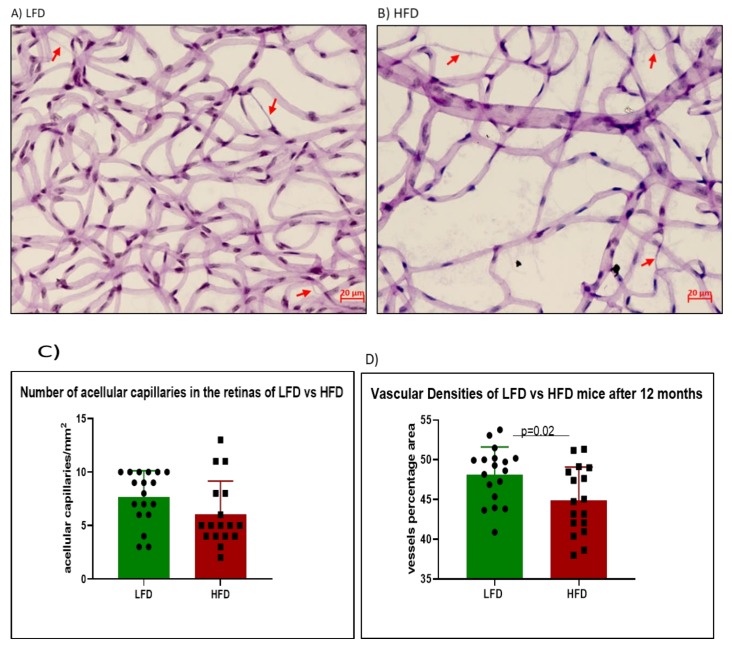
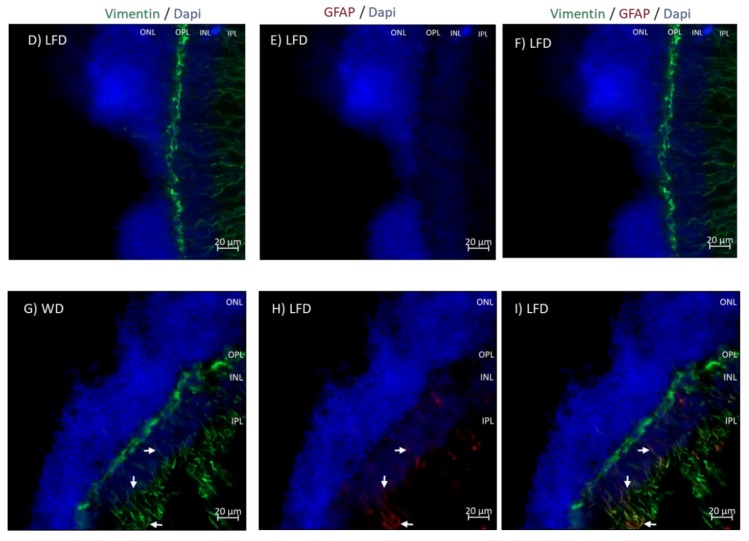
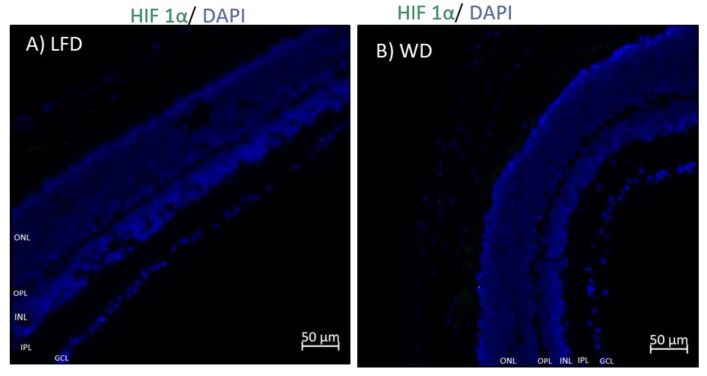
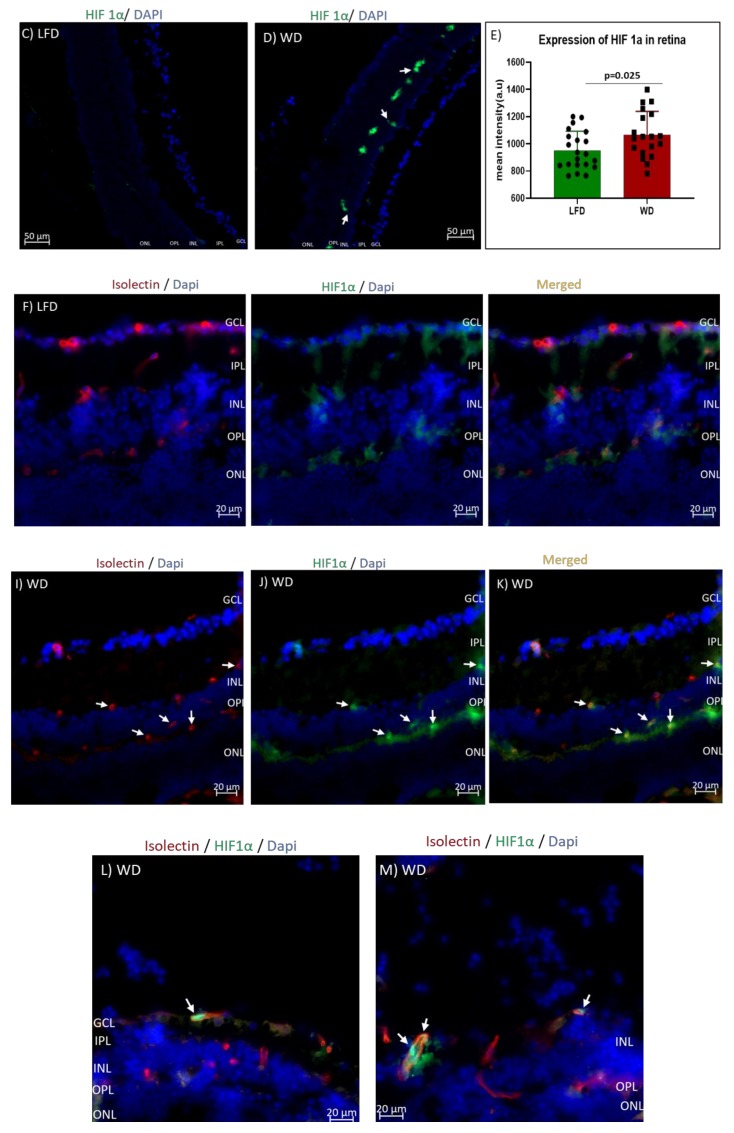
We sought to delineate the retinal features associated with the high-fat diet (HFD) mouse, a widely used model of obesity. C57BL/6 mice were fed either a high-fat (60% fat; HFD) or low-fat (10% fat; LFD) diet for up to 12 months. The effect of HFD on body weight and insulin resistance were measured. The retina was assessed by electroretinogram (ERG), fundus photography, permeability studies, and trypsin digests for enumeration of acellular capillaries. The HFD cohort experienced hypercholesterolemia when compared to the LFD cohort, but not hyperglycemia. HFD mice developed a higher body weight (60.33 g vs. 30.17g, p < 0.0001) as well as a reduced insulin sensitivity index (9.418 vs. 62.01, p = 0.0002) compared to LFD controls. At 6 months, retinal functional testing demonstrated a reduction in a-wave and b-wave amplitudes. At 12 months, mice on HFD showed evidence of increased retinal nerve infarcts and vascular leakage, reduced vascular density, but no increase in number of acellular capillaries compared to LFD mice. In conclusion, the HFD mouse is a useful model for examining the effect of prediabetes and hypercholesterolemia on the retina. The HFD-induced changes appear to occur slower than those observed in type 2 diabetes (T2D) models but are consistent with other retinopathy models, showing neural damage prior to vascular changes.

Keywords: neural infarcts; retinal phenotype; vascular leakage.


Conflict of interest statement

The authors declare no conflict of interest.

Figures

Figure 1
Figure 1
Body weight, glucose levels, and insulin sensitivity of high-fat diet (HFD) mice vs. low-fat diet (LFD) mice. (A) Body weights as measured for mice on LFD (green) and HFD (red) for 12 months. (* p < 0.000001; n = 6). (B) Lean mass, fat mass and water content of LFD mice vs. HFD mice. (C) Glycated hemoglobin (HbA1c) levels measured for the mice after 6 months and 12 months. (DG) Glucose curves (p > 0.46 for all time points), insulin curves (p < 0.0018 for all time points), insulin sensitivity index, and total cholesterol levels for LFD mice vs. HFD mice, respectively, following intraperitoneal glucose tolerance test (IP-GTT) after 12 months of feeding.
Figure 1
Figure 1
Body weight, glucose levels, and insulin sensitivity of high-fat diet (HFD) mice vs. low-fat diet (LFD) mice. (A) Body weights as measured for mice on LFD (green) and HFD (red) for 12 months. (* p < 0.000001; n = 6). (B) Lean mass, fat mass and water content of LFD mice vs. HFD mice. (C) Glycated hemoglobin (HbA1c) levels measured for the mice after 6 months and 12 months. (DG) Glucose curves (p > 0.46 for all time points), insulin curves (p < 0.0018 for all time points), insulin sensitivity index, and total cholesterol levels for LFD mice vs. HFD mice, respectively, following intraperitoneal glucose tolerance test (IP-GTT) after 12 months of feeding.
Figure 2
Figure 2
Assessment of retinal function of LFD mice versus HFD mice by electroretinogram (ERG). The amplitudes of a-waves and b-waves were assessed under both scotopic and photopic conditions for LFD mice and HFD mice after 6 months (A,B) and 12 months (C,D). LFD mice showed a significant reduction in retinal response between 6 months and 12 months of feeding (E,F), but HFD mice did not (G,H); (n = 4 for both groups).
Figure 3
Figure 3
Assessment of retinal lesions by fundus photography (A,B) and vascular leakage by fluorescein angiography (C,D). HFD mice developed more neural infarcts ((A,B), white arrows) than LFD mice. No infarct was observed for LFD after 6 months (A). However, vascular leakage was observed in HFD mice after 12 months of feeding ((D), white arrows).
Figure 4
Figure 4
Enumeration of acellular capillaries in LFD and HFD mice after 12 months of feeding. Red arrows indicate acellular capillaries in the retinas of LFD (A) and HFD (B) mice. There was no significant difference in the number of acellular capillaries between both groups (C) (p = 0.086). However, HFD retinas showed lesser vascular densities compared to LFD retinas (D).
Figure 5
Figure 5
Retinal glial fibrillary acidic protein (GFAP) expression after 6 months of feeding. Some Muller cells in Western diet (WD) retinas express GFAP (A,C, white arrows), but not in LFD (A,B), indicating that the impact of WD is not uniform across all Muller cells. Co-localization with Vimentin, a known Mueller cell marker, showed increased expression of GFAP in some Mueller cells in WD mice (GI) but not in LFD mice (DF).
Figure 5
Figure 5
Retinal glial fibrillary acidic protein (GFAP) expression after 6 months of feeding. Some Muller cells in Western diet (WD) retinas express GFAP (A,C, white arrows), but not in LFD (A,B), indicating that the impact of WD is not uniform across all Muller cells. Co-localization with Vimentin, a known Mueller cell marker, showed increased expression of GFAP in some Mueller cells in WD mice (GI) but not in LFD mice (DF).
Figure 6
Figure 6
Retinal hypoxia-inducible factor 1 alpha (HIF-1α) expression after 3 and 6 months of WD feeding. There was increased expression of HIF-1α in WD retinas (D, white arrows) compared to LFD retinas (C), as shown by quantification (E). Also, there was no significant difference in expression of HIF-1α after 3 months of feeding (A,B). Co-localization with isolectin, a known vascular endothelial cell marker, showed increased expression of HIF-1α in some endothelial cells in WD mice (IK) but not in LFD mice (FH). (L,M) Magnified merged images from two different WD samples.
Figure 6
Figure 6
Retinal hypoxia-inducible factor 1 alpha (HIF-1α) expression after 3 and 6 months of WD feeding. There was increased expression of HIF-1α in WD retinas (D, white arrows) compared to LFD retinas (C), as shown by quantification (E). Also, there was no significant difference in expression of HIF-1α after 3 months of feeding (A,B). Co-localization with isolectin, a known vascular endothelial cell marker, showed increased expression of HIF-1α in some endothelial cells in WD mice (IK) but not in LFD mice (FH). (L,M) Magnified merged images from two different WD samples.
Figure 7
Figure 7
Retinal liver X receptor beta (LXRβ) expression after 3 and 6 months of feeding. After 3 months of either WD or LFD feeding, there was significant reduction in the expression of LXRβ in only the ganglion cell layer of WD mice (B) compared to LFD mice (A). However, after 6 months of feeding, there was reduced expression of LXRβ in the ganglion cell layer as well as inner and outer nuclear layers of WD mice (E, white arrows) compared to LFD mice (D). Quantification of LXR in the inner nuclear layer (INL) and outer nuclear layer (ONL) at 3 months shows reductions in the ganglion cell (GC) layer (C). At 6 months, reductions are seen in the INL, ONL, and ganglion cell (GC) layer of the WD-fed mice when compared to LFD mice.

Similar articles

Cited by

References

    1. Cho N., Shaw J., Karuranga S., Huang Y., Fernandes J.D.R., Ohlrogge A., Malanda B. IDF Diabetes Atlas: Global estimates of diabetes prevalence for 2017 and projections for 2045. Diabetes Res. Clin. Pr. 2018;138:271–281. doi: 10.1016/j.diabres.2018.02.023. - DOI - PubMed
    1. Chatterjee S., Khunti K., Davies M.J. Type 2 diabetes. Lancet. 2017;389:2239–2251. doi: 10.1016/S0140-6736(17)30058-2. - DOI - PubMed
    1. Busik J.V., Tikhonenko M., Bhatwadekar A., Opreanu M., Yakubova N., Caballero S., Player D., Nakagawa T., Afzal A., Kielczewski J., et al. Diabetic retinopathy is associated with bone marrow neuropathy and a depressed peripheral clock. J. Exp. Med. 2009;206:2897–2906. doi: 10.1084/jem.20090889. - DOI - PMC - PubMed
    1. Turner R.C., Cull C.A., Frighi V., Holman R.R., UK Prospective Diabetes Study (UKPDS) Group Glycemic Control With Diet Sulfonylurea, Metformin, or Insulin in Patients with Type 2 Diabetes MellitusProgressive Requirement for Multiple Therapies (UKPDS 49) JAMA. 1999;281:2005. doi: 10.1001/jama.281.21.2005. - DOI - PubMed
    1. Yao Z., Gu Y., Zhang Q., Liu L., Meng G., Wu H., Xia Y., Bao X., Shi H., Sun S. Estimated daily quercetin intake and association with the prevalence of type 2 diabetes mellitus in chinese adults. Eur. J. Nutr. 2019;58:819–830. doi: 10.1007/s00394-018-1713-2. - DOI - PubMed

Publication types