

A Review of Data Analytic Applications in Road Traffic Safety. Part 1: Descriptive and Predictive Modeling
- PMID: 32085599
- PMCID: PMC7070501
- DOI: 10.3390/s20041107
A Review of Data Analytic Applications in Road Traffic Safety. Part 1: Descriptive and Predictive Modeling
Abstract
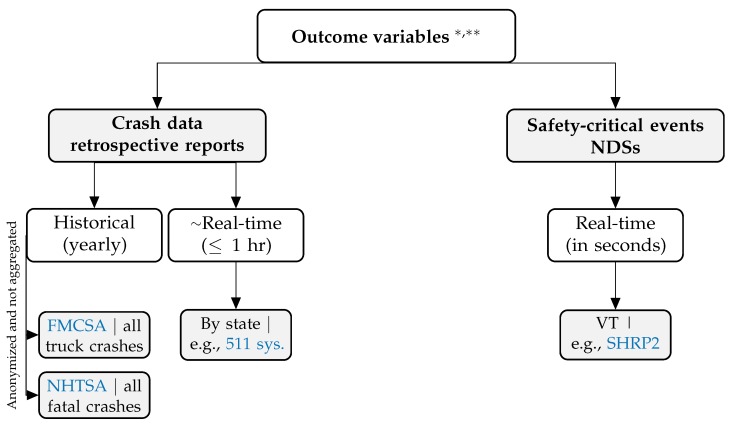
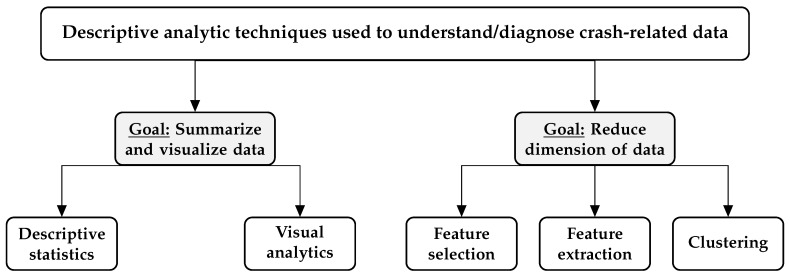
This part of the review aims to reduce the start-up burden of data collection and descriptive analytics for statistical modeling and route optimization of risk associated with motor vehicles. From a data-driven bibliometric analysis, we show that the literature is divided into two disparate research streams: (a) predictive or explanatory models that attempt to understand and quantify crash risk based on different driving conditions, and (b) optimization techniques that focus on minimizing crash risk through route/path-selection and rest-break scheduling. Translation of research outcomes between these two streams is limited. To overcome this issue, we present publicly available high-quality data sources (different study designs, outcome variables, and predictor variables) and descriptive analytic techniques (data summarization, visualization, and dimension reduction) that can be used to achieve safer-routing and provide code to facilitate data collection/exploration by practitioners/researchers. Then, we review the statistical and machine learning models used for crash risk modeling. We show that (near) real-time crash risk is rarely considered, which might explain why the optimization models (reviewed in Part 2) have not capitalized on the research outcomes from the first stream.
Keywords: crash risk modeling; data visualization; descriptive analytics; highway safety; predictive analytics.
Conflict of interest statement
The authors declare no conflict of interest.
Figures


References
-
- World Health Organization WHO | The Top 10 Causes of Death. [(accessed on 24 February 2019)]; Available online: http://www.who.int/en/news-room/fact-sheets/detail/the-top-10-causes-of-....
-
- National Highway Traffic Safety Administration, NHTSA U.S. DOT Announces 2017 Roadway Fatalities Down. [(accessed on 23 February 2019)]; Available online: https://www.nhtsa.gov/press-releases/us-dot-announces-2017-roadway-fatal....
-
- Insurance Institute for Highway Safety . The Insurance Institute for Highway Safety and the Highway Loss Data Institute; [(accessed on 24 February 2019)]. Fatality Facts—IIHS. Available online: http://www.iihs.org/iihs/topics/t/general-statistics/fatalityfacts/overv....
-
- World Health Organization WHO | Road Traffic Injuries. [(accessed on 22 April 2018)]; Available online: http://www.who.int/mediacentre/factsheets/fs358/en/
-
- Blincoe L., Miller T.R., Zaloshnja E., Lawrence B.A. The Economic and Societal Impact of Motor Cehicle Crashes, 2010 (Revised) U.S. Department of Transportation, National Highway Safety Administration, Report No.: DOT HS 812 013. [(accessed on 28 April 2018)]; Available online: https://crashstats.nhtsa.dot.gov/Api/Public/ViewPublication/812013.
Publication types
Grants and funding
- CMMI-1635927; CMMI-1634992/National Science Foundation
- PMIU0138 and PMIU0162/Ohio Supercomputer Center
- Advancing Safety Surveillance Using Individualized Sensor Technology (ASSIST)/American Society of Safety Engineers Foundation
- DTRT13-G-UTC48/Transportation Informatics Tier I University Transportation Center
LinkOut - more resources
Full Text Sources
