. 2020 Feb 18;21(4):1373.
doi: 10.3390/ijms21041373.

The ER Unfolded Protein Response Effector, ATF6, Reduces Cardiac Fibrosis and Decreases Activation of Cardiac Fibroblasts

Affiliations

The ER Unfolded Protein Response Effector, ATF6, Reduces Cardiac Fibrosis and Decreases Activation of Cardiac Fibroblasts

Winston T Stauffer et al. Int J Mol Sci. .

Abstract

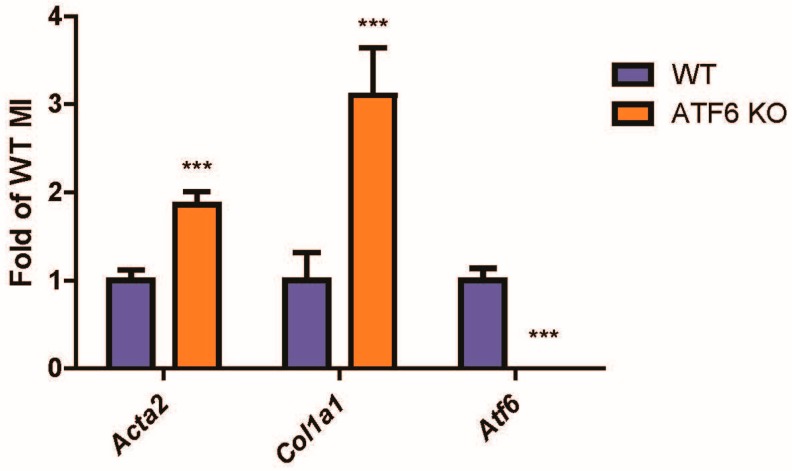
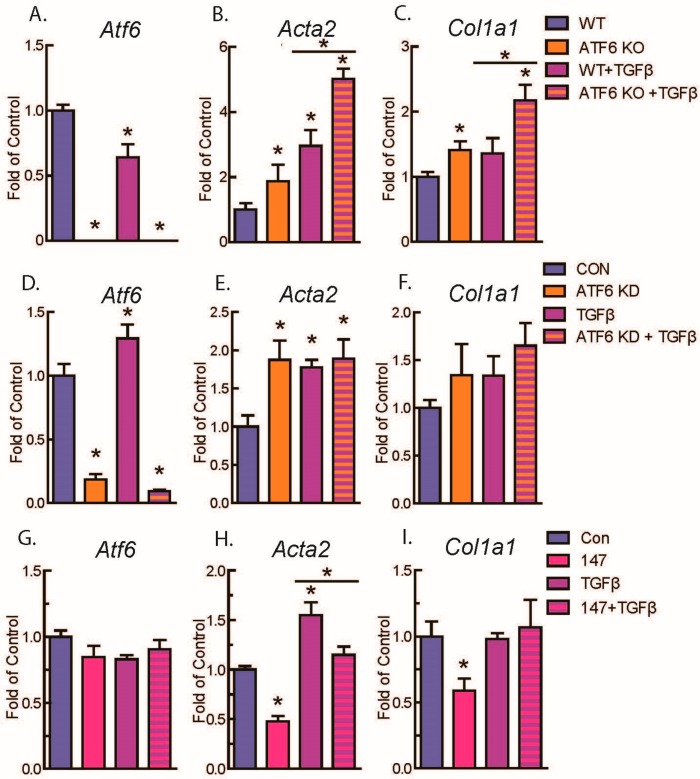
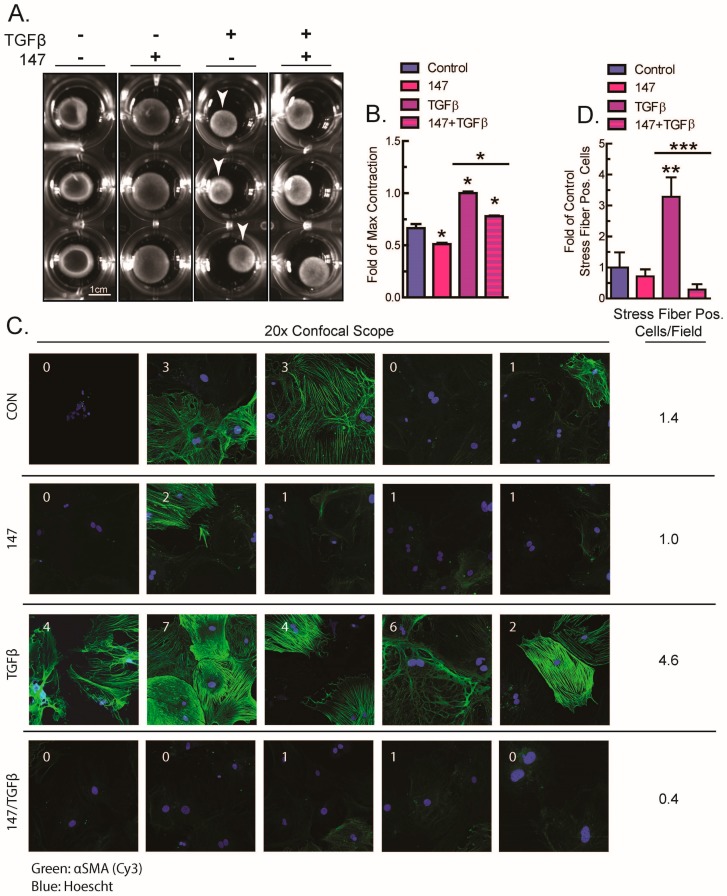
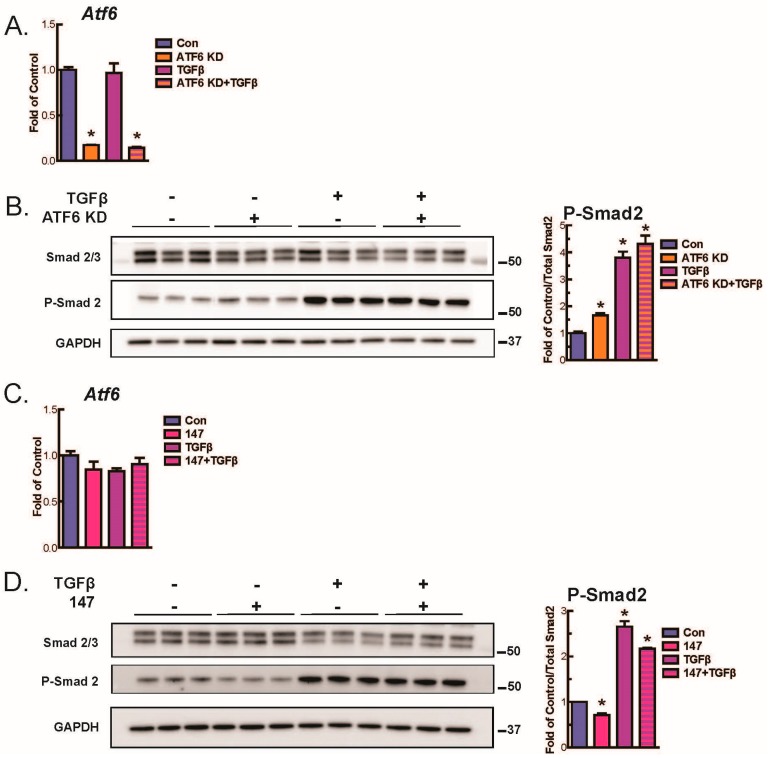
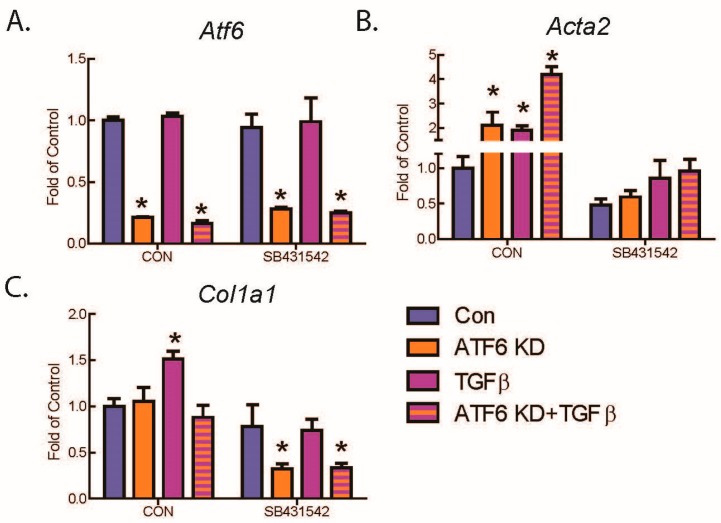
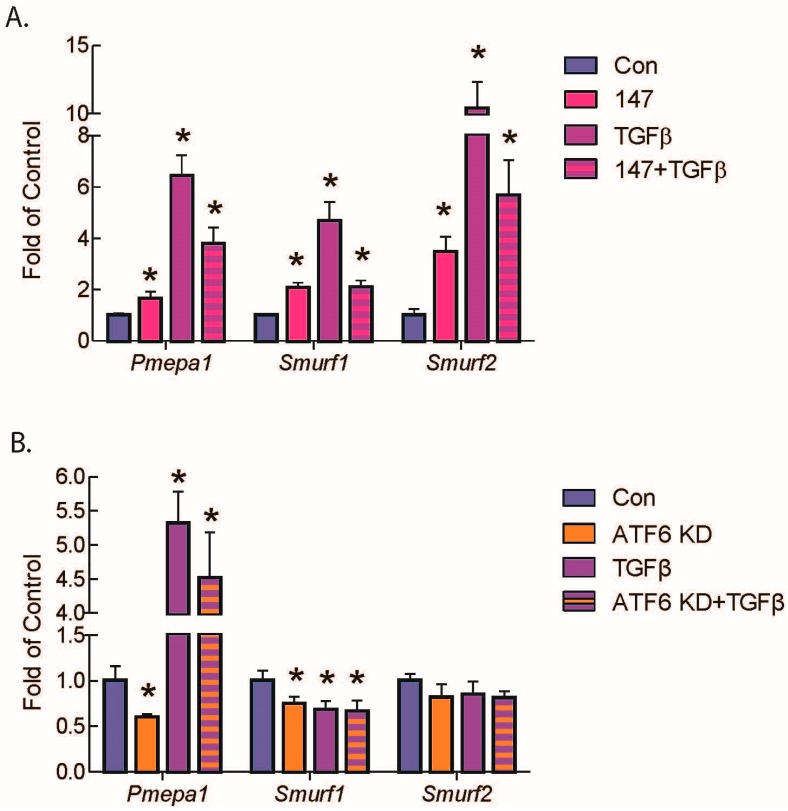
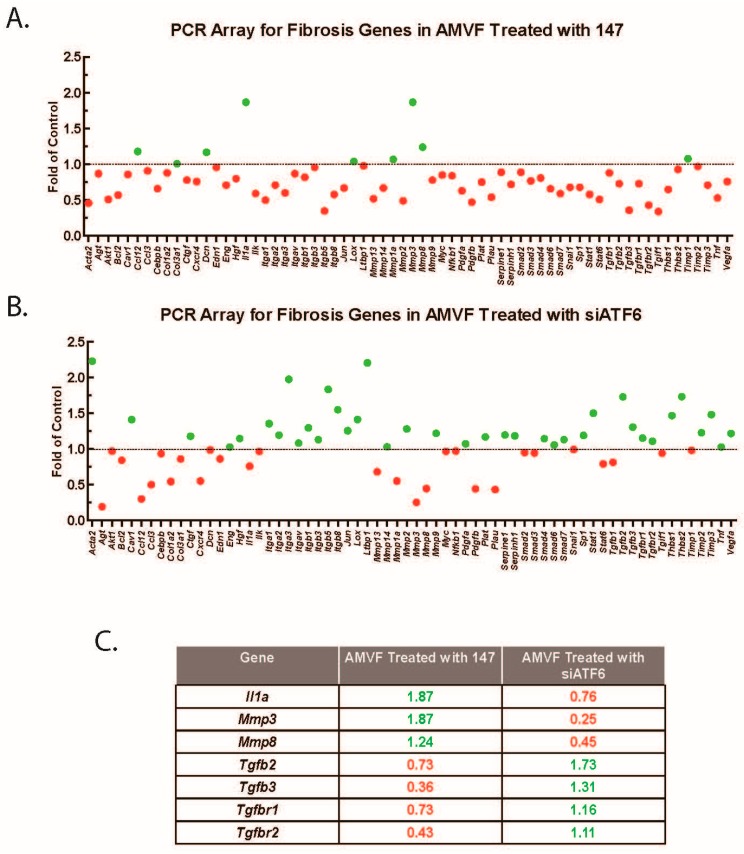
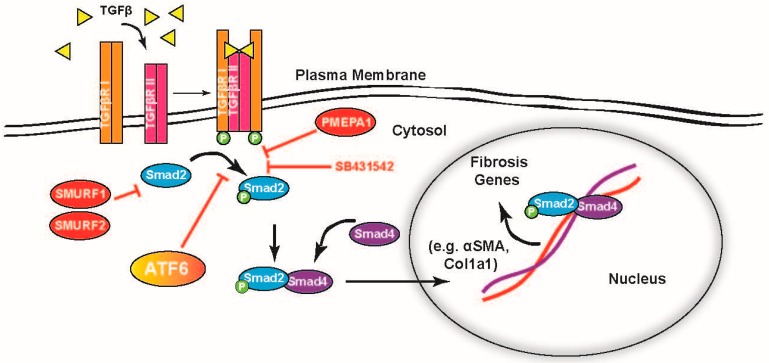
Activating transcription factor-6 α (ATF6) is one of the three main sensors and effectors of the endoplasmic reticulum (ER) stress response and, as such, it is critical for protecting the heart and other tissues from a variety of environmental insults and disease states. In the heart, ATF6 has been shown to protect cardiac myocytes. However, its roles in other cell types in the heart are unknown. Here we show that ATF6 decreases the activation of cardiac fibroblasts in response to the cytokine, transforming growth factor β (TGFβ), which can induce fibroblast trans-differentiation into a myofibroblast phenotype through signaling via the TGFβ-Smad pathway. ATF6 activation suppressed fibroblast contraction and the induction of α smooth muscle actin (αSMA). Conversely, fibroblasts were hyperactivated when ATF6 was silenced or deleted. ATF6 thus represents a novel inhibitor of the TGFβ-Smad axis of cardiac fibroblast activation.

Keywords: ATF6; ER stress; Smad; TGFβ; UPR; cardiac fibroblast; cardiac fibrosis; endoplasmic reticulum.


Conflict of interest statement

The authors declare no conflict of interest.

Figures

Figure 1
Figure 1
Markers of fibroblast activation in activating transcription factor-6 α (ATF6) knockout (KO) hearts of mice subjected to myocardial infarction (MI) surgery. Wild-type (WT) and ATF6 KO mice were subjected to permanent occlusion MI for one week. mRNA from infarcted regions in the hearts was then examined by qRT-PCR for genes indicative of cardiac fibroblast (CF) activation, α smooth muscle actin (αSMA) (Acta2) and collagen (Col1a1), as well as ATF6 (Atf6). *** p ≤ 0.001 significant difference from WT by Student’s t-test.
Figure 2
Figure 2
qRT-PCR of adult murine ventricular fibroblasts (AMVFs) with ATF6 gain- or loss-of-function. (AC) WT and ATF6 KO AMVFs were treated with ±10 ng/mL transforming growth factor β (TGFβ) for 48 h, then analyzed by qRT-PCR for Atf6, Acta2, and Col1a1. (DF) AMVFs from WT mouse hearts were treated with ±siRNA targeted to murine ATF6. Control (CON) and siRNA-treated cultures (ATF6 KD) were treated with ±10 ng/mL TGFβ, then analyzed by qRT-PCR for Atf6, Acta2, and Col1a1. (GI) AMVFs from WT mouse hearts were treated with ±10 μM compound 147, a pharmacological activator of ATF6. Control (CON) and 147-treated cultures (147) were co-treated with ±10 ng/mL TGFβ for 48 h, then analyzed by qRT-PCR for Atf6, Acta, and Col1a1. * p ≤ 0.05 by one-way ANOVA. * Indicates significant difference between a condition and control according to Newman–Keuls post-test unless there is a line over two bars, which indicates those two bars are being compared as part of the same post-test.
Figure 3
Figure 3
Effects of activating ATF6 on fibroblast contraction and stress fiber formation. (A,B) NIH 3T3 fibroblasts embedded in collagen gel disks were treated with ±10 μM compound 147, and then analyzed for contraction with ±10 ng/mL TGFβ after 48 h. Shown in (A) are examples of each culture and shown in (B) is the quantification of n = 3 cultures of each type, normalized to the cultures with maximum contraction (white arrows). (C,D) AMVFs from WT mice were treated with ±10 μM compound 147 and ±10 ng/mL TGFβ for 48 h, then analyzed by actin staining for stress fiber formation. All images in (C) were taken with a 20× objective on a confocal microscope. In (C) the number in each field represents the number of cells that were stress-fiber positive in that field. The number to the right is the average number of stress-positive cells per field. The number of stress-positive cells per field in (C) is quantified in (D), across n = 5 fields. * p ≤ 0.05 and ** p ≤ 0.01 by one-way ANOVA. *, ** Indicate significant difference between a condition and control according to Newman–Keuls post-test unless there is a line over two bars, which indicates those two bars are being compared as part of the same post-test.
Figure 4
Figure 4
Immunoblots investigating activation of canonical TGFβ signaling pathways. (A) AMVFs were treated with ±siRNA to ATF6, ±10 ng/mL TGFβ for 48 h. Atf6 knockdown is quantified via qPCR. (B) Immunoblotting for total Smad 2/3, P-Smad 2, or glyceraldehyde 3-phosphate dehydrogenase (GAPDH), with quantification of P-Smad 2 shown at right. (C) AMVFs were treated with ±10 μM compound 147, ±10 ng/mL TGFβ for 48 h. Atf6 levels were quantified via qPCR. (D) Immunoblotting for total Smad 2/3, P-Smad 2, or GAPDH, with quantification of P-Smad 2 shown at right. * p ≤ 0.05 by ANOVA. * Indicates significant difference between a condition and control according to Newman–Keuls post-test.
Figure 5
Figure 5
Effect of inhibiting the TGFβRI on ATF6 and TGFβ-mediated increases in fibroblast markers. AMVFs were treated with ±siRNA to ATF6, ±10 ng/mL TGFβ, ±10 μM of the TGFβRI inhibitor SB431542, and then analyzed by qRT-PCR for (A) Atf6, (B) Acta2, and (C) Col1a1. All treatments were for 48 h. * p ≤ 0.05 by one-way ANOVA. * Indicates significant difference between a condition and control according to Newman–Keuls post-test.
Figure 6
Figure 6
qRT-PCR of AMVFs treated with compound 147 or ATF6 knockdown and/or TGFβ. AMVFs were treated with (A) ±10 μM compound 147, ±10 ng/mL TGFβ, or (B) ±siRNA to ATF6, ±10 ng/mL TGFβ, then analyzed by qRT-PCR for Pmepa1, Smurf1, and Smurf2, as shown. All treatments were for 48 h. * p ≤ 0.05 by one-way ANOVA within each gene group. * Indicates significant difference between a condition and control according to Newman–Keuls post-test.
Figure 7
Figure 7
PCR array for fibrosis genes in AMVFs. AMVFs were treated with (A) ±10 μM compound 147 or (B) ±siRNA to ATF6; all cultures were treated for 48 h, then analyzed by a qRT-PCR array as described in the Methods (Section 4). In (A,B) green and red dots represent up- and downregulated genes, respectively. (C) A subset of differentially regulated genes from panels A and B; green and red numbers represent the fold up- or downregulation, respectively.
Figure 8
Figure 8
Representation of ATF6 acting on the TGFβ–Smad pathway for induction of fibrosis genes. TGFβ is a ligand for TGFβ receptor II, which upon binding forms a receptor complex with TGFβ receptor I, activating their kinase function. The TGFβ receptor complex phosphorylates receptor-Smads 2 and 3, which then complex with co-Smad 4 and move to the nucleus where they activate fibrosis genes (black arrows). These data suggest ATF6 activity inhibits the phosphorylation of the receptor-Smads at or before the level of the TGFβ chemical inhibitor SB431542 (red “T” arrows).

Similar articles

Cited by

References

    1. Pinto A.R., Ilinykh A., Ivey M.J., Kuwabara J.T., D’Antoni M.L., Debuque R., Chandran A., Wang L., Arora K., Rosenthal N.A., et al. Revisiting Cardiac Cellular Composition. Circ. Res. 2016;118:400–409. doi: 10.1161/CIRCRESAHA.115.307778. - DOI - PMC - PubMed
    1. Moore K.A., Hollien J. The unfolded protein response in secretory cell function. Annu. Rev. Genet. 2012;46:165–183. doi: 10.1146/annurev-genet-110711-155644. - DOI - PubMed
    1. Kaufman R.J., Scheuner D., Schroder M., Shen X., Lee K., Liu C.Y., Arnold S.M. The unfolded protein response in nutrient sensing and differentiation. Nat. Rev. Mol. Cell Biol. 2002;3:411–421. doi: 10.1038/nrm829. - DOI - PubMed
    1. Iwakoshi N.N., Lee A.H., Vallabhajosyula P., Otipoby K.L., Rajewsky K., Glimcher L.H. Plasma cell differentiation and the unfolded protein response intersect at the transcription factor XBP-1. Nat. Immunol. 2003;4:321–329. doi: 10.1038/ni907. - DOI - PubMed
    1. Jurkin J., Henkel T., Nielsen A.F., Minnich M., Popow J., Kaufmann T., Heindl K., Hoffmann T., Busslinger M., Martinez J. The mammalian tRNA ligase complex mediates splicing of XBP1 mRNA and controls antibody secretion in plasma cells. EMBO J. 2014;33:2922–2936. doi: 10.15252/embj.201490332. - DOI - PMC - PubMed

MeSH terms

LinkOut - more resources