. 2020 Feb 18;21(4):1385.
doi: 10.3390/ijms21041385.

TUBB Variants Underlying Different Phenotypes Result in Altered Vesicle Trafficking and Microtubule Dynamics

Affiliations

TUBB Variants Underlying Different Phenotypes Result in Altered Vesicle Trafficking and Microtubule Dynamics

Antonella Sferra et al. Int J Mol Sci. .

Abstract

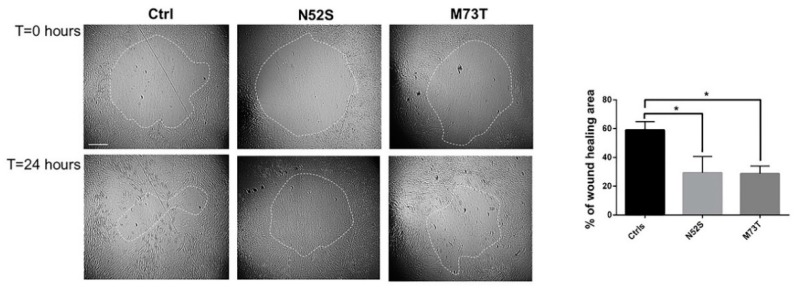
Tubulinopathies are rare neurological disorders caused by alterations in tubulin structure and function, giving rise to a wide range of brain abnormalities involving neuronal proliferation, migration, differentiation and axon guidance. TUBB is one of the ten β-tubulin encoding genes present in the human genome and is broadly expressed in the developing central nervous system and the skin. Mutations in TUBB are responsible for two distinct pathological conditions: the first is characterized by microcephaly and complex structural brain malformations and the second, also known as "circumferential skin creases Kunze type" (CSC-KT), is associated to neurological features, excess skin folding and growth retardation. We used a combination of immunocytochemical and cellular approaches to explore, on patients' derived fibroblasts, the functional consequences of two TUBB variants: the novel mutation (p.N52S), associated with basal ganglia and cerebellar dysgenesis, and the previously reported variant (p.M73T), linked to microcephaly, corpus callosum agenesis and CSC-KT skin phenotype. Our results demonstrate that these variants impair microtubule (MT) function and dynamics. Most importantly, our studies show an altered epidermal growth factor (EGF) and transferrin (Tf) intracellular vesicle trafficking in both patients' fibroblasts, suggesting a specific role of TUBB in MT-dependent vesicular transport.

Keywords: EGF transport; TUBB; microtubule dynamics; tubulinopathy.


Conflict of interest statement

The authors declare no conflict of interest. The funders had no role in the design of the study; in the collection, analyses, or interpretation of data; in the writing of the manuscript, or in the decision to publish the results.

Figures

Figure 1
Figure 1
Neuroimaging studies of the patients. (A) Brain MRI of patient 1 (N52S) at the age of 10: T1-weighted (a), T2-weighted (be) and FLAIR (f) images revealing a normal corpus callosum and lower vermis hypoplasia with an increased fourth ventricle (arrow in a and b) and absence of cortical dysplasia (c), but presence of dysplasia of the cerebellar folia in both vermis and hemispheres (arrows in a, b, d and e), basal ganglia anomalies (asymmetric and abnormal shaped lenticular and caudate nuclei, arrowheads in f) and lateral ventricle asymmetry with left prevalence and left occipital with matter reduction (arrow in f). (B) Brain MRI of patient 2 (M73T) at the age of 9: T2-weighted (a,b) and T1-weighted (c) images; severe cortical atrophy with absence of subcortical white matter is seen (ac), together with ex vacuo dilatation of the lateral ventricles, increased subarachnoid spaces and a thin corpus callosum (arrow in c). Mild hypoplasia of the lower cerebellar vermis (arrow in b) without dysplasia. The basal ganglia seem to be relatively spared. Note, moreover, a crease in the posterior neck (arrow in c).
Figure 2
Figure 2
N52S and M73T variants affect MT dynamics after nocodazole treatment. Patients’ fibroblasts were treated with nocodazole. After the substance was washed out, they were analyzed by immunofluorescence experiments to visualize the rate of microtubule growth. The microtubules were labeled with β-tubulin (green) and nuclei were labeled with Hoechst (blue). The scale bar represents 25 μm. The inserts are magnifications of the cells indicated by the arrows. The scale bar represents 10 μm.
Figure 3
Figure 3
N52S and M73T variants affect α-tubulin incorporation into MTs after nocodazole treatment. Patients’ fibroblasts were treated with nocodazole. After the substance was washed out, they were analyzed at different time points by immunofluorescence experiments to visualize the rate of microtubule growth. The microtubules were stained with α-tubulin (red) and the nuclei were stained with Hoechst (blue). The scale bar represents 10 μm. The inserts are magnifications of the cells indicated by the arrows. The scale bar represents 10 μm.
Figure 4
Figure 4
Confocal analysis of EGF transport in control and mutated fibroblasts. (A) Patients and control fibroblasts were incubated with Alexa fluor 488-labeled EGF and, after 20 min of internalization, were analyzed by confocal analysis to visualize the EGF localization. The nuclear region is delimited by the dotted circle. The scale bar represents 10 μm. (B) Higher magnifications. The nuclear region is delimited by the dotted circle. The scale bar represents 10 μm. (C) Quantification of EGF vesicles in the perinuclear region of patients and control fibroblasts after 20 min of internalization. (D) Quantification of the mean area of EGF vesicles (total area of EGF spots/area of the perinuclear region). Student’s t-test, * p ≤ 0.05, *** p ≤ 0.0005, ***** p ≤ 0.0001.
Figure 5
Figure 5
The effect on EGF transport is similar in nocodazole-treated control fibroblasts and untreated fibroblasts carrying TUBB mutations (A,B) Control fibroblasts were incubated with Alexa fluor 488-labeled EGF with or without nocodazole (Noc). After 20 min of internalization, they were analyzed by confocal analysis to visualize the EGF localization. The nuclear region is delimited by the dotted circle. The scale bar represents 10 μm. (B) Higher magnifications. The nuclear region is delimited by the dotted circle. The scale bar represents 10 μm. (C) Quantification of EGF vesicles in the perinuclear region of control fibroblasts after 20 min of internalization. (D) Quantification of the mean area of EGF vesicles (total area of EGF spots/area of the perinuclear region). Student’s t-test, **** p ≤ 0.0001.
Figure 6
Figure 6
Confocal analysis of Tf transport in control and mutated fibroblasts. (A,B) Patients and control fibroblasts were incubated with Alexa fluor 488-labeled Tf and, after 20 min of internalization, were analyzed by confocal analysis to visualize the Tf localization. The nuclear region is delimited by the dotted circle. The scale bar represents 10 μm. (B) Higher magnifications. The nuclear region is delimited by the dotted circle. The scale bar represents 10 μm. (C) Quantification of Tf vesicles in the perinuclear region of patients and control fibroblasts after 20 min of internalization. (D) Quantification of the mean area of Tf vesicles (total area of Tf spots/area of the perinuclear region). Student’s t-test, * p ≤ 0.05.
Figure 7
Figure 7
Study of cell motility in control and mutated fibroblasts. Cell migration ability of patient fibroblasts as compared with age-matched control cells, evaluated by in vitro migration assay. On the left, representative phase-contrast photographs of the gap closure taken at the indicated time intervals are shown. The gap areas are delimited by the dotted circles. The scale bar represents 400 μm. The results represent the mean ± SEM of three independent experiments, each performed at least in triplicate (total evaluated gaps n = 36 for control fibroblasts, using two different lines; n = 14 for N52S mutated fibroblasts, n = 16 for p.M73T mutated fibroblasts). Student’s t-test, * p ≤ 0.005.
Figure 8
Figure 8
Comparative mapping of TUBB mutations and structural modeling of the N52S mutation. (A) Multiple sequence alignment of tubulin beta chain proteins from different organisms around the site affected by the N52S amino acid change (invariant residues are grayed), and homology model of the human TUBB (N52 is indicated) in the complex with tubulin alpha-1B. In the wildtype inset, the contiguous phosphorylatable Y51 is shown. The mutant inset represents a modeled N52S amino acid replacement. (B) TUBB model (white ribbons) overlaid onto a microtubule, and amino acid sites affected by “neurological type” (red) and “Kunze type” (blue) variants. Of note, all “Kunze type” variants map near the GTP/ guanosine-5’-diphosphate (GDP) binding site (the bound GDP molecule is shown in yellow).

Similar articles

Cited by

References

    1. Fallet-Bianco C., Laquerrière A. Mutations in tubulin genes are frequent causes of various foetal malformations of cortical development including microlissencephaly. Acta Neuropathol. Commun. 2014;25:2–69. doi: 10.1186/2051-5960-2-69. - DOI - PMC - PubMed
    1. Chang B.S. Tubulinopathies and Their Brain Malformation Syndromes: Every TUB on Its Own Bottom. Epilepsy Curr. 2015;15:65–67. doi: 10.5698/1535-7597-15.2.65. - DOI - PMC - PubMed
    1. Romaniello R., Arrigoni F. Tubulin genes and malformations of cortical development. Eur. J. Med. Genet. 2018;61:744–754. doi: 10.1016/j.ejmg.2018.07.012. - DOI - PubMed
    1. Dent E.W., Gertler F.B. Cytoskeletal Dynamics and Transport in Growth Cone Motility and Axon Guidance. Neuron. 2003;40:209–227. doi: 10.1016/S0896-6273(03)00633-0. - DOI - PubMed
    1. Jaglin X.H., Chelly J. Tubulin-related cortical dysgeneses: Microtubule dysfunction underlying neuronal migration defects. Trend in Genetics. 2009;25:555–566. doi: 10.1016/j.tig.2009.10.003. - DOI - PubMed