. 2020 Aug;127(8):1043-1052.
doi: 10.1016/j.ophtha.2019.12.030. Epub 2020 Jan 13.

Ganglion Cell Complex Thickness and Macular Vessel Density Loss in Primary Open-Angle Glaucoma

Affiliations

Ganglion Cell Complex Thickness and Macular Vessel Density Loss in Primary Open-Angle Glaucoma

Huiyuan Hou et al. Ophthalmology. 2020 Aug.

Abstract

Purpose: To characterize the change rate of ganglion cell complex (GCC) thickness and macular vessel density in healthy, preperimetric glaucoma and primary open-angle glaucoma (POAG) eyes.

Design: Prospective, longitudinal study.

Participants: One hundred thirty-nine eyes (23 healthy eyes, 36 preperimetric glaucoma eyes, and 80 POAG eyes) of 94 patients who had at least 3 visits were included from the Diagnostic Innovations in Glaucoma Study. The mean follow-up was 2.0 years for healthy eyes, 2.6 years for preperimetric glaucoma eyes, and 2.6 years for POAG eyes.

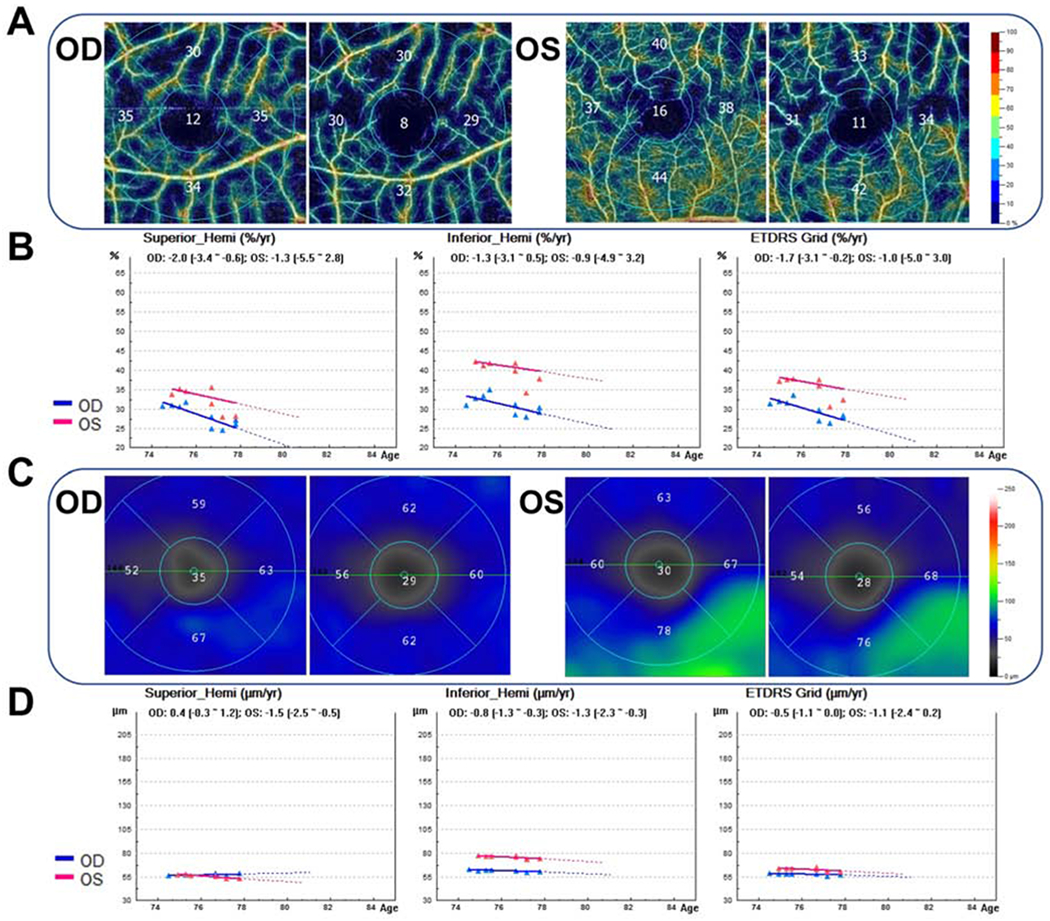
Methods: OCT angiography (OCTA)-based vessel density and OCT-based structural thickness of the same 3×3-mm2 GCC scan slab were evaluated. The dynamic range-based normalized rates of vessel density and thickness change were calculated and compared within each diagnostic group. The association between the rates of thickness and vessel density change and potential factors were evaluated.

Main outcome measures: The rates of GCC thinning and macular vessel density loss.

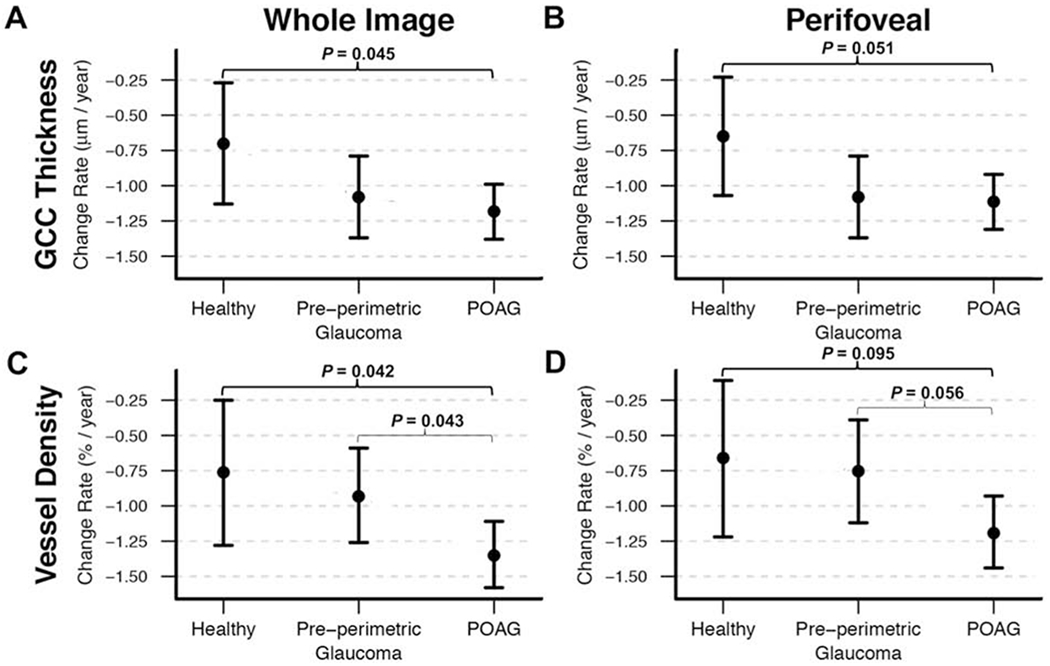
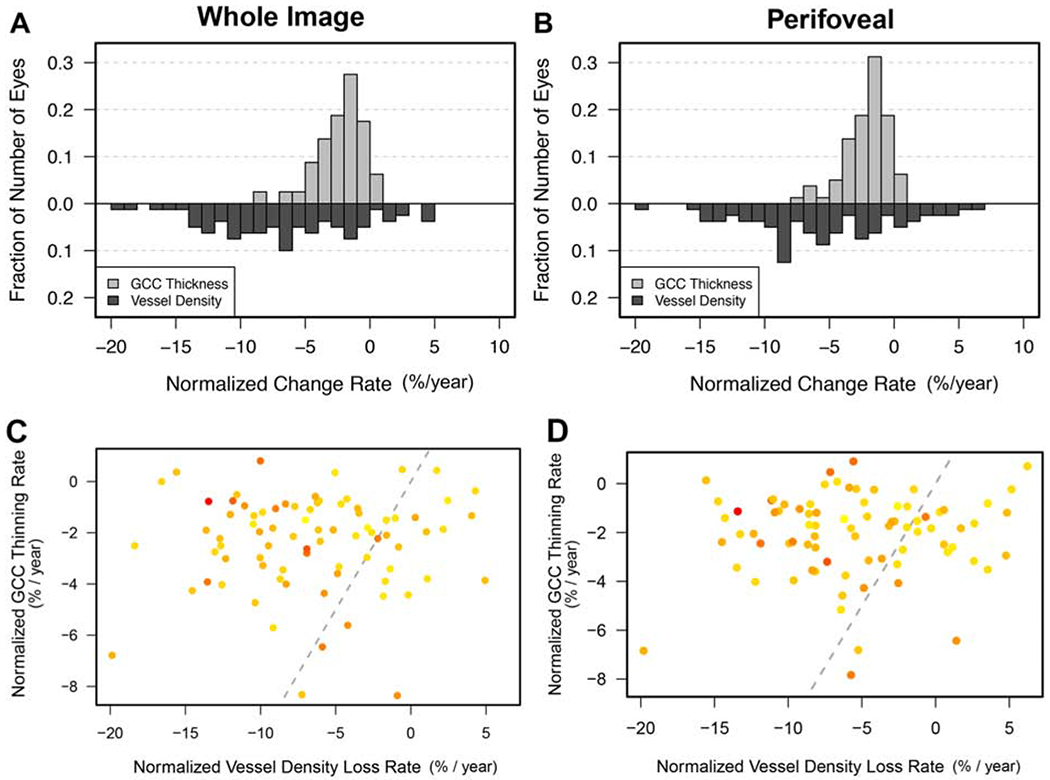
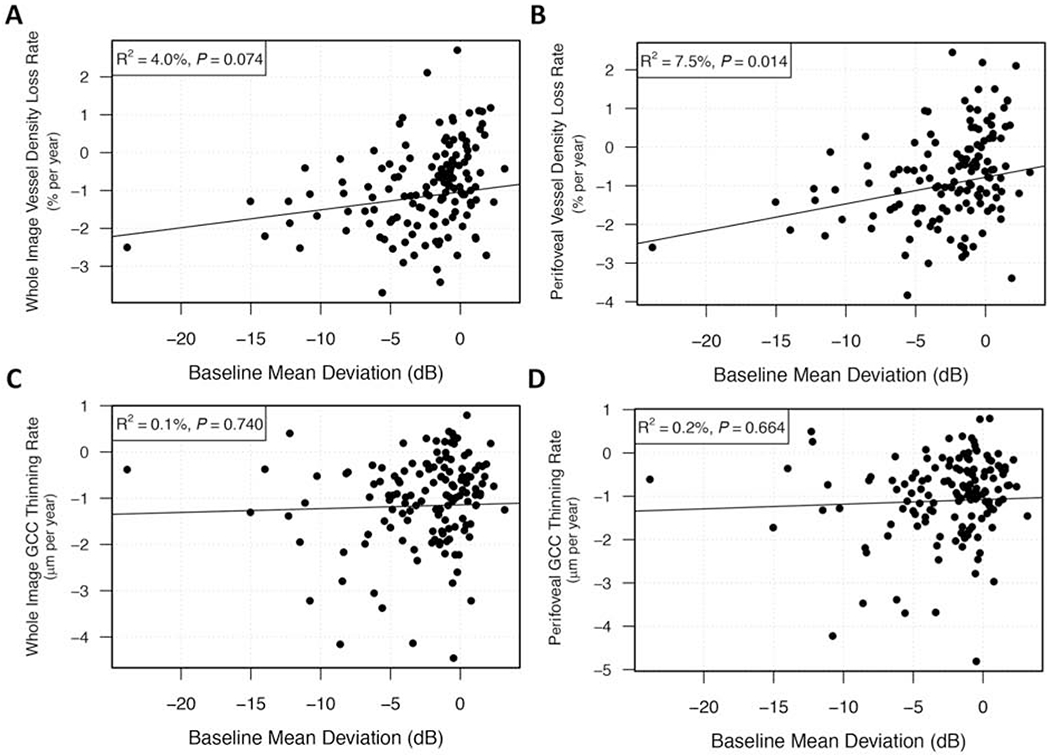
Results: Significant rates of GCC thinning and macular vessel density decrease were detectable in all diagnostic groups (all P < 0.05). In healthy eyes and preperimetric glaucoma eyes, the normalized rates of GCC thinning and macular vessel density decrease were comparable (all P > 0.1). In contrast, the normalized rate (mean, 95% confidence interval) of macular vessel density decrease in the POAG eyes (-7.12 [-8.36, -5.88]%/year) was significantly faster than GCC thinning (-2.13 [-3.35, -0.90]%/year; P < 0.001). In the POAG group, more than two thirds of the eyes showed faster macular vessel density decrease than GCC thinning; faster macular vessel density decrease rate was associated significantly with worse glaucoma severity (P = 0.037). The association between GCC thinning rate and glaucoma severity was not significant (P = 0.586). Intraocular pressure during follow-up significantly affected the rate of GCC thinning in all groups (all P < 0.05) but showed no association with the rate of macular vessel density decrease.

Conclusions: Both GCC thinning and macular vessel density decrease were detectable over time in all diagnostic groups. In POAG eyes, macular vessel density decrease was faster than GCC thinning and was associated with severity of disease. Macular vessel density is useful for evaluating glaucoma progression, particularly in more advanced disease.


Figures

Figure 1.
Figure 1.
Age and scan quality adjusted change rates (mean is presented as dot, and 95% confidence intervals are presented as short line) of (A, B) ganglion cell complex thickness (GCC) and (C, D) vessel density in healthy, pre-perimetric glaucoma and primary open angle glaucoma (POAG) eyes. POAG eyes showed faster rates of both GCC thinning and vessel density loss comparing with healthy eyes, while only faster rate of vessel density loss comparing with pre-perimetric glaucoma eyes.
Figure 2.
Figure 2.
Bar graphs showing the distributions of the normalized change rates (%/year) of (A) whole image and (B) perifoveal ganglion cell complex (GCC) thickness and vessel density in primary open angle glaucoma (POAG) eyes. By average, normalized vessel density loss rates of whole image and perifoveal region were faster than corresponding normalized GCC thinning rates. Scatterplots showing most individual POAG eyes (dots in the left part of the rectangle) had faster (C) whole image and (D) perifoveal vessel density loss than GCC thinning. The gray line is a 1:1 line to separate where normalized slops would be equal. Dots in the left part show eyes had faster vessel density loss comparing with GCC thinning; while dots in the right part represent eyes with faster GCC thinning. The darker (redder) a dot is, the lower baseline visual field mean deviation this eye has. The unit of the normalized coefficients is %/year meaning annual percent change of the dynamic range.
Figure 3
Figure 3
Scatterplots illustrating the linear association between change rates of (A, B) vessel density or (C, D) ganglion cell complex (GCC) thickness and baseline glaucoma severity in primary open angle glaucoma eyes. Vessel density loss rates were associated with baseline visual field mean deviation (MD), that is, the worse the baseline MD was the faster the vessel density lost, while GCC thinning rates showed no such association.
Figure 4
Figure 4
Case example of a 75-year old male with primary open angle glaucoma who was followed from January 2015 to May 2018. The baseline visual field mean deviation (MD) was −25.48 dB (right eye) and −13.10 dB (left eye), and the MD by the end of follow-up was −29.62 dB (right eye) and −14.47 dB (left eye). (A) OCT-A 3×3 mm2 macula superficial vessel density color-coded maps showing higher vessel density at the first visit (left) than the last visit (right); (B) OCT-A measurements trend analyses including regions of superior hemifield (Superior_Hemi), inferior hemifield (Infeirior_Hemi), and early treatment diabetic retinopathy study (ETDRS) grid all show trends of decreasing vessel density in both eyes; (C) ganglion cell complex (GCC) thickness maps showing similar GCC thickness at the first visit (left) with the last visit (right); (D) GCC thickness measurements trend analyses showing stable trends in all Superior_Hemi, Infeirior_Hemi, and ETDRS grid regions of both eyes. OD = right eye; OS = left eye.

Comment in

Similar articles

Cited by

References

    1. Yarmohammadi A, Zangwill LM, Diniz-Filho A, et al. Optical Coherence Tomography Angiography Vessel Density in Healthy, Glaucoma Suspect, and Glaucoma Eyes. Invest Ophthalmol Vis Sci 2016;57(9):OCT451–9. - PMC - PubMed
    1. Yarmohammadi A, Zangwill LM, Diniz-Filho A, et al. Peripapillary and Macular Vessel Density in Patients with Glaucoma and Single-Hemifield Visual Field Defect. Ophthalmology 2017; 124(5):709–19. - PMC - PubMed
    1. Manalastas PIC, Zangwill LM, Saunders LJ, et al. Reproducibility of Optical Coherence Tomography Angiography Macular and Optic Nerve Head Vascular Density in Glaucoma and Healthy Eyes. J Glaucoma 2017;26(10):851–9. - PMC - PubMed
    1. Takusagawa HL, Liu L, Ma KN, et al. Projection-Resolved Optical Coherence Tomography Angiography of Macular Retinal Circulation in Glaucoma. Ophthalmology 2017;124(11):1589–99. - PMC - PubMed
    1. Lei J, Pei C, Wen C, Abdelfattah NS. Repeatability and Reproducibility of Quantification of Superficial Peri-papillary Capillaries by four Different Optical Coherence Tomography Angiography Devices. Sci Rep 2018;8(1):17866. - PMC - PubMed

Publication types

MeSH terms